Cities with the Most Immigrants from Jamaica in New York
RELATED REPORTS & OPTIONS
Jamaica
New York
Compare Cities
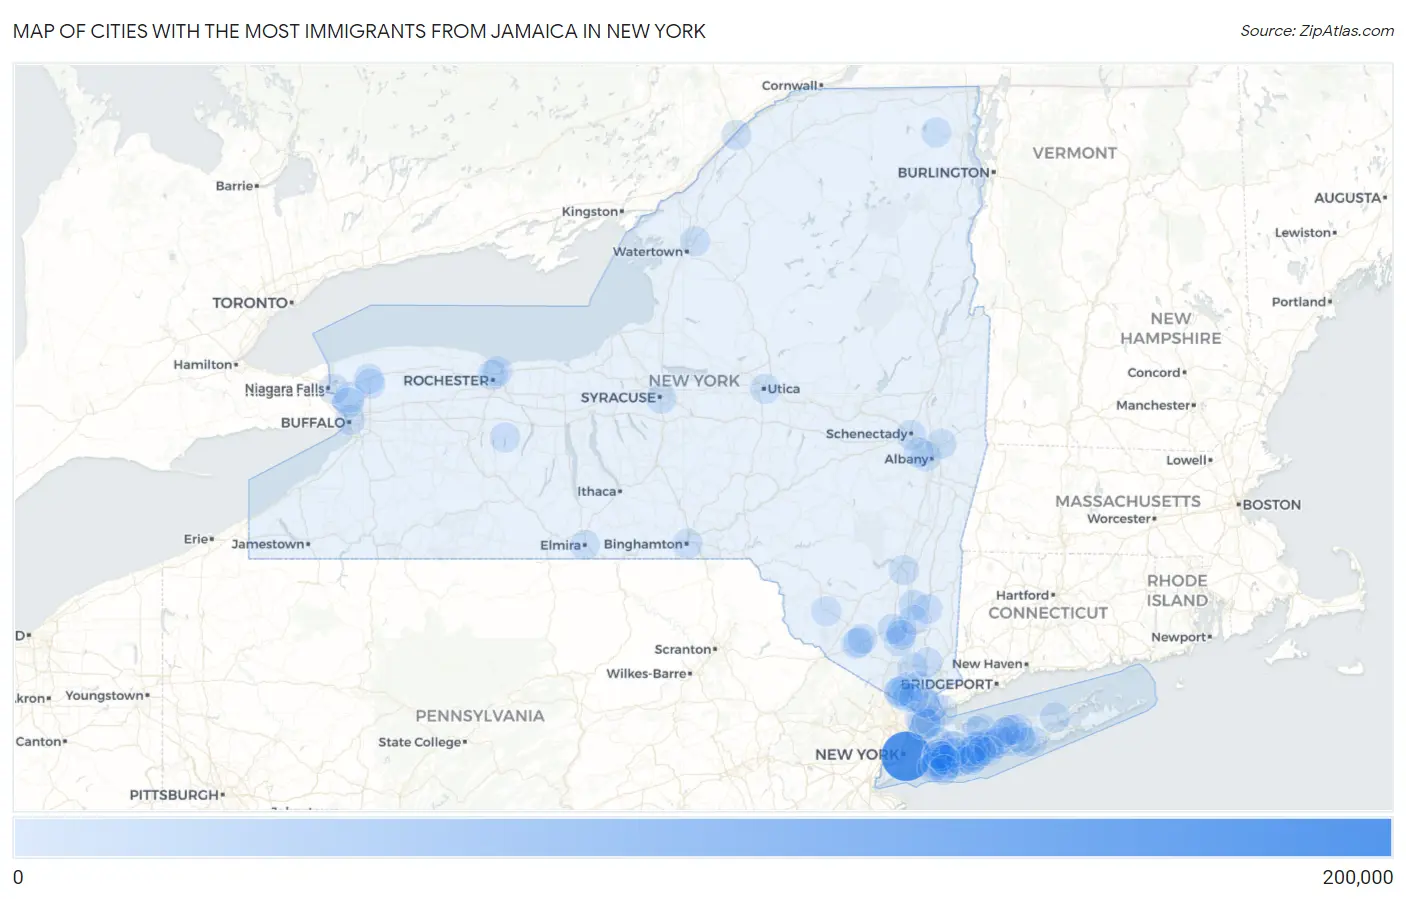
Map of Cities with the Most Immigrants from Jamaica in New York
0
200,000
Cities with the Most Immigrants from Jamaica in New York
| City | Jamaica | vs State | vs National | |
| 1. | New York | 163,774 | 227,557(71.97%)#1 | 785,998(20.84%)#1 |
| 2. | Mount Vernon | 10,785 | 227,557(4.74%)#2 | 785,998(1.37%)#3 |
| 3. | Yonkers | 2,872 | 227,557(1.26%)#3 | 785,998(0.37%)#28 |
| 4. | Hempstead | 2,529 | 227,557(1.11%)#4 | 785,998(0.32%)#34 |
| 5. | Elmont | 1,914 | 227,557(0.84%)#5 | 785,998(0.24%)#48 |
| 6. | Uniondale | 1,765 | 227,557(0.78%)#6 | 785,998(0.22%)#50 |
| 7. | Baldwin | 1,670 | 227,557(0.73%)#7 | 785,998(0.21%)#53 |
| 8. | Poughkeepsie | 1,611 | 227,557(0.71%)#8 | 785,998(0.20%)#56 |
| 9. | Valley Stream | 1,578 | 227,557(0.69%)#9 | 785,998(0.20%)#57 |
| 10. | New Rochelle | 1,445 | 227,557(0.64%)#10 | 785,998(0.18%)#61 |
| 11. | Rochester | 1,372 | 227,557(0.60%)#11 | 785,998(0.17%)#65 |
| 12. | North Valley Stream | 1,246 | 227,557(0.55%)#12 | 785,998(0.16%)#69 |
| 13. | North Amityville | 1,121 | 227,557(0.49%)#13 | 785,998(0.14%)#77 |
| 14. | Albany | 1,056 | 227,557(0.46%)#14 | 785,998(0.13%)#80 |
| 15. | Roosevelt | 919 | 227,557(0.40%)#15 | 785,998(0.12%)#95 |
| 16. | Syracuse | 806 | 227,557(0.35%)#16 | 785,998(0.10%)#109 |
| 17. | Buffalo | 752 | 227,557(0.33%)#17 | 785,998(0.10%)#116 |
| 18. | Peekskill | 738 | 227,557(0.32%)#18 | 785,998(0.09%)#118 |
| 19. | West Babylon | 633 | 227,557(0.28%)#19 | 785,998(0.08%)#139 |
| 20. | Wyandanch | 620 | 227,557(0.27%)#20 | 785,998(0.08%)#143 |
| 21. | Freeport | 611 | 227,557(0.27%)#21 | 785,998(0.08%)#148 |
| 22. | Deer Park | 565 | 227,557(0.25%)#22 | 785,998(0.07%)#162 |
| 23. | White Plains | 556 | 227,557(0.24%)#23 | 785,998(0.07%)#165 |
| 24. | Middletown | 478 | 227,557(0.21%)#24 | 785,998(0.06%)#192 |
| 25. | Nanuet | 472 | 227,557(0.21%)#25 | 785,998(0.06%)#196 |
| 26. | Riverhead | 452 | 227,557(0.20%)#26 | 785,998(0.06%)#200 |
| 27. | New City | 444 | 227,557(0.20%)#27 | 785,998(0.06%)#203 |
| 28. | South Valley Stream | 438 | 227,557(0.19%)#28 | 785,998(0.06%)#210 |
| 29. | Kingston | 410 | 227,557(0.18%)#29 | 785,998(0.05%)#223 |
| 30. | North Bay Shore | 377 | 227,557(0.17%)#30 | 785,998(0.05%)#238 |
| 31. | Coram | 341 | 227,557(0.15%)#31 | 785,998(0.04%)#260 |
| 32. | Ossining | 337 | 227,557(0.15%)#32 | 785,998(0.04%)#262 |
| 33. | Mechanicstown | 331 | 227,557(0.15%)#33 | 785,998(0.04%)#265 |
| 34. | Utica | 326 | 227,557(0.14%)#34 | 785,998(0.04%)#268 |
| 35. | East Massapequa | 318 | 227,557(0.14%)#35 | 785,998(0.04%)#272 |
| 36. | Vails Gate | 318 | 227,557(0.14%)#36 | 785,998(0.04%)#274 |
| 37. | Westbury | 308 | 227,557(0.14%)#37 | 785,998(0.04%)#279 |
| 38. | East Northport | 305 | 227,557(0.13%)#38 | 785,998(0.04%)#282 |
| 39. | Spring Valley | 285 | 227,557(0.13%)#39 | 785,998(0.04%)#295 |
| 40. | West Hempstead | 275 | 227,557(0.12%)#40 | 785,998(0.03%)#304 |
| 41. | Niagara Falls | 270 | 227,557(0.12%)#41 | 785,998(0.03%)#306 |
| 42. | Brentwood | 265 | 227,557(0.12%)#42 | 785,998(0.03%)#309 |
| 43. | Woodmere | 251 | 227,557(0.11%)#43 | 785,998(0.03%)#319 |
| 44. | Central Islip | 232 | 227,557(0.10%)#44 | 785,998(0.03%)#343 |
| 45. | Balmville | 231 | 227,557(0.10%)#45 | 785,998(0.03%)#345 |
| 46. | Schenectady | 215 | 227,557(0.09%)#46 | 785,998(0.03%)#366 |
| 47. | Oceanside | 210 | 227,557(0.09%)#47 | 785,998(0.03%)#373 |
| 48. | Wheatley Heights | 207 | 227,557(0.09%)#48 | 785,998(0.03%)#381 |
| 49. | Scotchtown | 201 | 227,557(0.09%)#49 | 785,998(0.03%)#389 |
| 50. | Lakeview | 194 | 227,557(0.09%)#50 | 785,998(0.02%)#403 |
| 51. | Pelham | 193 | 227,557(0.08%)#51 | 785,998(0.02%)#405 |
| 52. | West Nyack | 185 | 227,557(0.08%)#52 | 785,998(0.02%)#419 |
| 53. | Fairview Cdp Dutchess County | 179 | 227,557(0.08%)#53 | 785,998(0.02%)#431 |
| 54. | New Cassel | 174 | 227,557(0.08%)#54 | 785,998(0.02%)#441 |
| 55. | Hillcrest | 174 | 227,557(0.08%)#55 | 785,998(0.02%)#442 |
| 56. | Holbrook | 171 | 227,557(0.08%)#56 | 785,998(0.02%)#450 |
| 57. | Jefferson Valley Yorktown | 167 | 227,557(0.07%)#57 | 785,998(0.02%)#459 |
| 58. | Freedom Plains | 165 | 227,557(0.07%)#58 | 785,998(0.02%)#468 |
| 59. | Centereach | 162 | 227,557(0.07%)#59 | 785,998(0.02%)#478 |
| 60. | Greenlawn | 156 | 227,557(0.07%)#60 | 785,998(0.02%)#494 |
| 61. | Binghamton | 152 | 227,557(0.07%)#61 | 785,998(0.02%)#507 |
| 62. | Port Chester | 152 | 227,557(0.07%)#62 | 785,998(0.02%)#508 |
| 63. | Lockport | 150 | 227,557(0.07%)#63 | 785,998(0.02%)#515 |
| 64. | Elmsford | 147 | 227,557(0.06%)#64 | 785,998(0.02%)#525 |
| 65. | Elmira | 143 | 227,557(0.06%)#65 | 785,998(0.02%)#534 |
| 66. | Inwood | 139 | 227,557(0.06%)#66 | 785,998(0.02%)#551 |
| 67. | Seaford | 127 | 227,557(0.06%)#67 | 785,998(0.02%)#590 |
| 68. | Fairview Cdp Westchester County | 126 | 227,557(0.06%)#68 | 785,998(0.02%)#597 |
| 69. | North Tonawanda | 122 | 227,557(0.05%)#69 | 785,998(0.02%)#613 |
| 70. | Lindenhurst | 120 | 227,557(0.05%)#70 | 785,998(0.02%)#620 |
| 71. | Calcium | 119 | 227,557(0.05%)#71 | 785,998(0.02%)#628 |
| 72. | East Farmingdale | 118 | 227,557(0.05%)#72 | 785,998(0.02%)#633 |
| 73. | Amityville | 116 | 227,557(0.05%)#73 | 785,998(0.01%)#640 |
| 74. | Islandia | 116 | 227,557(0.05%)#74 | 785,998(0.01%)#641 |
| 75. | North Bellport | 114 | 227,557(0.05%)#75 | 785,998(0.01%)#651 |
| 76. | Shirley | 112 | 227,557(0.05%)#76 | 785,998(0.01%)#655 |
| 77. | Ogdensburg | 111 | 227,557(0.05%)#77 | 785,998(0.01%)#667 |
| 78. | Irondequoit | 107 | 227,557(0.05%)#78 | 785,998(0.01%)#685 |
| 79. | Nyack | 105 | 227,557(0.05%)#79 | 785,998(0.01%)#700 |
| 80. | Medford | 104 | 227,557(0.05%)#80 | 785,998(0.01%)#707 |
| 81. | Troy | 100 | 227,557(0.04%)#81 | 785,998(0.01%)#721 |
| 82. | Manhasset | 100 | 227,557(0.04%)#82 | 785,998(0.01%)#725 |
| 83. | Selden | 99 | 227,557(0.04%)#83 | 785,998(0.01%)#729 |
| 84. | Honeoye | 97 | 227,557(0.04%)#84 | 785,998(0.01%)#744 |
| 85. | East Meadow | 96 | 227,557(0.04%)#85 | 785,998(0.01%)#746 |
| 86. | Westmere | 96 | 227,557(0.04%)#86 | 785,998(0.01%)#749 |
| 87. | Monticello | 96 | 227,557(0.04%)#87 | 785,998(0.01%)#750 |
| 88. | South Floral Park | 96 | 227,557(0.04%)#88 | 785,998(0.01%)#753 |
| 89. | Franklin Square | 94 | 227,557(0.04%)#89 | 785,998(0.01%)#759 |
| 90. | Lake Grove | 94 | 227,557(0.04%)#90 | 785,998(0.01%)#760 |
| 91. | Bay Shore | 90 | 227,557(0.04%)#91 | 785,998(0.01%)#783 |
| 92. | North Babylon | 83 | 227,557(0.04%)#92 | 785,998(0.01%)#830 |
| 93. | South Lockport | 80 | 227,557(0.04%)#93 | 785,998(0.01%)#848 |
| 94. | Rockville Centre | 79 | 227,557(0.03%)#94 | 785,998(0.01%)#853 |
| 95. | Orange Lake | 78 | 227,557(0.03%)#95 | 785,998(0.01%)#859 |
| 96. | Wappingers Falls | 77 | 227,557(0.03%)#96 | 785,998(0.01%)#866 |
| 97. | Island Park | 75 | 227,557(0.03%)#97 | 785,998(0.01%)#877 |
| 98. | Tonawanda | 74 | 227,557(0.03%)#98 | 785,998(0.01%)#880 |
| 99. | Newburgh | 72 | 227,557(0.03%)#99 | 785,998(0.01%)#902 |
| 100. | Dannemora | 70 | 227,557(0.03%)#100 | 785,998(0.01%)#933 |
Common Questions
What are the Top 10 Cities with the Most Immigrants from Jamaica in New York?
Top 10 Cities with the Most Immigrants from Jamaica in New York are:
#1
163,774
#2
10,785
#3
2,872
#4
2,529
#5
1,914
#6
1,765
#7
1,670
#8
1,611
#9
1,578
#10
1,445
What city has the Most Immigrants from Jamaica in New York?
New York has the Most Immigrants from Jamaica in New York with 163,774.
What is the Total Immigrants from Jamaica in the State of New York?
Total Immigrants from Jamaica in New York is 227,557.
What is the Total Immigrants from Jamaica in the United States?
Total Immigrants from Jamaica in the United States is 785,998.