Cities with the Most Immigrants from Jamaica in Michigan
RELATED REPORTS & OPTIONS
Jamaica
Michigan
Compare Cities
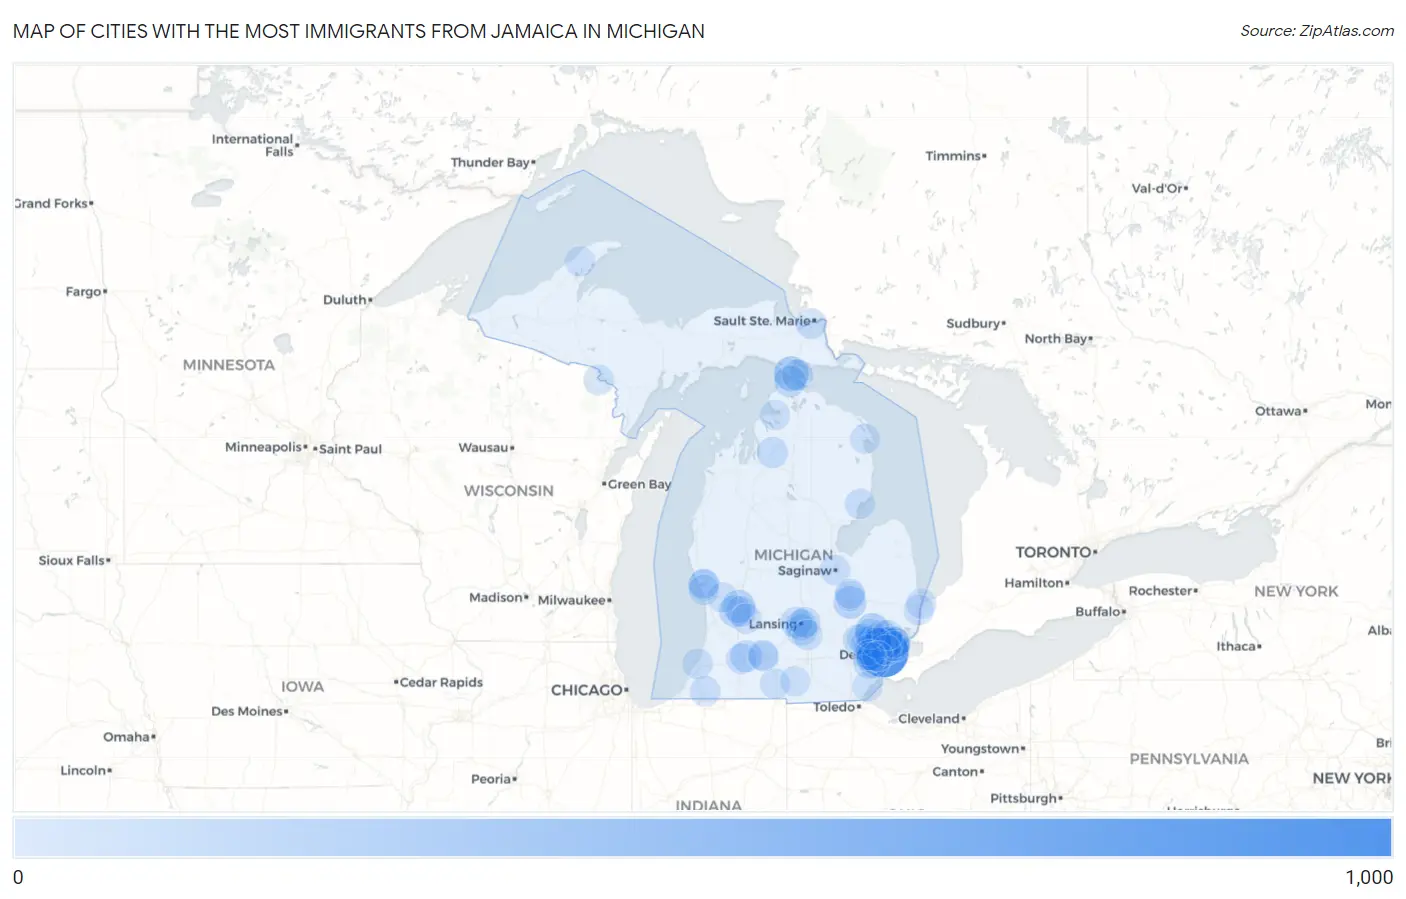
Map of Cities with the Most Immigrants from Jamaica in Michigan
0
1,000
Cities with the Most Immigrants from Jamaica in Michigan
| City | Jamaica | vs State | vs National | |
| 1. | Detroit | 844 | 4,645(18.17%)#1 | 785,998(0.11%)#100 |
| 2. | Southfield | 259 | 4,645(5.58%)#2 | 785,998(0.03%)#312 |
| 3. | St Ignace | 196 | 4,645(4.22%)#3 | 785,998(0.02%)#397 |
| 4. | Eastpointe | 182 | 4,645(3.92%)#4 | 785,998(0.02%)#425 |
| 5. | Pontiac | 154 | 4,645(3.32%)#5 | 785,998(0.02%)#500 |
| 6. | Grand Rapids | 111 | 4,645(2.39%)#6 | 785,998(0.01%)#660 |
| 7. | Flint | 110 | 4,645(2.37%)#7 | 785,998(0.01%)#668 |
| 8. | Wyoming | 84 | 4,645(1.81%)#8 | 785,998(0.01%)#815 |
| 9. | Farmington Hills | 73 | 4,645(1.57%)#9 | 785,998(0.01%)#889 |
| 10. | Mackinaw City | 71 | 4,645(1.53%)#10 | 785,998(0.01%)#925 |
| 11. | Comstock Northwest | 67 | 4,645(1.44%)#11 | 785,998(0.01%)#967 |
| 12. | Highland Park | 65 | 4,645(1.40%)#12 | 785,998(0.01%)#987 |
| 13. | Wixom | 59 | 4,645(1.27%)#13 | 785,998(0.01%)#1,048 |
| 14. | Holt | 57 | 4,645(1.23%)#14 | 785,998(0.01%)#1,072 |
| 15. | Warren | 54 | 4,645(1.16%)#15 | 785,998(0.01%)#1,104 |
| 16. | Romulus | 52 | 4,645(1.12%)#16 | 785,998(0.01%)#1,135 |
| 17. | Westland | 50 | 4,645(1.08%)#17 | 785,998(0.01%)#1,163 |
| 18. | Muskegon | 50 | 4,645(1.08%)#18 | 785,998(0.01%)#1,168 |
| 19. | Waverly | 50 | 4,645(1.08%)#19 | 785,998(0.01%)#1,169 |
| 20. | Mackinac Island | 47 | 4,645(1.01%)#20 | 785,998(0.01%)#1,215 |
| 21. | Lansing | 42 | 4,645(0.90%)#21 | 785,998(0.01%)#1,276 |
| 22. | Taylor | 40 | 4,645(0.86%)#22 | 785,998(0.01%)#1,312 |
| 23. | Oak Park | 39 | 4,645(0.84%)#23 | 785,998(0.00%)#1,329 |
| 24. | Mancelona | 39 | 4,645(0.84%)#24 | 785,998(0.00%)#1,343 |
| 25. | Walled Lake | 31 | 4,645(0.67%)#25 | 785,998(0.00%)#1,510 |
| 26. | Livonia | 30 | 4,645(0.65%)#26 | 785,998(0.00%)#1,513 |
| 27. | Troy | 30 | 4,645(0.65%)#27 | 785,998(0.00%)#1,514 |
| 28. | Kentwood | 29 | 4,645(0.62%)#28 | 785,998(0.00%)#1,542 |
| 29. | East Lansing | 23 | 4,645(0.50%)#29 | 785,998(0.00%)#1,732 |
| 30. | Sault Ste Marie | 23 | 4,645(0.50%)#30 | 785,998(0.00%)#1,739 |
| 31. | Kalamazoo | 18 | 4,645(0.39%)#31 | 785,998(0.00%)#1,927 |
| 32. | Norton Shores | 18 | 4,645(0.39%)#32 | 785,998(0.00%)#1,938 |
| 33. | St Clair Shores | 16 | 4,645(0.34%)#33 | 785,998(0.00%)#2,018 |
| 34. | Grosse Pointe Woods | 16 | 4,645(0.34%)#34 | 785,998(0.00%)#2,033 |
| 35. | Lathrup Village | 16 | 4,645(0.34%)#35 | 785,998(0.00%)#2,050 |
| 36. | Garden City | 15 | 4,645(0.32%)#36 | 785,998(0.00%)#2,074 |
| 37. | Springfield | 14 | 4,645(0.30%)#37 | 785,998(0.00%)#2,137 |
| 38. | Saginaw | 13 | 4,645(0.28%)#38 | 785,998(0.00%)#2,154 |
| 39. | Marysville | 13 | 4,645(0.28%)#39 | 785,998(0.00%)#2,174 |
| 40. | Lake Michigan Beach | 13 | 4,645(0.28%)#40 | 785,998(0.00%)#2,199 |
| 41. | Niles | 12 | 4,645(0.26%)#41 | 785,998(0.00%)#2,232 |
| 42. | Keego Harbor | 12 | 4,645(0.26%)#42 | 785,998(0.00%)#2,249 |
| 43. | Kingsford | 11 | 4,645(0.24%)#43 | 785,998(0.00%)#2,302 |
| 44. | Hamtramck | 9 | 4,645(0.19%)#44 | 785,998(0.00%)#2,421 |
| 45. | Tawas City | 9 | 4,645(0.19%)#45 | 785,998(0.00%)#2,465 |
| 46. | Sterling Heights | 8 | 4,645(0.17%)#46 | 785,998(0.00%)#2,472 |
| 47. | Mason | 8 | 4,645(0.17%)#47 | 785,998(0.00%)#2,508 |
| 48. | Dearborn | 7 | 4,645(0.15%)#48 | 785,998(0.00%)#2,550 |
| 49. | Battle Creek | 7 | 4,645(0.15%)#49 | 785,998(0.00%)#2,552 |
| 50. | Port Huron | 7 | 4,645(0.15%)#50 | 785,998(0.00%)#2,558 |
| 51. | Coldwater | 7 | 4,645(0.15%)#51 | 785,998(0.00%)#2,577 |
| 52. | Caledonia | 6 | 4,645(0.13%)#52 | 785,998(0.00%)#2,673 |
| 53. | Jonesville | 5 | 4,645(0.11%)#53 | 785,998(0.00%)#2,724 |
| 54. | Laurium | 5 | 4,645(0.11%)#54 | 785,998(0.00%)#2,738 |
| 55. | Alpena | 4 | 4,645(0.09%)#55 | 785,998(0.00%)#2,770 |
| 56. | Petoskey | 4 | 4,645(0.09%)#56 | 785,998(0.00%)#2,778 |
| 57. | Beecher | 3 | 4,645(0.06%)#57 | 785,998(0.00%)#2,831 |
| 58. | Inkster | 2 | 4,645(0.04%)#58 | 785,998(0.00%)#2,881 |
| 59. | Monroe | 1 | 4,645(0.02%)#59 | 785,998(0.00%)#2,958 |
| 60. | Coopersville | 1 | 4,645(0.02%)#60 | 785,998(0.00%)#2,981 |
| 61. | North Muskegon | 1 | 4,645(0.02%)#61 | 785,998(0.00%)#2,982 |
| 62. | Mount Morris | 1 | 4,645(0.02%)#62 | 785,998(0.00%)#2,985 |
Common Questions
What are the Top 10 Cities with the Most Immigrants from Jamaica in Michigan?
Top 10 Cities with the Most Immigrants from Jamaica in Michigan are:
#1
844
#2
259
#3
196
#4
182
#5
154
#6
111
#7
110
#8
84
#9
73
#10
71
What city has the Most Immigrants from Jamaica in Michigan?
Detroit has the Most Immigrants from Jamaica in Michigan with 844.
What is the Total Immigrants from Jamaica in the State of Michigan?
Total Immigrants from Jamaica in Michigan is 4,645.
What is the Total Immigrants from Jamaica in the United States?
Total Immigrants from Jamaica in the United States is 785,998.