Cities with the Lowest Poverty Level Among Children Under the Age of 5 in Florida
RELATED REPORTS & OPTIONS
Lowest Poverty | Child 0-5
Florida
Compare Cities
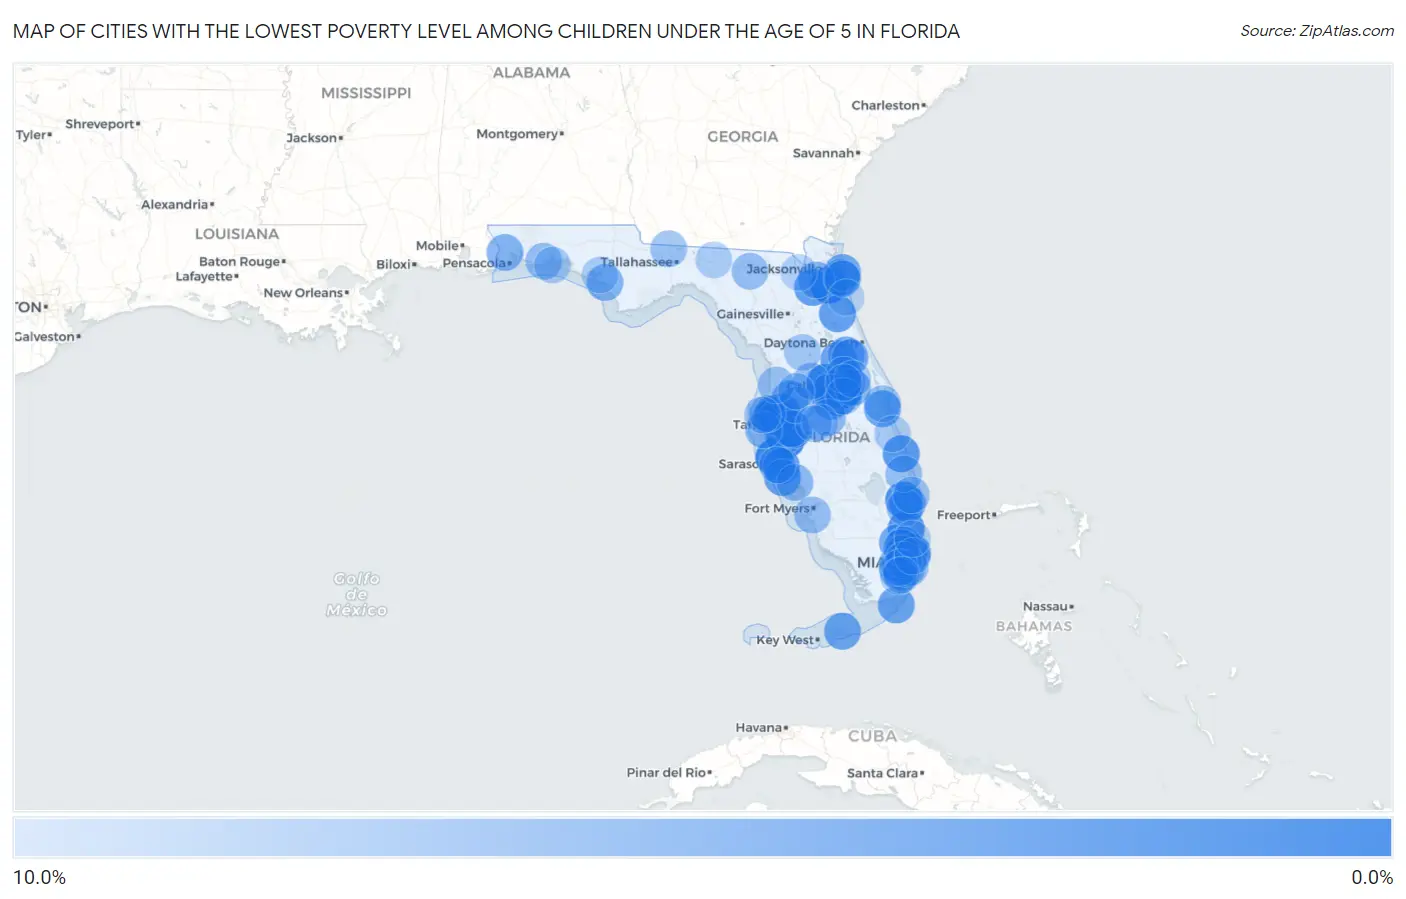
Map of Cities with the Lowest Poverty Level Among Children Under the Age of 5 in Florida
10.0%
0.0%
Cities with the Lowest Poverty Level Among Children Under the Age of 5 in Florida
| City | Child Poverty | vs State | vs National | |
| 1. | Fruit Cove | 0.22% | 19.3%(-19.0)#1 | 18.1%(-17.8)#4 |
| 2. | Sun City Center | 0.83% | 19.3%(-18.4)#2 | 18.1%(-17.2)#67 |
| 3. | Conway | 0.84% | 19.3%(-18.4)#3 | 18.1%(-17.2)#69 |
| 4. | Keystone | 0.88% | 19.3%(-18.4)#4 | 18.1%(-17.2)#76 |
| 5. | Bayshore Gardens | 0.92% | 19.3%(-18.3)#5 | 18.1%(-17.1)#83 |
| 6. | Montverde | 0.98% | 19.3%(-18.3)#6 | 18.1%(-17.1)#99 |
| 7. | The Acreage | 1.5% | 19.3%(-17.8)#7 | 18.1%(-16.6)#206 |
| 8. | Hurlburt Field | 1.6% | 19.3%(-17.7)#8 | 18.1%(-16.5)#226 |
| 9. | Virginia Gardens | 1.6% | 19.3%(-17.7)#9 | 18.1%(-16.5)#227 |
| 10. | Northdale | 1.8% | 19.3%(-17.5)#10 | 18.1%(-16.3)#273 |
| 11. | Apollo Beach | 1.9% | 19.3%(-17.3)#11 | 18.1%(-16.1)#315 |
| 12. | Sunny Isles Beach | 2.0% | 19.3%(-17.3)#12 | 18.1%(-16.1)#335 |
| 13. | Hunters Creek | 2.1% | 19.3%(-17.1)#13 | 18.1%(-15.9)#387 |
| 14. | Parkland | 2.2% | 19.3%(-17.0)#14 | 18.1%(-15.8)#422 |
| 15. | Goldenrod | 2.3% | 19.3%(-17.0)#15 | 18.1%(-15.8)#430 |
| 16. | El Portal | 2.3% | 19.3%(-17.0)#16 | 18.1%(-15.8)#441 |
| 17. | Lake Sarasota | 2.4% | 19.3%(-16.8)#17 | 18.1%(-15.6)#485 |
| 18. | St Lucie Village | 2.4% | 19.3%(-16.8)#18 | 18.1%(-15.6)#487 |
| 19. | Lutz | 2.5% | 19.3%(-16.8)#19 | 18.1%(-15.6)#505 |
| 20. | Windermere | 2.9% | 19.3%(-16.4)#20 | 18.1%(-15.2)#662 |
| 21. | Westview | 3.0% | 19.3%(-16.2)#21 | 18.1%(-15.1)#711 |
| 22. | Venice | 3.2% | 19.3%(-16.1)#22 | 18.1%(-14.9)#769 |
| 23. | Palm Springs North | 3.3% | 19.3%(-16.0)#23 | 18.1%(-14.8)#812 |
| 24. | Flagler Estates | 3.3% | 19.3%(-16.0)#24 | 18.1%(-14.8)#821 |
| 25. | Middleburg | 3.4% | 19.3%(-15.9)#25 | 18.1%(-14.7)#874 |
| 26. | Palm Valley | 3.5% | 19.3%(-15.7)#26 | 18.1%(-14.5)#922 |
| 27. | Pine Lakes | 3.5% | 19.3%(-15.7)#27 | 18.1%(-14.5)#926 |
| 28. | Liberty Triangle | 3.6% | 19.3%(-15.7)#28 | 18.1%(-14.5)#941 |
| 29. | Palm Shores | 3.6% | 19.3%(-15.6)#29 | 18.1%(-14.4)#973 |
| 30. | Key Largo | 3.6% | 19.3%(-15.6)#30 | 18.1%(-14.4)#979 |
| 31. | The Crossings | 3.7% | 19.3%(-15.6)#31 | 18.1%(-14.4)#981 |
| 32. | Belle Isle | 3.7% | 19.3%(-15.6)#32 | 18.1%(-14.4)#991 |
| 33. | Big Pine Key | 3.7% | 19.3%(-15.6)#33 | 18.1%(-14.4)#992 |
| 34. | Westchase | 3.9% | 19.3%(-15.4)#34 | 18.1%(-14.2)#1,087 |
| 35. | Carrollwood | 3.9% | 19.3%(-15.3)#35 | 18.1%(-14.1)#1,108 |
| 36. | Celebration | 4.0% | 19.3%(-15.2)#36 | 18.1%(-14.0)#1,143 |
| 37. | Weston | 4.2% | 19.3%(-15.1)#37 | 18.1%(-13.9)#1,180 |
| 38. | Jacksonville Beach | 4.2% | 19.3%(-15.0)#38 | 18.1%(-13.9)#1,222 |
| 39. | Ives Estates | 4.2% | 19.3%(-15.0)#39 | 18.1%(-13.8)#1,228 |
| 40. | Deland | 4.3% | 19.3%(-14.9)#40 | 18.1%(-13.7)#1,259 |
| 41. | Lake Helen | 4.3% | 19.3%(-14.9)#41 | 18.1%(-13.7)#1,268 |
| 42. | Fish Hawk | 4.5% | 19.3%(-14.8)#42 | 18.1%(-13.6)#1,326 |
| 43. | Horizon West | 4.5% | 19.3%(-14.7)#43 | 18.1%(-13.6)#1,336 |
| 44. | San Antonio | 4.6% | 19.3%(-14.6)#44 | 18.1%(-13.4)#1,388 |
| 45. | Royal Palm Beach | 4.7% | 19.3%(-14.6)#45 | 18.1%(-13.4)#1,405 |
| 46. | Westchester | 4.7% | 19.3%(-14.5)#46 | 18.1%(-13.3)#1,434 |
| 47. | Cooper City | 4.8% | 19.3%(-14.5)#47 | 18.1%(-13.3)#1,479 |
| 48. | Alafaya | 4.8% | 19.3%(-14.5)#48 | 18.1%(-13.3)#1,486 |
| 49. | Bloomingdale | 4.9% | 19.3%(-14.3)#49 | 18.1%(-13.1)#1,543 |
| 50. | Gonzalez | 5.3% | 19.3%(-14.0)#50 | 18.1%(-12.8)#1,703 |
| 51. | Vero Lake Estates | 5.4% | 19.3%(-13.9)#51 | 18.1%(-12.7)#1,732 |
| 52. | Callaway | 5.4% | 19.3%(-13.9)#52 | 18.1%(-12.7)#1,743 |
| 53. | Palmetto Bay | 5.4% | 19.3%(-13.8)#53 | 18.1%(-12.6)#1,759 |
| 54. | South Miami | 5.5% | 19.3%(-13.8)#54 | 18.1%(-12.6)#1,772 |
| 55. | Bardmoor | 5.5% | 19.3%(-13.8)#55 | 18.1%(-12.6)#1,777 |
| 56. | Oakleaf Plantation | 5.5% | 19.3%(-13.7)#56 | 18.1%(-12.6)#1,786 |
| 57. | Tamiami | 5.6% | 19.3%(-13.6)#57 | 18.1%(-12.4)#1,848 |
| 58. | Sawgrass | 5.8% | 19.3%(-13.4)#58 | 18.1%(-12.3)#1,913 |
| 59. | Kendale Lakes | 5.9% | 19.3%(-13.4)#59 | 18.1%(-12.2)#1,931 |
| 60. | Coral Gables | 5.9% | 19.3%(-13.4)#60 | 18.1%(-12.2)#1,949 |
| 61. | Longwood | 6.0% | 19.3%(-13.3)#61 | 18.1%(-12.1)#1,980 |
| 62. | Lake Hamilton | 6.0% | 19.3%(-13.2)#62 | 18.1%(-12.0)#1,991 |
| 63. | North Port | 6.0% | 19.3%(-13.2)#63 | 18.1%(-12.0)#2,000 |
| 64. | Zephyrhills | 6.1% | 19.3%(-13.2)#64 | 18.1%(-12.0)#2,011 |
| 65. | Miami Lakes | 6.2% | 19.3%(-13.1)#65 | 18.1%(-11.9)#2,059 |
| 66. | Vilano Beach | 6.2% | 19.3%(-13.1)#66 | 18.1%(-11.9)#2,061 |
| 67. | Mascotte | 6.2% | 19.3%(-13.0)#67 | 18.1%(-11.8)#2,080 |
| 68. | East Lake | 6.3% | 19.3%(-13.0)#68 | 18.1%(-11.8)#2,112 |
| 69. | Wellington | 6.4% | 19.3%(-12.8)#69 | 18.1%(-11.6)#2,166 |
| 70. | Ocean City | 6.5% | 19.3%(-12.8)#70 | 18.1%(-11.6)#2,182 |
| 71. | Live Oak | 6.6% | 19.3%(-12.7)#71 | 18.1%(-11.5)#2,216 |
| 72. | Cypress Lake | 6.6% | 19.3%(-12.7)#72 | 18.1%(-11.5)#2,219 |
| 73. | Key Biscayne | 6.6% | 19.3%(-12.7)#73 | 18.1%(-11.5)#2,229 |
| 74. | Palm City | 6.6% | 19.3%(-12.6)#74 | 18.1%(-11.5)#2,239 |
| 75. | Merritt Island | 6.9% | 19.3%(-12.4)#75 | 18.1%(-11.2)#2,358 |
| 76. | Meadow Woods | 6.9% | 19.3%(-12.4)#76 | 18.1%(-11.2)#2,361 |
| 77. | High Point | 6.9% | 19.3%(-12.4)#77 | 18.1%(-11.2)#2,367 |
| 78. | Palm Beach Gardens | 6.9% | 19.3%(-12.3)#78 | 18.1%(-11.1)#2,399 |
| 79. | Southgate | 7.0% | 19.3%(-12.3)#79 | 18.1%(-11.1)#2,411 |
| 80. | Havana | 7.0% | 19.3%(-12.3)#80 | 18.1%(-11.1)#2,412 |
| 81. | Palm Harbor | 7.3% | 19.3%(-12.0)#81 | 18.1%(-10.8)#2,534 |
| 82. | Eagle Lake | 7.4% | 19.3%(-11.9)#82 | 18.1%(-10.7)#2,589 |
| 83. | Lacoochee | 7.5% | 19.3%(-11.8)#83 | 18.1%(-10.6)#2,614 |
| 84. | Belleview | 7.5% | 19.3%(-11.8)#84 | 18.1%(-10.6)#2,625 |
| 85. | Pembroke Pines | 7.5% | 19.3%(-11.7)#85 | 18.1%(-10.5)#2,643 |
| 86. | Miami Springs | 7.5% | 19.3%(-11.7)#86 | 18.1%(-10.5)#2,647 |
| 87. | Goulds | 7.6% | 19.3%(-11.7)#87 | 18.1%(-10.5)#2,661 |
| 88. | Sunset | 7.6% | 19.3%(-11.7)#88 | 18.1%(-10.5)#2,664 |
| 89. | Surfside | 7.6% | 19.3%(-11.6)#89 | 18.1%(-10.4)#2,682 |
| 90. | Destin | 7.7% | 19.3%(-11.6)#90 | 18.1%(-10.4)#2,690 |
| 91. | Oviedo | 7.7% | 19.3%(-11.6)#91 | 18.1%(-10.4)#2,693 |
| 92. | Highland City | 8.0% | 19.3%(-11.3)#92 | 18.1%(-10.1)#2,816 |
| 93. | Lynn Haven | 8.0% | 19.3%(-11.3)#93 | 18.1%(-10.1)#2,826 |
| 94. | Sebastian | 8.1% | 19.3%(-11.2)#94 | 18.1%(-9.99)#2,856 |
| 95. | Greenville | 8.1% | 19.3%(-11.2)#95 | 18.1%(-9.97)#2,867 |
| 96. | Wilton Manors | 8.2% | 19.3%(-11.0)#96 | 18.1%(-9.82)#2,923 |
| 97. | Macclenny | 8.3% | 19.3%(-11.0)#97 | 18.1%(-9.76)#2,942 |
| 98. | Cutler Bay | 8.4% | 19.3%(-10.8)#98 | 18.1%(-9.63)#3,014 |
| 99. | Winter Park | 8.5% | 19.3%(-10.8)#99 | 18.1%(-9.61)#3,021 |
| 100. | St Augustine | 8.8% | 19.3%(-10.5)#100 | 18.1%(-9.30)#3,154 |
Common Questions
What are the Top 10 Cities with the Lowest Poverty Level Among Children Under the Age of 5 in Florida?
Top 10 Cities with the Lowest Poverty Level Among Children Under the Age of 5 in Florida are:
#1
0.22%
#2
0.83%
#3
0.84%
#4
0.88%
#5
0.92%
#6
0.98%
#7
1.5%
#8
1.6%
#9
1.8%
#10
1.9%
What city has the Lowest Poverty Level Among Children Under the Age of 5 in Florida?
Fruit Cove has the Lowest Poverty Level Among Children Under the Age of 5 in Florida with 0.22%.
What is the Poverty Level Among Children Under the Age of 5 in the State of Florida?
Poverty Level Among Children Under the Age of 5 in Florida is 19.3%.
What is the Poverty Level Among Children Under the Age of 5 in the United States?
Poverty Level Among Children Under the Age of 5 in the United States is 18.1%.