Cities with the Lowest Poverty Level Among Children Under the Age of 5 in Oregon
RELATED REPORTS & OPTIONS
Lowest Poverty | Child 0-5
Oregon
Compare Cities
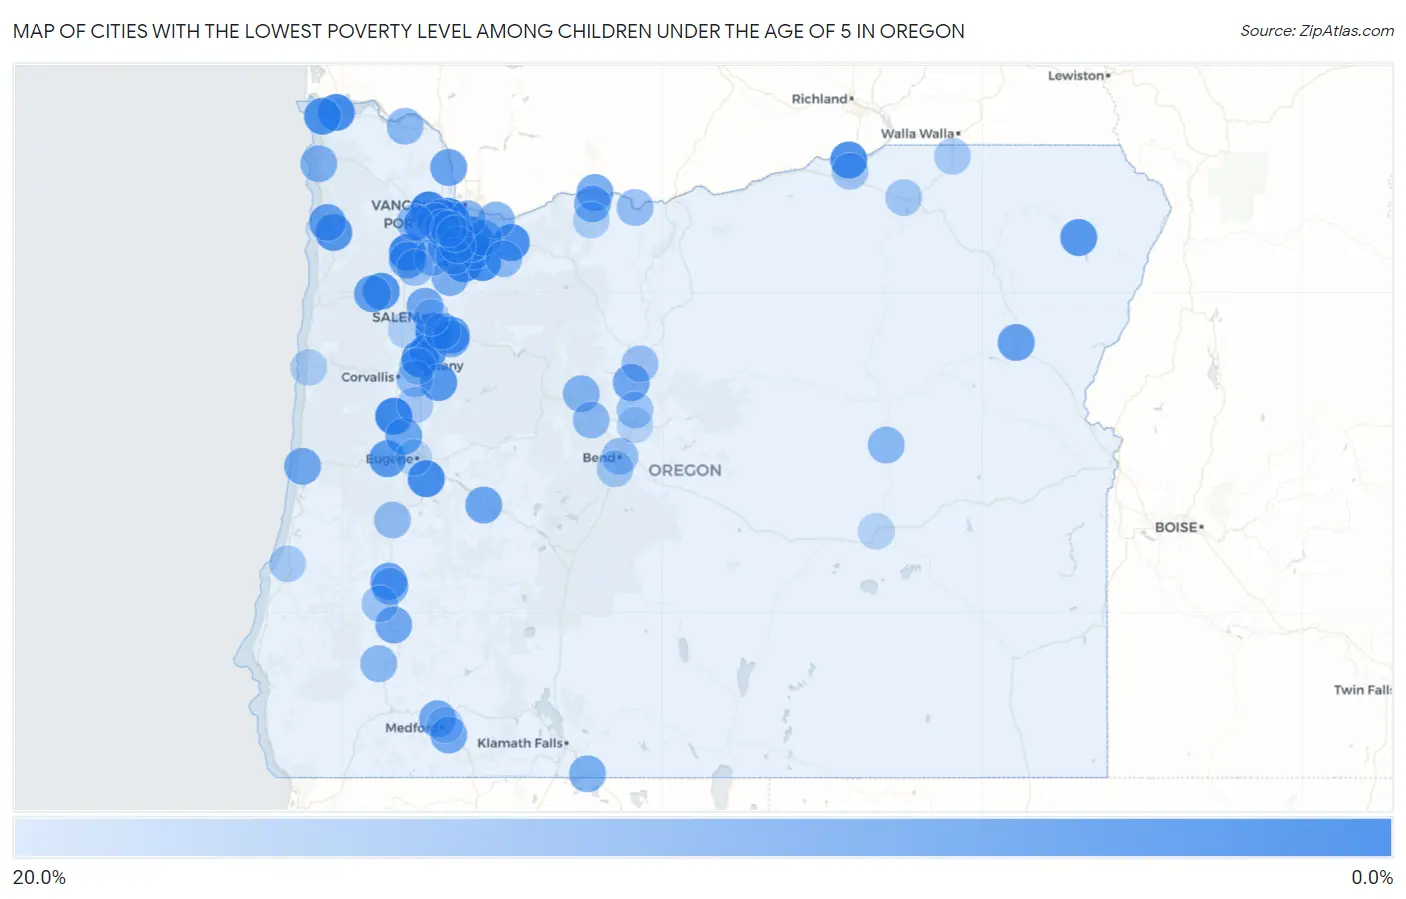
Map of Cities with the Lowest Poverty Level Among Children Under the Age of 5 in Oregon
20.0%
0.0%
Cities with the Lowest Poverty Level Among Children Under the Age of 5 in Oregon
| City | Child Poverty | vs State | vs National | |
| 1. | Bethany | 0.69% | 14.6%(-13.9)#1 | 18.1%(-17.4)#45 |
| 2. | North Plains | 1.2% | 14.6%(-13.4)#2 | 18.1%(-16.9)#139 |
| 3. | Millersburg | 1.5% | 14.6%(-13.1)#3 | 18.1%(-16.6)#198 |
| 4. | Yamhill | 1.7% | 14.6%(-12.9)#4 | 18.1%(-16.4)#240 |
| 5. | Monroe | 1.7% | 14.6%(-12.8)#5 | 18.1%(-16.3)#260 |
| 6. | Turner | 1.8% | 14.6%(-12.7)#6 | 18.1%(-16.2)#298 |
| 7. | Oak Hills | 1.9% | 14.6%(-12.6)#7 | 18.1%(-16.1)#325 |
| 8. | Canby | 2.0% | 14.6%(-12.6)#8 | 18.1%(-16.0)#347 |
| 9. | Lake Oswego | 2.7% | 14.6%(-11.9)#9 | 18.1%(-15.4)#576 |
| 10. | Milwaukie | 2.8% | 14.6%(-11.8)#10 | 18.1%(-15.3)#617 |
| 11. | Creswell | 2.9% | 14.6%(-11.6)#11 | 18.1%(-15.1)#683 |
| 12. | Astoria | 3.0% | 14.6%(-11.6)#12 | 18.1%(-15.1)#712 |
| 13. | Beavercreek | 3.2% | 14.6%(-11.3)#13 | 18.1%(-14.8)#799 |
| 14. | Sandy | 3.3% | 14.6%(-11.3)#14 | 18.1%(-14.8)#827 |
| 15. | Umatilla | 3.4% | 14.6%(-11.2)#15 | 18.1%(-14.7)#859 |
| 16. | West Linn | 3.6% | 14.6%(-11.0)#16 | 18.1%(-14.5)#950 |
| 17. | Cedar Mill | 3.7% | 14.6%(-10.9)#17 | 18.1%(-14.4)#983 |
| 18. | Oak Grove | 3.7% | 14.6%(-10.8)#18 | 18.1%(-14.3)#1,025 |
| 19. | Warrenton | 4.2% | 14.6%(-10.3)#19 | 18.1%(-13.8)#1,229 |
| 20. | Jefferson | 4.6% | 14.6%(-9.96)#20 | 18.1%(-13.4)#1,386 |
| 21. | Sheridan | 4.8% | 14.6%(-9.78)#21 | 18.1%(-13.3)#1,484 |
| 22. | Tillamook | 4.9% | 14.6%(-9.66)#22 | 18.1%(-13.2)#1,532 |
| 23. | Cornelius | 5.1% | 14.6%(-9.46)#23 | 18.1%(-12.9)#1,621 |
| 24. | Lebanon | 5.3% | 14.6%(-9.30)#24 | 18.1%(-12.8)#1,701 |
| 25. | Enterprise | 5.3% | 14.6%(-9.26)#25 | 18.1%(-12.8)#1,711 |
| 26. | Sublimity | 5.6% | 14.6%(-8.96)#26 | 18.1%(-12.5)#1,836 |
| 27. | Veneta | 5.7% | 14.6%(-8.91)#27 | 18.1%(-12.4)#1,859 |
| 28. | Garden Home Whitford | 6.2% | 14.6%(-8.37)#28 | 18.1%(-11.9)#2,063 |
| 29. | Sherwood | 6.4% | 14.6%(-8.18)#29 | 18.1%(-11.7)#2,151 |
| 30. | Tualatin | 6.6% | 14.6%(-7.97)#30 | 18.1%(-11.5)#2,235 |
| 31. | River Road | 6.9% | 14.6%(-7.62)#31 | 18.1%(-11.1)#2,400 |
| 32. | Bay City | 7.0% | 14.6%(-7.61)#32 | 18.1%(-11.1)#2,404 |
| 33. | Tigard | 7.1% | 14.6%(-7.43)#33 | 18.1%(-10.9)#2,471 |
| 34. | Rockcreek | 7.3% | 14.6%(-7.31)#34 | 18.1%(-10.8)#2,539 |
| 35. | Baker City | 7.4% | 14.6%(-7.14)#35 | 18.1%(-10.6)#2,610 |
| 36. | Willamina | 7.5% | 14.6%(-7.09)#36 | 18.1%(-10.6)#2,622 |
| 37. | Hillsboro | 7.7% | 14.6%(-6.90)#37 | 18.1%(-10.4)#2,694 |
| 38. | Roseburg North | 7.7% | 14.6%(-6.88)#38 | 18.1%(-10.4)#2,701 |
| 39. | Durham | 7.9% | 14.6%(-6.71)#39 | 18.1%(-10.2)#2,784 |
| 40. | Gladstone | 8.0% | 14.6%(-6.61)#40 | 18.1%(-10.1)#2,811 |
| 41. | Carlton | 8.0% | 14.6%(-6.60)#41 | 18.1%(-10.1)#2,817 |
| 42. | St Helens | 8.1% | 14.6%(-6.43)#42 | 18.1%(-9.92)#2,882 |
| 43. | Oregon City | 8.3% | 14.6%(-6.29)#43 | 18.1%(-9.78)#2,932 |
| 44. | Junction City | 8.5% | 14.6%(-6.11)#44 | 18.1%(-9.60)#3,023 |
| 45. | Westfir | 8.7% | 14.6%(-5.88)#45 | 18.1%(-9.37)#3,137 |
| 46. | Culver | 8.8% | 14.6%(-5.73)#46 | 18.1%(-9.22)#3,186 |
| 47. | Tri City | 8.9% | 14.6%(-5.68)#47 | 18.1%(-9.17)#3,203 |
| 48. | Keizer | 9.0% | 14.6%(-5.61)#48 | 18.1%(-9.10)#3,233 |
| 49. | Florence | 9.3% | 14.6%(-5.31)#49 | 18.1%(-8.80)#3,376 |
| 50. | Central Point | 9.3% | 14.6%(-5.24)#50 | 18.1%(-8.73)#3,405 |
| 51. | Stayton | 9.5% | 14.6%(-5.11)#51 | 18.1%(-8.60)#3,443 |
| 52. | Phoenix | 9.6% | 14.6%(-4.99)#52 | 18.1%(-8.48)#3,500 |
| 53. | Hood River | 9.6% | 14.6%(-4.98)#53 | 18.1%(-8.47)#3,502 |
| 54. | Johnson City | 10.0% | 14.6%(-4.57)#54 | 18.1%(-8.06)#3,659 |
| 55. | Odell | 10.6% | 14.6%(-3.97)#55 | 18.1%(-7.46)#3,909 |
| 56. | Merrill | 10.7% | 14.6%(-3.88)#56 | 18.1%(-7.37)#3,935 |
| 57. | Hubbard | 10.8% | 14.6%(-3.76)#57 | 18.1%(-7.25)#3,974 |
| 58. | Roseburg | 11.1% | 14.6%(-3.50)#58 | 18.1%(-6.99)#4,060 |
| 59. | Cannon Beach | 11.3% | 14.6%(-3.28)#59 | 18.1%(-6.77)#4,176 |
| 60. | Jennings Lodge | 11.3% | 14.6%(-3.26)#60 | 18.1%(-6.75)#4,187 |
| 61. | Troutdale | 11.8% | 14.6%(-2.79)#61 | 18.1%(-6.29)#4,382 |
| 62. | Camp Sherman | 11.9% | 14.6%(-2.71)#62 | 18.1%(-6.20)#4,406 |
| 63. | Happy Valley | 11.9% | 14.6%(-2.65)#63 | 18.1%(-6.14)#4,423 |
| 64. | Portland | 12.0% | 14.6%(-2.53)#64 | 18.1%(-6.02)#4,473 |
| 65. | Aumsville | 12.1% | 14.6%(-2.48)#65 | 18.1%(-5.97)#4,490 |
| 66. | Newberg | 12.2% | 14.6%(-2.35)#66 | 18.1%(-5.85)#4,526 |
| 67. | Glendale | 12.5% | 14.6%(-2.07)#67 | 18.1%(-5.56)#4,616 |
| 68. | Seneca | 12.5% | 14.6%(-2.07)#68 | 18.1%(-5.56)#4,665 |
| 69. | Clatskanie | 12.8% | 14.6%(-1.81)#69 | 18.1%(-5.30)#4,738 |
| 70. | Estacada | 12.8% | 14.6%(-1.77)#70 | 18.1%(-5.26)#4,759 |
| 71. | Aloha | 13.1% | 14.6%(-1.47)#71 | 18.1%(-4.96)#4,872 |
| 72. | Sisters | 13.3% | 14.6%(-1.24)#72 | 18.1%(-4.73)#4,941 |
| 73. | Tangent | 13.3% | 14.6%(-1.24)#73 | 18.1%(-4.73)#4,949 |
| 74. | Forest Grove | 13.4% | 14.6%(-1.14)#74 | 18.1%(-4.63)#4,993 |
| 75. | Wilsonville | 13.5% | 14.6%(-1.08)#75 | 18.1%(-4.57)#5,017 |
| 76. | Drain | 13.8% | 14.6%(-0.778)#76 | 18.1%(-4.27)#5,131 |
| 77. | The Dalles | 14.2% | 14.6%(-0.382)#77 | 18.1%(-3.87)#5,276 |
| 78. | Rivergrove | 14.3% | 14.6%(-0.286)#78 | 18.1%(-3.78)#5,332 |
| 79. | Bend | 14.5% | 14.6%(-0.071)#79 | 18.1%(-3.56)#5,415 |
| 80. | Madras | 14.7% | 14.6%(+0.103)#80 | 18.1%(-3.39)#5,475 |
| 81. | Lafayette | 14.9% | 14.6%(+0.344)#81 | 18.1%(-3.15)#5,553 |
| 82. | Winston | 15.3% | 14.6%(+0.744)#82 | 18.1%(-2.75)#5,683 |
| 83. | Terrebonne | 15.3% | 14.6%(+0.757)#83 | 18.1%(-2.73)#5,690 |
| 84. | Beaverton | 15.6% | 14.6%(+1.05)#84 | 18.1%(-2.44)#5,806 |
| 85. | Hermiston | 15.8% | 14.6%(+1.20)#85 | 18.1%(-2.29)#5,850 |
| 86. | Pendleton | 15.8% | 14.6%(+1.26)#86 | 18.1%(-2.24)#5,879 |
| 87. | Deschutes River Woods | 15.9% | 14.6%(+1.33)#87 | 18.1%(-2.16)#5,896 |
| 88. | Halsey | 16.4% | 14.6%(+1.87)#88 | 18.1%(-1.62)#6,072 |
| 89. | Milton Freewater | 16.7% | 14.6%(+2.14)#89 | 18.1%(-1.36)#6,212 |
| 90. | Coos Bay | 16.8% | 14.6%(+2.27)#90 | 18.1%(-1.23)#6,240 |
| 91. | Mount Hood | 17.4% | 14.6%(+2.84)#91 | 18.1%(-0.647)#6,418 |
| 92. | Albany | 17.5% | 14.6%(+2.92)#92 | 18.1%(-0.572)#6,443 |
| 93. | Newport | 17.6% | 14.6%(+3.06)#93 | 18.1%(-0.431)#6,475 |
| 94. | Medford | 17.6% | 14.6%(+3.08)#94 | 18.1%(-0.416)#6,476 |
| 95. | Independence | 18.0% | 14.6%(+3.39)#95 | 18.1%(-0.101)#6,605 |
| 96. | Four Corners | 18.2% | 14.6%(+3.62)#96 | 18.1%(+0.131)#6,698 |
| 97. | Eugene | 18.6% | 14.6%(+4.04)#97 | 18.1%(+0.551)#6,819 |
| 98. | Metzger | 18.7% | 14.6%(+4.11)#98 | 18.1%(+0.622)#6,842 |
| 99. | Burns | 18.8% | 14.6%(+4.18)#99 | 18.1%(+0.687)#6,860 |
| 100. | Redmond | 19.0% | 14.6%(+4.43)#100 | 18.1%(+0.938)#6,934 |
Common Questions
What are the Top 10 Cities with the Lowest Poverty Level Among Children Under the Age of 5 in Oregon?
Top 10 Cities with the Lowest Poverty Level Among Children Under the Age of 5 in Oregon are:
#1
0.69%
#2
1.2%
#3
1.5%
#4
1.7%
#5
1.7%
#6
1.8%
#7
1.9%
#8
2.0%
#9
2.7%
#10
2.8%
What city has the Lowest Poverty Level Among Children Under the Age of 5 in Oregon?
Bethany has the Lowest Poverty Level Among Children Under the Age of 5 in Oregon with 0.69%.
What is the Poverty Level Among Children Under the Age of 5 in the State of Oregon?
Poverty Level Among Children Under the Age of 5 in Oregon is 14.6%.
What is the Poverty Level Among Children Under the Age of 5 in the United States?
Poverty Level Among Children Under the Age of 5 in the United States is 18.1%.