Cities with the Lowest Poverty Level Among Children Under the Age of 5 in Arkansas
RELATED REPORTS & OPTIONS
Lowest Poverty | Child 0-5
Arkansas
Compare Cities
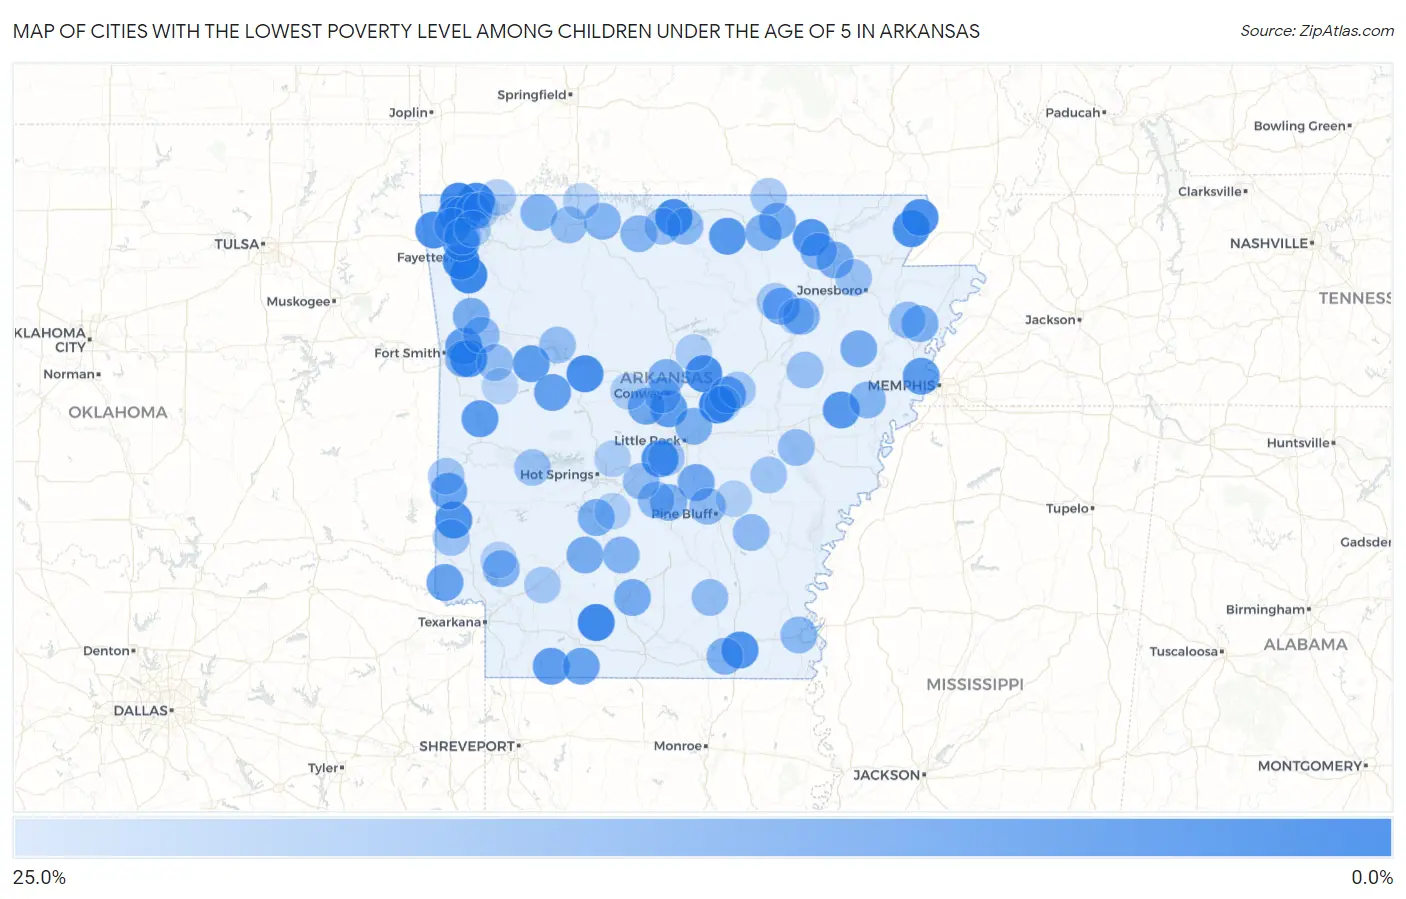
Map of Cities with the Lowest Poverty Level Among Children Under the Age of 5 in Arkansas
25.0%
0.0%
Cities with the Lowest Poverty Level Among Children Under the Age of 5 in Arkansas
| City | Child Poverty | vs State | vs National | |
| 1. | Austin | 1.2% | 26.7%(-25.5)#1 | 18.1%(-16.8)#141 |
| 2. | West Fork | 2.2% | 26.7%(-24.5)#2 | 18.1%(-15.9)#400 |
| 3. | Pea Ridge | 2.5% | 26.7%(-24.2)#3 | 18.1%(-15.5)#519 |
| 4. | Bella Vista | 2.6% | 26.7%(-24.1)#4 | 18.1%(-15.5)#543 |
| 5. | Stephens | 2.7% | 26.7%(-24.0)#5 | 18.1%(-15.4)#559 |
| 6. | Farmington | 3.0% | 26.7%(-23.7)#6 | 18.1%(-15.1)#698 |
| 7. | Mountain Home | 3.6% | 26.7%(-23.1)#7 | 18.1%(-14.4)#969 |
| 8. | Dardanelle | 3.8% | 26.7%(-22.9)#8 | 18.1%(-14.3)#1,043 |
| 9. | Rector | 3.8% | 26.7%(-22.8)#9 | 18.1%(-14.2)#1,054 |
| 10. | Gentry | 3.9% | 26.7%(-22.8)#10 | 18.1%(-14.2)#1,078 |
| 11. | Mount Vernon | 3.9% | 26.7%(-22.7)#11 | 18.1%(-14.1)#1,113 |
| 12. | Lavaca | 4.3% | 26.7%(-22.4)#12 | 18.1%(-13.7)#1,257 |
| 13. | Bryant | 4.5% | 26.7%(-22.2)#13 | 18.1%(-13.6)#1,335 |
| 14. | Greenway | 4.5% | 26.7%(-22.1)#14 | 18.1%(-13.5)#1,364 |
| 15. | Gillham | 4.8% | 26.7%(-21.9)#15 | 18.1%(-13.3)#1,468 |
| 16. | Hamburg | 5.2% | 26.7%(-21.5)#16 | 18.1%(-12.9)#1,649 |
| 17. | Imboden | 5.5% | 26.7%(-21.2)#17 | 18.1%(-12.6)#1,769 |
| 18. | Centerton | 5.5% | 26.7%(-21.2)#18 | 18.1%(-12.6)#1,791 |
| 19. | Palestine | 6.1% | 26.7%(-20.6)#19 | 18.1%(-12.0)#2,006 |
| 20. | Oxford | 6.2% | 26.7%(-20.5)#20 | 18.1%(-11.9)#2,053 |
| 21. | Tontitown | 6.5% | 26.7%(-20.2)#21 | 18.1%(-11.6)#2,188 |
| 22. | Mayflower | 6.9% | 26.7%(-19.8)#22 | 18.1%(-11.1)#2,393 |
| 23. | Waldron | 7.1% | 26.7%(-19.6)#23 | 18.1%(-11.0)#2,452 |
| 24. | Bentonville | 7.1% | 26.7%(-19.6)#24 | 18.1%(-11.0)#2,463 |
| 25. | Subiaco | 7.1% | 26.7%(-19.5)#25 | 18.1%(-10.9)#2,491 |
| 26. | Marion | 7.3% | 26.7%(-19.4)#26 | 18.1%(-10.8)#2,543 |
| 27. | Kibler | 7.3% | 26.7%(-19.4)#27 | 18.1%(-10.7)#2,555 |
| 28. | Taylor | 7.4% | 26.7%(-19.3)#28 | 18.1%(-10.7)#2,599 |
| 29. | Beebe | 7.5% | 26.7%(-19.2)#29 | 18.1%(-10.6)#2,641 |
| 30. | Belleville | 8.3% | 26.7%(-18.4)#30 | 18.1%(-9.73)#2,967 |
| 31. | Foreman | 8.7% | 26.7%(-18.0)#31 | 18.1%(-9.41)#3,109 |
| 32. | Emerson | 9.1% | 26.7%(-17.6)#32 | 18.1%(-8.97)#3,305 |
| 33. | Vandervoort | 9.1% | 26.7%(-17.6)#33 | 18.1%(-8.97)#3,315 |
| 34. | Little Flock | 9.2% | 26.7%(-17.5)#34 | 18.1%(-8.87)#3,351 |
| 35. | Bigelow | 9.8% | 26.7%(-16.9)#35 | 18.1%(-8.26)#3,580 |
| 36. | Newark | 10.0% | 26.7%(-16.7)#36 | 18.1%(-8.06)#3,635 |
| 37. | Redfield | 10.2% | 26.7%(-16.5)#37 | 18.1%(-7.89)#3,727 |
| 38. | Hardy | 10.9% | 26.7%(-15.8)#38 | 18.1%(-7.19)#3,998 |
| 39. | Gurdon | 10.9% | 26.7%(-15.8)#39 | 18.1%(-7.13)#4,017 |
| 40. | East Camden | 11.1% | 26.7%(-15.6)#40 | 18.1%(-6.95)#4,080 |
| 41. | Cherry Valley | 11.1% | 26.7%(-15.6)#41 | 18.1%(-6.95)#4,103 |
| 42. | Diaz | 11.4% | 26.7%(-15.3)#42 | 18.1%(-6.70)#4,208 |
| 43. | Highfill | 11.4% | 26.7%(-15.3)#43 | 18.1%(-6.67)#4,223 |
| 44. | Hoxie | 11.5% | 26.7%(-15.2)#44 | 18.1%(-6.60)#4,253 |
| 45. | Mountainburg | 11.5% | 26.7%(-15.2)#45 | 18.1%(-6.52)#4,281 |
| 46. | Caddo Valley | 11.6% | 26.7%(-15.1)#46 | 18.1%(-6.43)#4,313 |
| 47. | Dyess | 11.8% | 26.7%(-14.9)#47 | 18.1%(-6.30)#4,377 |
| 48. | Sherwood | 12.0% | 26.7%(-14.7)#48 | 18.1%(-6.09)#4,440 |
| 49. | North Crossett | 12.3% | 26.7%(-14.4)#49 | 18.1%(-5.78)#4,547 |
| 50. | Wooster | 12.3% | 26.7%(-14.4)#50 | 18.1%(-5.73)#4,561 |
| 51. | Ash Flat | 12.4% | 26.7%(-14.3)#51 | 18.1%(-5.65)#4,580 |
| 52. | Central City | 12.5% | 26.7%(-14.2)#52 | 18.1%(-5.56)#4,620 |
| 53. | Tollette | 12.5% | 26.7%(-14.2)#53 | 18.1%(-5.56)#4,666 |
| 54. | Sheridan | 12.8% | 26.7%(-13.9)#54 | 18.1%(-5.23)#4,771 |
| 55. | Black Rock | 13.0% | 26.7%(-13.6)#55 | 18.1%(-5.02)#4,848 |
| 56. | Bergman | 13.3% | 26.7%(-13.4)#56 | 18.1%(-4.73)#4,961 |
| 57. | Sparkman | 13.3% | 26.7%(-13.4)#57 | 18.1%(-4.73)#4,965 |
| 58. | Berryville | 13.4% | 26.7%(-13.3)#58 | 18.1%(-4.64)#4,986 |
| 59. | Widener | 13.5% | 26.7%(-13.2)#59 | 18.1%(-4.55)#5,028 |
| 60. | Yellville | 13.8% | 26.7%(-12.8)#60 | 18.1%(-4.22)#5,152 |
| 61. | Prattsville | 14.3% | 26.7%(-12.4)#61 | 18.1%(-3.78)#5,340 |
| 62. | Briarcliff | 14.3% | 26.7%(-12.4)#62 | 18.1%(-3.78)#5,359 |
| 63. | Lake Village | 14.4% | 26.7%(-12.3)#63 | 18.1%(-3.69)#5,381 |
| 64. | White Hall | 14.6% | 26.7%(-12.1)#64 | 18.1%(-3.46)#5,451 |
| 65. | Mulberry | 14.9% | 26.7%(-11.8)#65 | 18.1%(-3.20)#5,537 |
| 66. | Grady | 14.9% | 26.7%(-11.8)#66 | 18.1%(-3.17)#5,548 |
| 67. | Clarendon | 15.0% | 26.7%(-11.7)#67 | 18.1%(-3.06)#5,587 |
| 68. | Warren | 15.3% | 26.7%(-11.4)#68 | 18.1%(-2.81)#5,665 |
| 69. | Alpena | 15.4% | 26.7%(-11.3)#69 | 18.1%(-2.68)#5,741 |
| 70. | Traskwood | 15.4% | 26.7%(-11.3)#70 | 18.1%(-2.68)#5,745 |
| 71. | Branch | 15.4% | 26.7%(-11.3)#71 | 18.1%(-2.68)#5,746 |
| 72. | Lepanto | 15.8% | 26.7%(-10.9)#72 | 18.1%(-2.23)#5,881 |
| 73. | Elm Springs | 15.9% | 26.7%(-10.7)#73 | 18.1%(-2.12)#5,911 |
| 74. | Lamar | 16.1% | 26.7%(-10.6)#74 | 18.1%(-1.98)#5,965 |
| 75. | Alexander | 16.3% | 26.7%(-10.4)#75 | 18.1%(-1.80)#6,016 |
| 76. | Patterson | 16.3% | 26.7%(-10.4)#76 | 18.1%(-1.78)#6,022 |
| 77. | Bono | 16.5% | 26.7%(-10.2)#77 | 18.1%(-1.56)#6,094 |
| 78. | Gassville | 16.5% | 26.7%(-10.2)#78 | 18.1%(-1.55)#6,095 |
| 79. | De Queen | 16.5% | 26.7%(-10.2)#79 | 18.1%(-1.54)#6,102 |
| 80. | Mount Ida | 16.7% | 26.7%(-10.0)#80 | 18.1%(-1.40)#6,146 |
| 81. | Stuttgart | 17.0% | 26.7%(-9.69)#81 | 18.1%(-1.06)#6,289 |
| 82. | Conway | 17.1% | 26.7%(-9.58)#82 | 18.1%(-0.954)#6,313 |
| 83. | Hatfield | 17.3% | 26.7%(-9.38)#83 | 18.1%(-0.755)#6,374 |
| 84. | Mcrae | 17.6% | 26.7%(-9.04)#84 | 18.1%(-0.416)#6,492 |
| 85. | Mammoth Spring | 17.7% | 26.7%(-8.97)#85 | 18.1%(-0.341)#6,521 |
| 86. | Perrytown | 18.2% | 26.7%(-8.51)#86 | 18.1%(+0.119)#6,676 |
| 87. | Sulphur Rock | 18.6% | 26.7%(-8.09)#87 | 18.1%(+0.542)#6,814 |
| 88. | Avoca | 19.0% | 26.7%(-7.64)#88 | 18.1%(+0.985)#6,954 |
| 89. | Gateway | 19.0% | 26.7%(-7.64)#89 | 18.1%(+0.985)#6,965 |
| 90. | Quitman | 19.1% | 26.7%(-7.54)#90 | 18.1%(+1.09)#6,991 |
| 91. | Lowell | 19.2% | 26.7%(-7.53)#91 | 18.1%(+1.10)#6,993 |
| 92. | Fountain Lake | 19.2% | 26.7%(-7.46)#92 | 18.1%(+1.17)#7,010 |
| 93. | Oppelo | 19.4% | 26.7%(-7.25)#93 | 18.1%(+1.38)#7,081 |
| 94. | Altheimer | 20.0% | 26.7%(-6.69)#94 | 18.1%(+1.94)#7,255 |
| 95. | Donaldson | 20.0% | 26.7%(-6.69)#95 | 18.1%(+1.94)#7,274 |
| 96. | Omaha | 20.0% | 26.7%(-6.69)#96 | 18.1%(+1.94)#7,309 |
| 97. | Jacksonport | 20.0% | 26.7%(-6.69)#97 | 18.1%(+1.94)#7,310 |
| 98. | Mineral Springs | 20.2% | 26.7%(-6.50)#98 | 18.1%(+2.13)#7,340 |
| 99. | Ward | 20.7% | 26.7%(-6.00)#99 | 18.1%(+2.63)#7,476 |
| 100. | Booneville | 20.9% | 26.7%(-5.74)#100 | 18.1%(+2.88)#7,545 |
Common Questions
What are the Top 10 Cities with the Lowest Poverty Level Among Children Under the Age of 5 in Arkansas?
Top 10 Cities with the Lowest Poverty Level Among Children Under the Age of 5 in Arkansas are:
#1
1.2%
#2
2.2%
#3
2.5%
#4
2.6%
#5
2.7%
#6
3.0%
#7
3.6%
#8
3.8%
#9
3.8%
#10
3.9%
What city has the Lowest Poverty Level Among Children Under the Age of 5 in Arkansas?
Austin has the Lowest Poverty Level Among Children Under the Age of 5 in Arkansas with 1.2%.
What is the Poverty Level Among Children Under the Age of 5 in the State of Arkansas?
Poverty Level Among Children Under the Age of 5 in Arkansas is 26.7%.
What is the Poverty Level Among Children Under the Age of 5 in the United States?
Poverty Level Among Children Under the Age of 5 in the United States is 18.1%.