North Lakeville, MA
North Lakeville Map
North Lakeville Overview
3,635
TOTAL POPULATION
1,718
MALE POPULATION
1,917
FEMALE POPULATION
89.62
MALES / 100 FEMALES
111.58
FEMALES / 100 MALES
36.3
MEDIAN AGE
3.0
AVG FAMILY SIZE
2.7
AVG HOUSEHOLD SIZE
$40,036
PER CAPITA INCOME
$97,545
AVG FAMILY INCOME
$85,123
AVG HOUSEHOLD INCOME
34.7%
WAGE / INCOME GAP [ % ]
65.3¢/ $1
WAGE / INCOME GAP [ $ ]
0.42
INEQUALITY / GINI INDEX
1,949
LABOR FORCE [ PEOPLE ]
68.1%
PERCENT IN LABOR FORCE
3.2%
UNEMPLOYMENT RATE
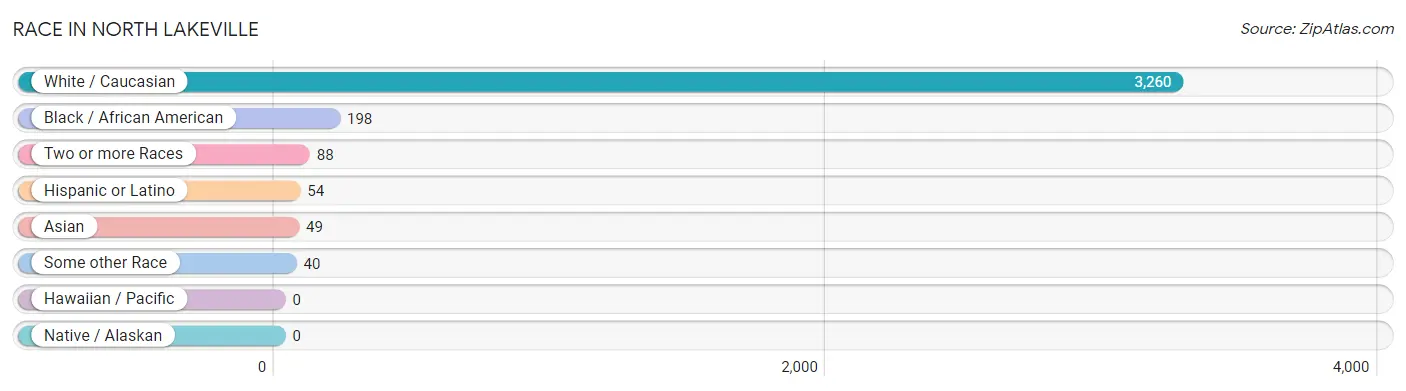
Race in North Lakeville
The most populous races in North Lakeville are White / Caucasian (3,260 | 89.7%), Black / African American (198 | 5.4%), and Two or more Races (88 | 2.4%).
| Race | # Population | % Population |
| Asian | 49 | 1.3% |
| Black / African American | 198 | 5.4% |
| Hawaiian / Pacific | 0 | 0.0% |
| Hispanic or Latino | 54 | 1.5% |
| Native / Alaskan | 0 | 0.0% |
| White / Caucasian | 3,260 | 89.7% |
| Two or more Races | 88 | 2.4% |
| Some other Race | 40 | 1.1% |
| Total | 3,635 | 100.0% |
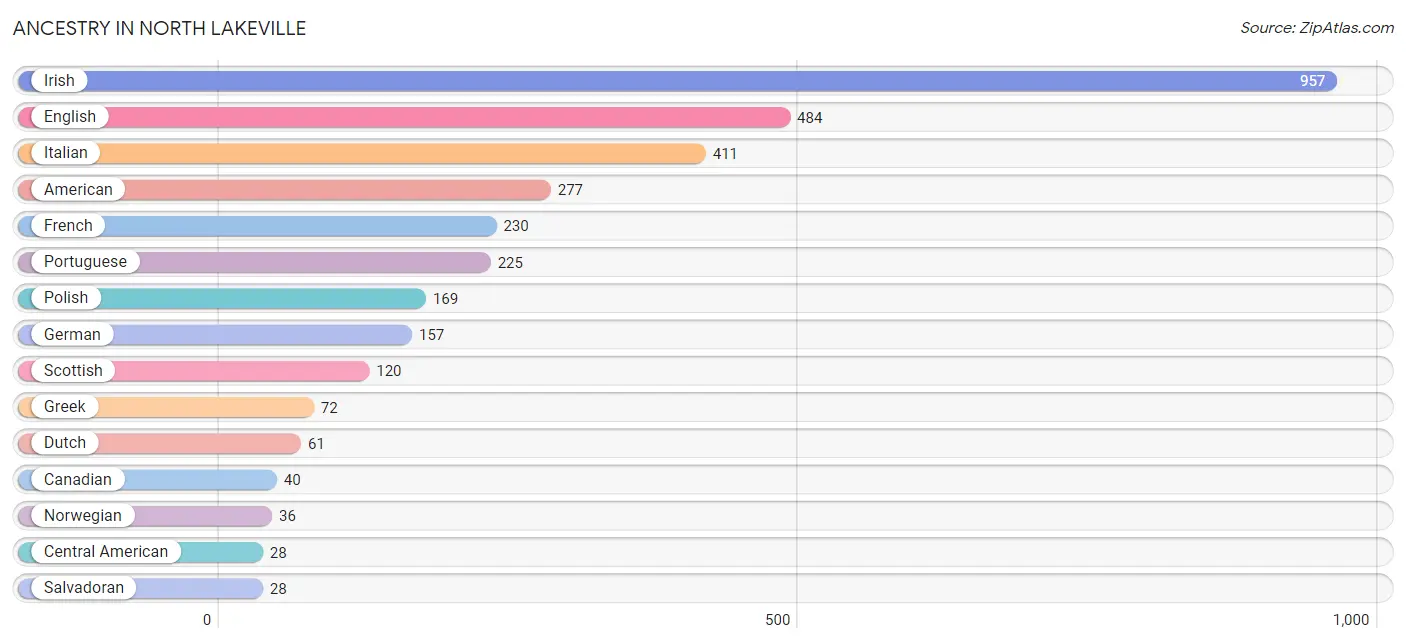
Ancestry in North Lakeville
The most populous ancestries reported in North Lakeville are Irish (957 | 26.3%), English (484 | 13.3%), Italian (411 | 11.3%), American (277 | 7.6%), and French (230 | 6.3%), together accounting for 64.9% of all North Lakeville residents.
| Ancestry | # Population | % Population |
| American | 277 | 7.6% |
| Bhutanese | 16 | 0.4% |
| British | 16 | 0.4% |
| Canadian | 40 | 1.1% |
| Cape Verdean | 25 | 0.7% |
| Central American | 28 | 0.8% |
| Cuban | 13 | 0.4% |
| Danish | 22 | 0.6% |
| Dutch | 61 | 1.7% |
| English | 484 | 13.3% |
| European | 26 | 0.7% |
| Finnish | 21 | 0.6% |
| French | 230 | 6.3% |
| French Canadian | 6 | 0.2% |
| German | 157 | 4.3% |
| Greek | 72 | 2.0% |
| Haitian | 27 | 0.7% |
| Hungarian | 15 | 0.4% |
| Irish | 957 | 26.3% |
| Italian | 411 | 11.3% |
| Latvian | 9 | 0.3% |
| Lithuanian | 6 | 0.2% |
| Mexican | 13 | 0.4% |
| Norwegian | 36 | 1.0% |
| Polish | 169 | 4.6% |
| Portuguese | 225 | 6.2% |
| Salvadoran | 28 | 0.8% |
| Scotch-Irish | 18 | 0.5% |
| Scottish | 120 | 3.3% |
| Slovak | 11 | 0.3% |
| Subsaharan African | 25 | 0.7% |
| Thai | 18 | 0.5% | View All 32 Rows |
Immigrants in North Lakeville
The most numerous immigrant groups reported in North Lakeville came from Europe (59 | 1.6%), Italy (52 | 1.4%), Southern Europe (52 | 1.4%), Canada (18 | 0.5%), and Latin America (15 | 0.4%), together accounting for 5.4% of all North Lakeville residents.

| Immigration Origin | # Population | % Population |
| Africa | 12 | 0.3% |
| Cabo Verde | 12 | 0.3% |
| Canada | 18 | 0.5% |
| Caribbean | 7 | 0.2% |
| Central America | 8 | 0.2% |
| Eastern Europe | 7 | 0.2% |
| El Salvador | 8 | 0.2% |
| Europe | 59 | 1.6% |
| Haiti | 7 | 0.2% |
| Hungary | 7 | 0.2% |
| Italy | 52 | 1.4% |
| Latin America | 15 | 0.4% |
| Southern Europe | 52 | 1.4% |
| Western Africa | 12 | 0.3% | View All 14 Rows |
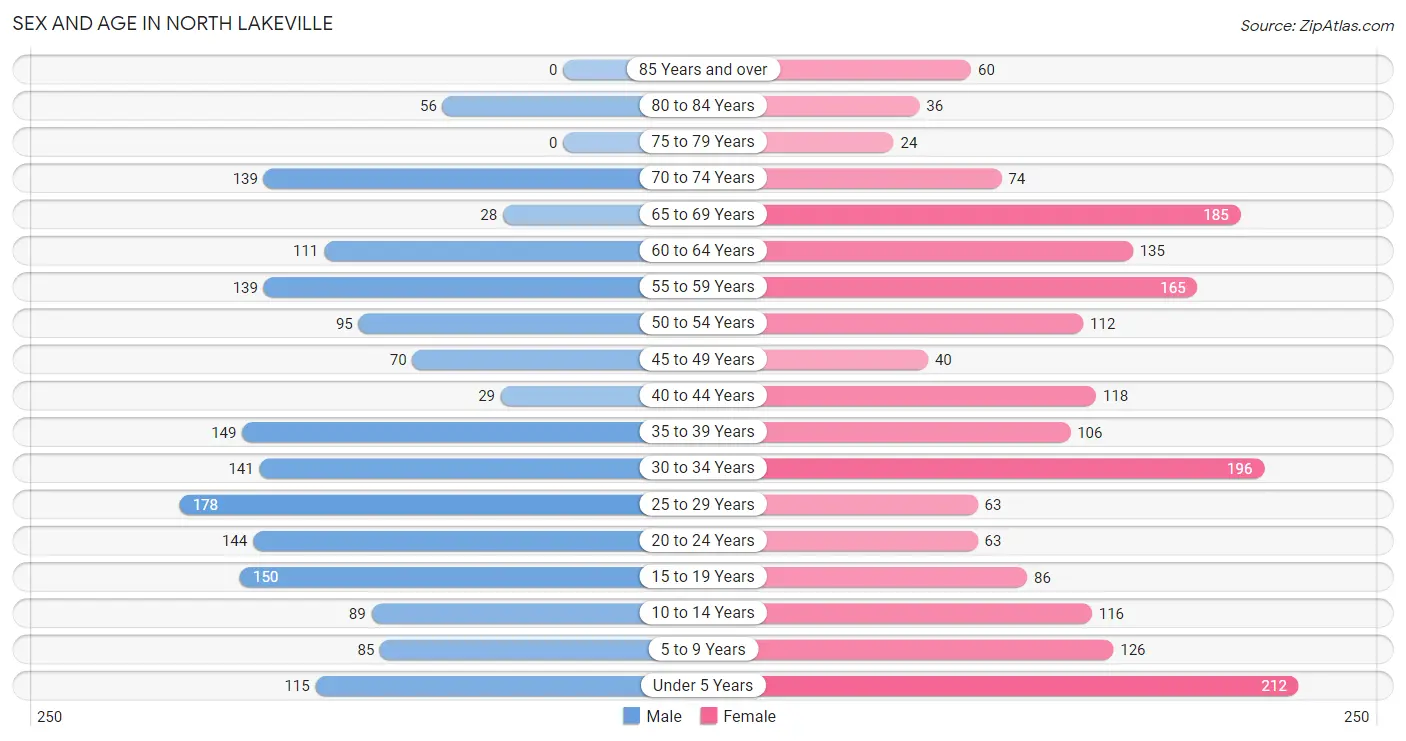
Sex and Age in North Lakeville
Sex and Age in North Lakeville
The most populous age groups in North Lakeville are 25 to 29 Years (178 | 10.4%) for men and Under 5 Years (212 | 11.1%) for women.
| Age Bracket | Male | Female |
| Under 5 Years | 115 (6.7%) | 212 (11.1%) |
| 5 to 9 Years | 85 (5.0%) | 126 (6.6%) |
| 10 to 14 Years | 89 (5.2%) | 116 (6.0%) |
| 15 to 19 Years | 150 (8.7%) | 86 (4.5%) |
| 20 to 24 Years | 144 (8.4%) | 63 (3.3%) |
| 25 to 29 Years | 178 (10.4%) | 63 (3.3%) |
| 30 to 34 Years | 141 (8.2%) | 196 (10.2%) |
| 35 to 39 Years | 149 (8.7%) | 106 (5.5%) |
| 40 to 44 Years | 29 (1.7%) | 118 (6.2%) |
| 45 to 49 Years | 70 (4.1%) | 40 (2.1%) |
| 50 to 54 Years | 95 (5.5%) | 112 (5.8%) |
| 55 to 59 Years | 139 (8.1%) | 165 (8.6%) |
| 60 to 64 Years | 111 (6.5%) | 135 (7.0%) |
| 65 to 69 Years | 28 (1.6%) | 185 (9.7%) |
| 70 to 74 Years | 139 (8.1%) | 74 (3.9%) |
| 75 to 79 Years | 0 (0.0%) | 24 (1.3%) |
| 80 to 84 Years | 56 (3.3%) | 36 (1.9%) |
| 85 Years and over | 0 (0.0%) | 60 (3.1%) |
| Total | 1,718 (100.0%) | 1,917 (100.0%) |
Families and Households in North Lakeville
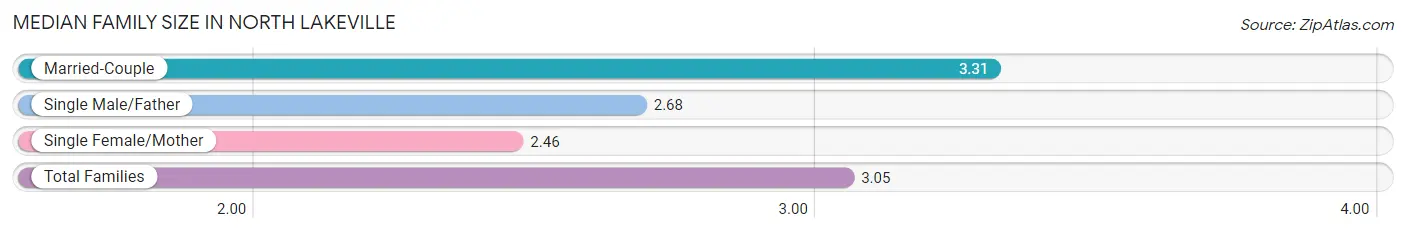
Median Family Size in North Lakeville
The median family size in North Lakeville is 3.05 persons per family, with married-couple families (635 | 67.2%) accounting for the largest median family size of 3.31 persons per family. On the other hand, single female/mother families (211 | 22.3%) represent the smallest median family size with 2.46 persons per family.
| Family Type | # Families | Family Size |
| Married-Couple | 635 (67.2%) | 3.31 |
| Single Male/Father | 99 (10.5%) | 2.68 |
| Single Female/Mother | 211 (22.3%) | 2.46 |
| Total Families | 945 (100.0%) | 3.05 |
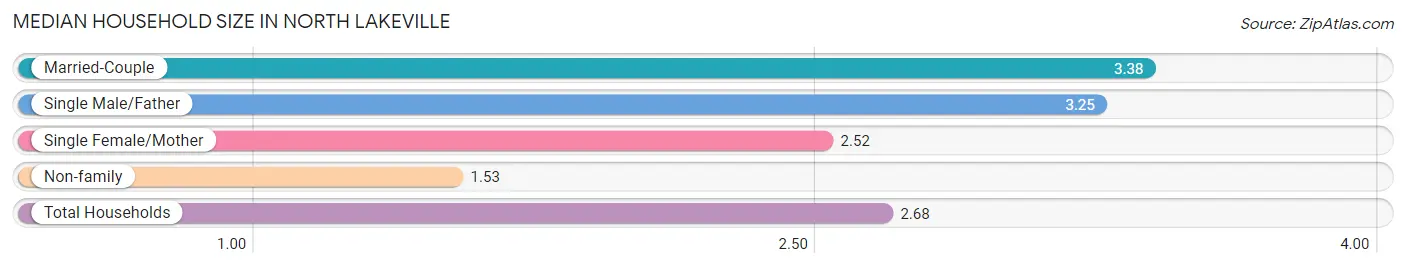
Median Household Size in North Lakeville
The median household size in North Lakeville is 2.68 persons per household, with married-couple households (635 | 46.8%) accounting for the largest median household size of 3.38 persons per household. non-family households (412 | 30.4%) represent the smallest median household size with 1.53 persons per household.
| Household Type | # Households | Household Size |
| Married-Couple | 635 (46.8%) | 3.38 |
| Single Male/Father | 99 (7.3%) | 3.25 |
| Single Female/Mother | 211 (15.5%) | 2.52 |
| Non-family | 412 (30.4%) | 1.53 |
| Total Households | 1,357 (100.0%) | 2.68 |
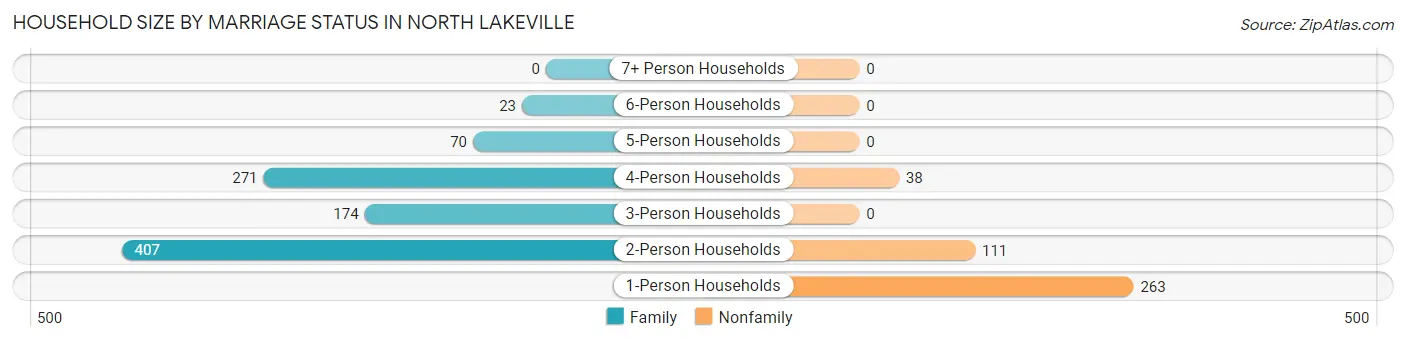
Household Size by Marriage Status in North Lakeville
Out of a total of 1,357 households in North Lakeville, 945 (69.6%) are family households, while 412 (30.4%) are nonfamily households. The most numerous type of family households are 2-person households, comprising 407, and the most common type of nonfamily households are 1-person households, comprising 263.
| Household Size | Family Households | Nonfamily Households |
| 1-Person Households | - | 263 (19.4%) |
| 2-Person Households | 407 (30.0%) | 111 (8.2%) |
| 3-Person Households | 174 (12.8%) | 0 (0.0%) |
| 4-Person Households | 271 (20.0%) | 38 (2.8%) |
| 5-Person Households | 70 (5.2%) | 0 (0.0%) |
| 6-Person Households | 23 (1.7%) | 0 (0.0%) |
| 7+ Person Households | 0 (0.0%) | 0 (0.0%) |
| Total | 945 (69.6%) | 412 (30.4%) |
Female Fertility in North Lakeville
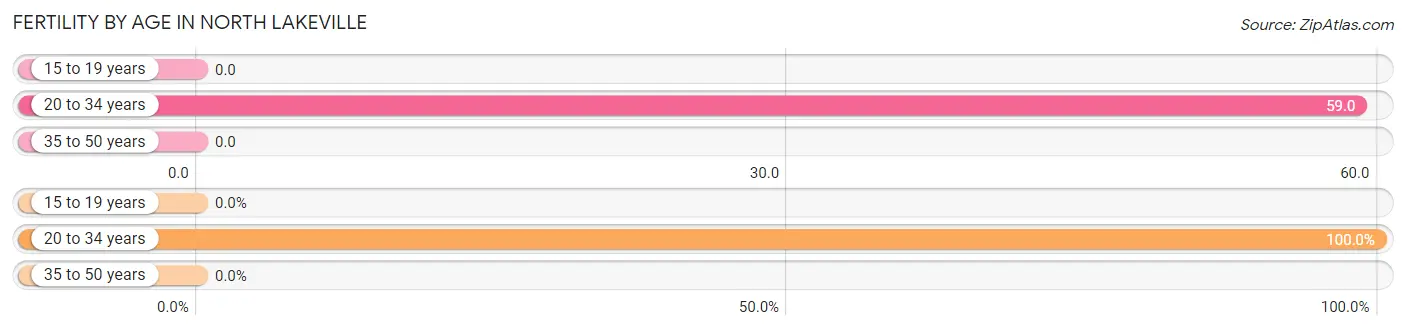
Fertility by Age in North Lakeville
Average fertility rate in North Lakeville is 28.0 births per 1,000 women. Women in the age bracket of 20 to 34 years have the highest fertility rate with 59.0 births per 1,000 women. Women in the age bracket of 20 to 34 years acount for 100.0% of all women with births.
| Age Bracket | Women with Births | Births / 1,000 Women |
| 15 to 19 years | 0 (0.0%) | 0.0 |
| 20 to 34 years | 19 (100.0%) | 59.0 |
| 35 to 50 years | 0 (0.0%) | 0.0 |
| Total | 19 (100.0%) | 28.0 |
Fertility by Age by Marriage Status in North Lakeville
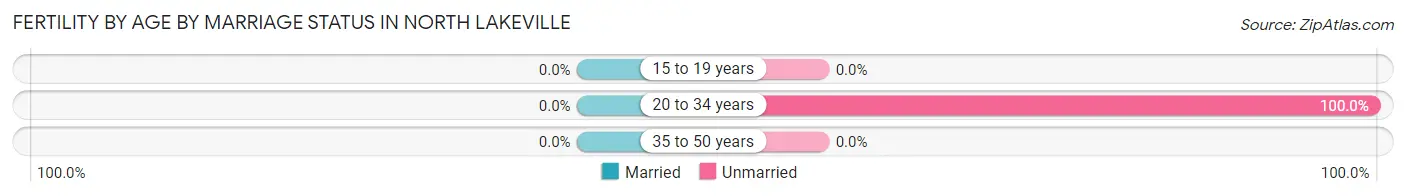
| Age Bracket | Married | Unmarried |
| 15 to 19 years | 0 (0.0%) | 0 (0.0%) |
| 20 to 34 years | 0 (0.0%) | 19 (100.0%) |
| 35 to 50 years | 0 (0.0%) | 0 (0.0%) |
| Total | 0 (0.0%) | 19 (100.0%) |
Fertility by Education in North Lakeville
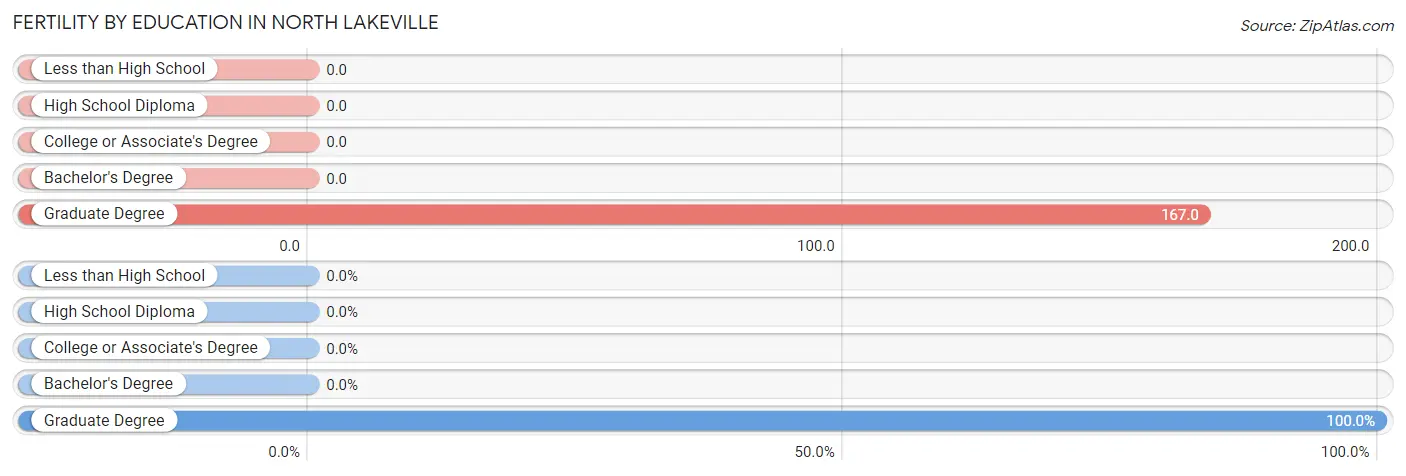
| Educational Attainment | Women with Births | Births / 1,000 Women |
| Less than High School | 0 (0.0%) | 0.0 |
| High School Diploma | 0 (0.0%) | 0.0 |
| College or Associate's Degree | 0 (0.0%) | 0.0 |
| Bachelor's Degree | 0 (0.0%) | 0.0 |
| Graduate Degree | 19 (100.0%) | 167.0 |
| Total | 19 (100.0%) | 28.0 |
Fertility by Education by Marriage Status in North Lakeville
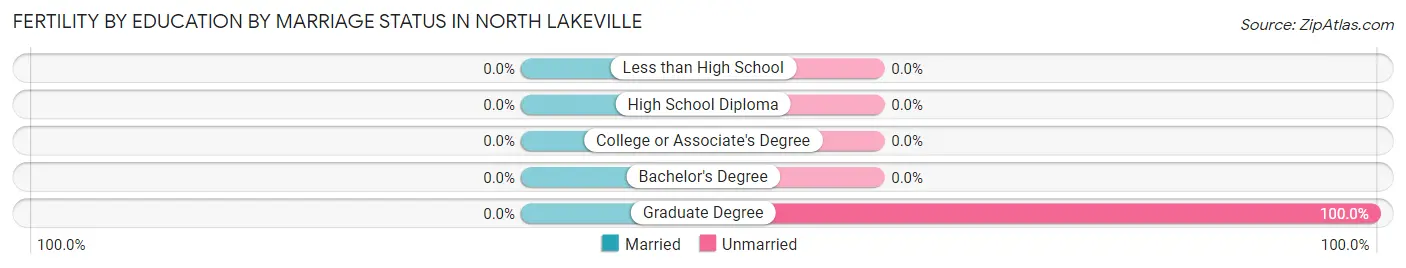
| Educational Attainment | Married | Unmarried |
| Less than High School | 0 (0.0%) | 0 (0.0%) |
| High School Diploma | 0 (0.0%) | 0 (0.0%) |
| College or Associate's Degree | 0 (0.0%) | 0 (0.0%) |
| Bachelor's Degree | 0 (0.0%) | 0 (0.0%) |
| Graduate Degree | 0 (0.0%) | 19 (100.0%) |
| Total | 0 (0.0%) | 19 (100.0%) |
Income in North Lakeville
Income Overview in North Lakeville
Per Capita Income in North Lakeville is $40,036, while median incomes of families and households are $97,545 and $85,123 respectively.
| Characteristic | Number | Measure |
| Per Capita Income | 3,635 | $40,036 |
| Median Family Income | 945 | $97,545 |
| Mean Family Income | 945 | $116,120 |
| Median Household Income | 1,357 | $85,123 |
| Mean Household Income | 1,357 | $105,212 |
| Income Deficit | 945 | $0 |
| Wage / Income Gap (%) | 3,635 | 34.67% |
| Wage / Income Gap ($) | 3,635 | 65.33¢ per $1 |
| Gini / Inequality Index | 3,635 | 0.42 |
Earnings by Sex in North Lakeville
Average Earnings in North Lakeville are $51,623, $58,087 for men and $37,946 for women, a difference of 34.7%.
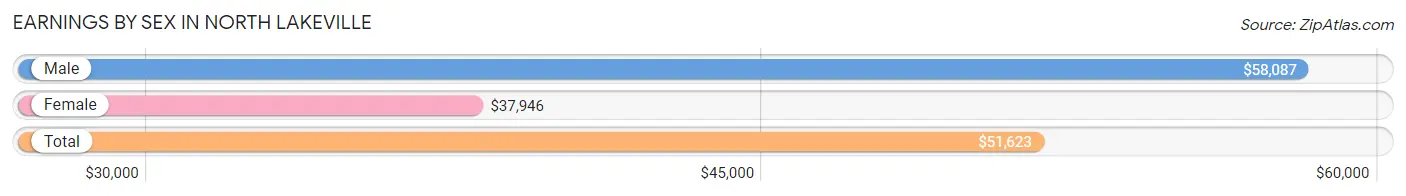
| Sex | Number | Average Earnings |
| Male | 989 (47.2%) | $58,087 |
| Female | 1,104 (52.7%) | $37,946 |
| Total | 2,093 (100.0%) | $51,623 |
Earnings by Sex by Income Bracket in North Lakeville
The most common earnings brackets in North Lakeville are $75,000 to $99,999 for men (206 | 20.8%) and $75,000 to $99,999 for women (138 | 12.5%).
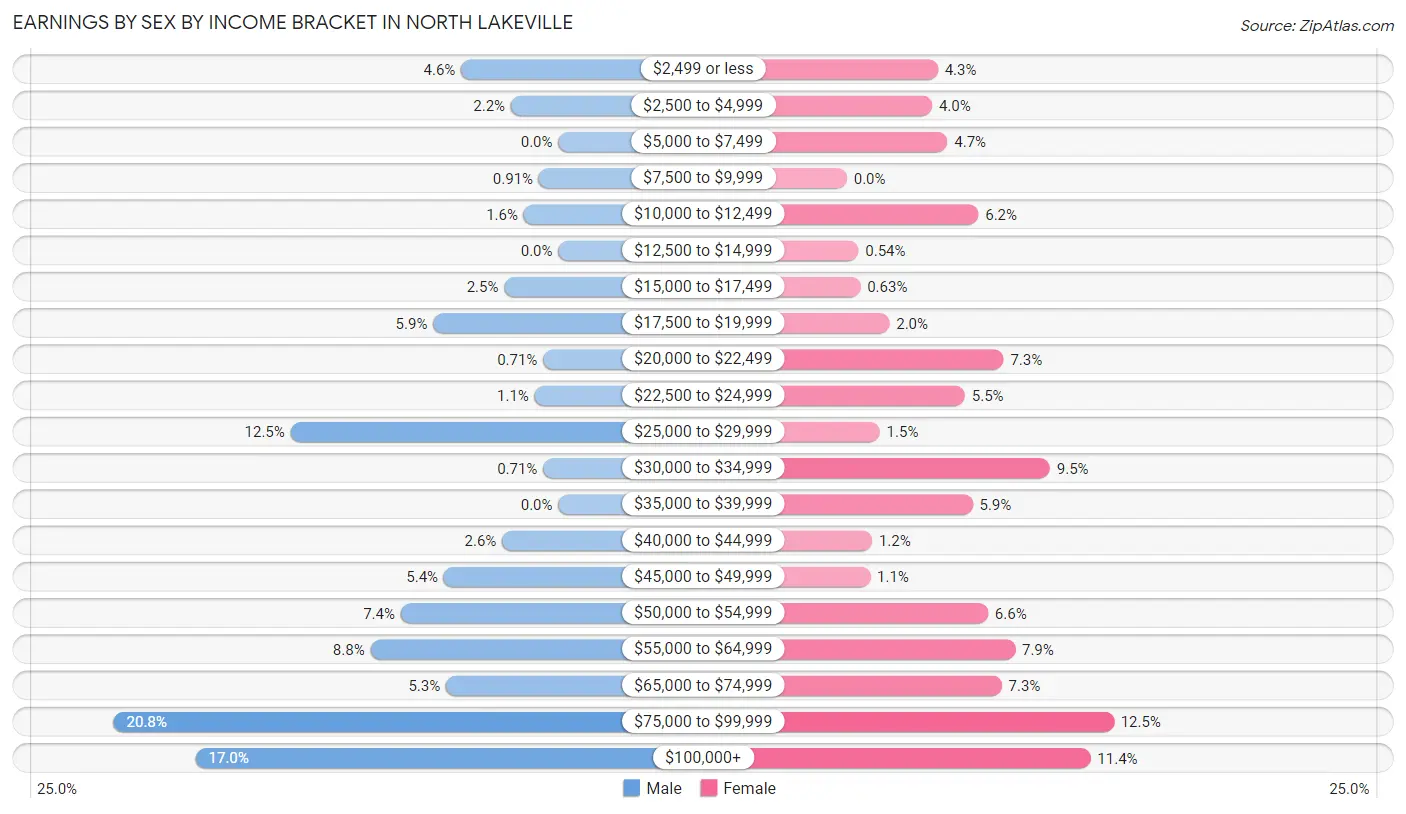
| Income | Male | Female |
| $2,499 or less | 45 (4.5%) | 47 (4.3%) |
| $2,500 to $4,999 | 22 (2.2%) | 44 (4.0%) |
| $5,000 to $7,499 | 0 (0.0%) | 52 (4.7%) |
| $7,500 to $9,999 | 9 (0.9%) | 0 (0.0%) |
| $10,000 to $12,499 | 16 (1.6%) | 68 (6.2%) |
| $12,500 to $14,999 | 0 (0.0%) | 6 (0.5%) |
| $15,000 to $17,499 | 25 (2.5%) | 7 (0.6%) |
| $17,500 to $19,999 | 58 (5.9%) | 22 (2.0%) |
| $20,000 to $22,499 | 7 (0.7%) | 81 (7.3%) |
| $22,500 to $24,999 | 11 (1.1%) | 61 (5.5%) |
| $25,000 to $29,999 | 124 (12.5%) | 17 (1.5%) |
| $30,000 to $34,999 | 7 (0.7%) | 105 (9.5%) |
| $35,000 to $39,999 | 0 (0.0%) | 65 (5.9%) |
| $40,000 to $44,999 | 26 (2.6%) | 13 (1.2%) |
| $45,000 to $49,999 | 53 (5.4%) | 12 (1.1%) |
| $50,000 to $54,999 | 73 (7.4%) | 73 (6.6%) |
| $55,000 to $64,999 | 87 (8.8%) | 87 (7.9%) |
| $65,000 to $74,999 | 52 (5.3%) | 80 (7.2%) |
| $75,000 to $99,999 | 206 (20.8%) | 138 (12.5%) |
| $100,000+ | 168 (17.0%) | 126 (11.4%) |
| Total | 989 (100.0%) | 1,104 (100.0%) |
Earnings by Sex by Educational Attainment in North Lakeville
Average earnings in North Lakeville are $68,534 for men and $52,662 for women, a difference of 23.2%. Men with an educational attainment of graduate degree enjoy the highest average annual earnings of $115,156, while those with high school diploma education earn the least with $53,300. Women with an educational attainment of graduate degree earn the most with the average annual earnings of $81,815, while those with college or associate's degree education have the smallest earnings of $31,944.
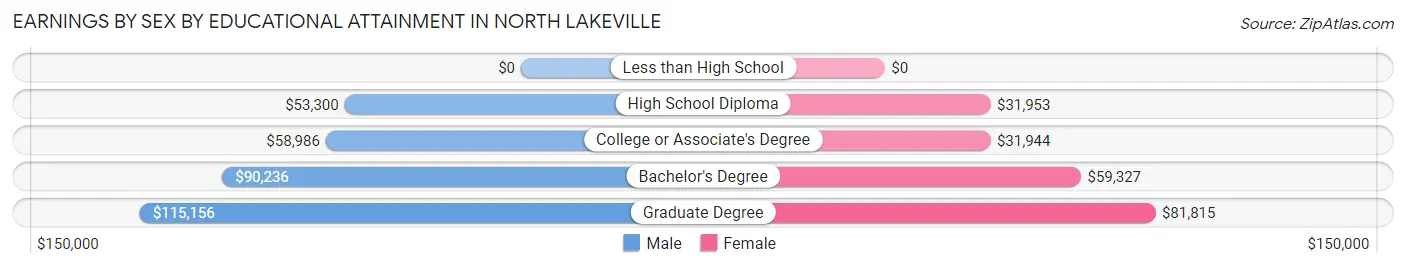
| Educational Attainment | Male Income | Female Income |
| Less than High School | - | - |
| High School Diploma | $53,300 | $31,953 |
| College or Associate's Degree | $58,986 | $31,944 |
| Bachelor's Degree | $90,236 | $59,327 |
| Graduate Degree | $115,156 | $81,815 |
| Total | $68,534 | $52,662 |
Family Income in North Lakeville
Family Income Brackets in North Lakeville
According to the North Lakeville family income data, there are 190 families falling into the $100,000 to $149,999 income range, which is the most common income bracket and makes up 20.1% of all families.
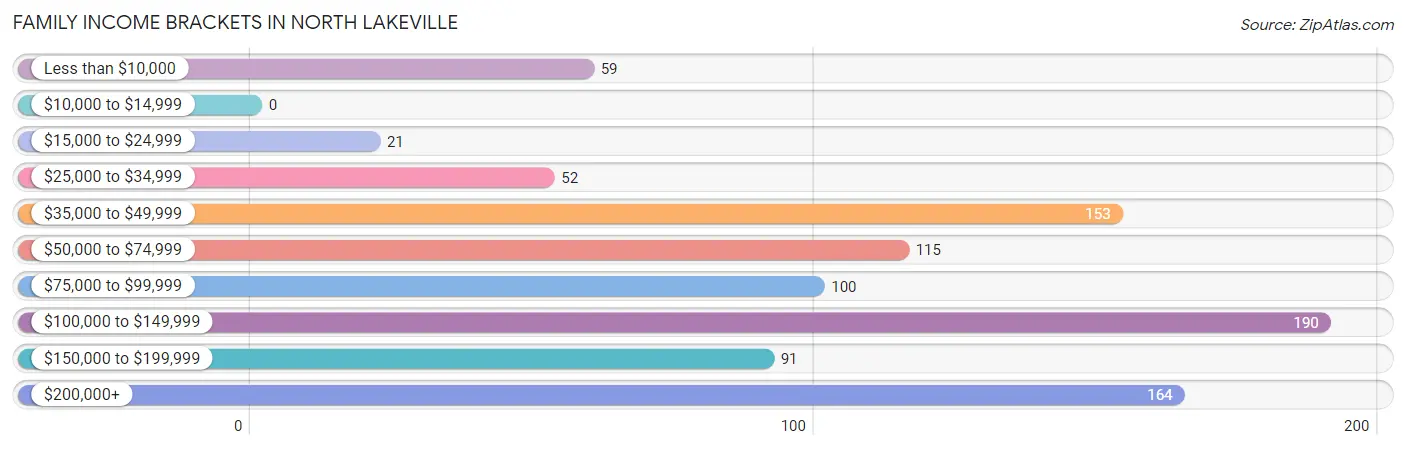
| Income Bracket | # Families | % Families |
| Less than $10,000 | 59 | 6.2% |
| $10,000 to $14,999 | 0 | 0.0% |
| $15,000 to $24,999 | 21 | 2.2% |
| $25,000 to $34,999 | 52 | 5.5% |
| $35,000 to $49,999 | 153 | 16.2% |
| $50,000 to $74,999 | 115 | 12.2% |
| $75,000 to $99,999 | 100 | 10.6% |
| $100,000 to $149,999 | 190 | 20.1% |
| $150,000 to $199,999 | 91 | 9.6% |
| $200,000+ | 164 | 17.4% |
Family Income by Famaliy Size in North Lakeville
5-person families (86 | 9.1%) account for the highest median family income in North Lakeville with $144,024 per family, while 5-person families (86 | 9.1%) have the highest median income of $28,805 per family member.
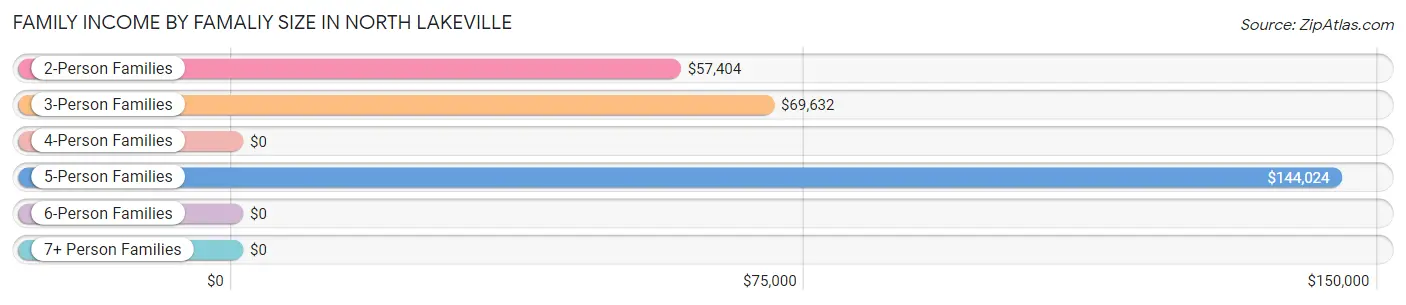
| Income Bracket | # Families | Median Income |
| 2-Person Families | 441 (46.7%) | $57,404 |
| 3-Person Families | 211 (22.3%) | $69,632 |
| 4-Person Families | 200 (21.2%) | $0 |
| 5-Person Families | 86 (9.1%) | $144,024 |
| 6-Person Families | 7 (0.7%) | $0 |
| 7+ Person Families | 0 (0.0%) | $0 |
| Total | 945 (100.0%) | $97,545 |
Family Income by Number of Earners in North Lakeville
The median family income in North Lakeville is $97,545, with families comprising 3+ earners (107) having the highest median family income of $250,001, while families with no earners (103) have the lowest median family income of $40,096, accounting for 11.3% and 10.9% of families, respectively.
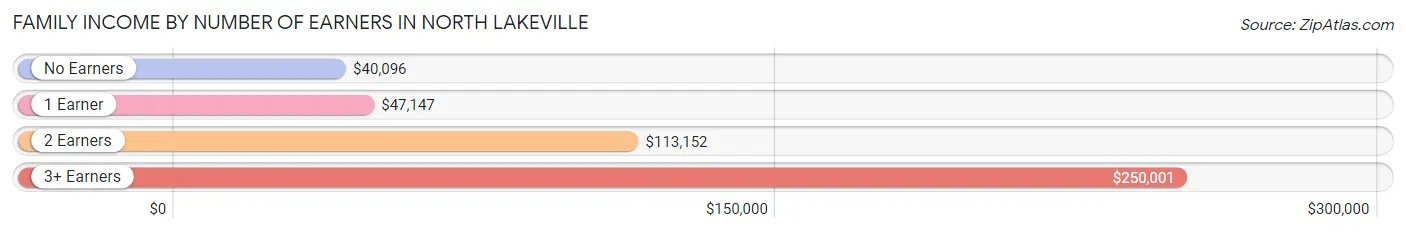
| Number of Earners | # Families | Median Income |
| No Earners | 103 (10.9%) | $40,096 |
| 1 Earner | 269 (28.5%) | $47,147 |
| 2 Earners | 466 (49.3%) | $113,152 |
| 3+ Earners | 107 (11.3%) | $250,001 |
| Total | 945 (100.0%) | $97,545 |
Household Income in North Lakeville
Household Income Brackets in North Lakeville
With 227 households falling in the category, the $100,000 to $149,999 income range is the most frequent in North Lakeville, accounting for 16.7% of all households. In contrast, only 52 households (3.8%) fall into the $25,000 to $34,999 income bracket, making it the least populous group.
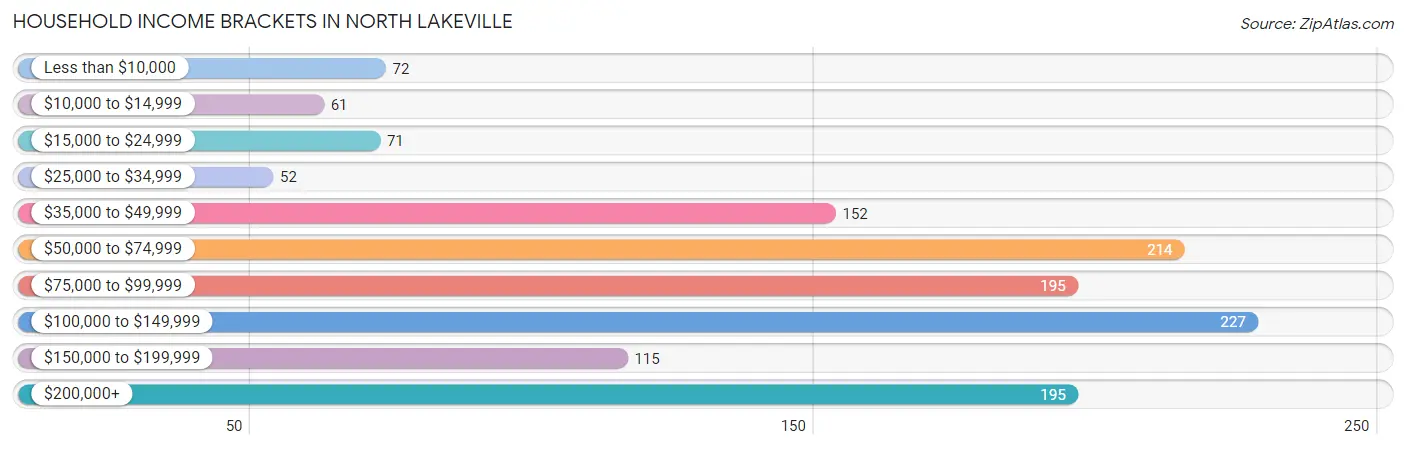
| Income Bracket | # Households | % Households |
| Less than $10,000 | 72 | 5.3% |
| $10,000 to $14,999 | 61 | 4.5% |
| $15,000 to $24,999 | 71 | 5.2% |
| $25,000 to $34,999 | 52 | 3.8% |
| $35,000 to $49,999 | 152 | 11.2% |
| $50,000 to $74,999 | 214 | 15.8% |
| $75,000 to $99,999 | 195 | 14.4% |
| $100,000 to $149,999 | 227 | 16.7% |
| $150,000 to $199,999 | 115 | 8.5% |
| $200,000+ | 195 | 14.4% |
Household Income by Householder Age in North Lakeville
The median household income in North Lakeville is $85,123, with the highest median household income of $105,833 found in the 45 to 64 years age bracket for the primary householder. A total of 502 households (37.0%) fall into this category. Meanwhile, the 15 to 24 years age bracket for the primary householder has the lowest median household income of $0, with 28 households (2.1%) in this group.
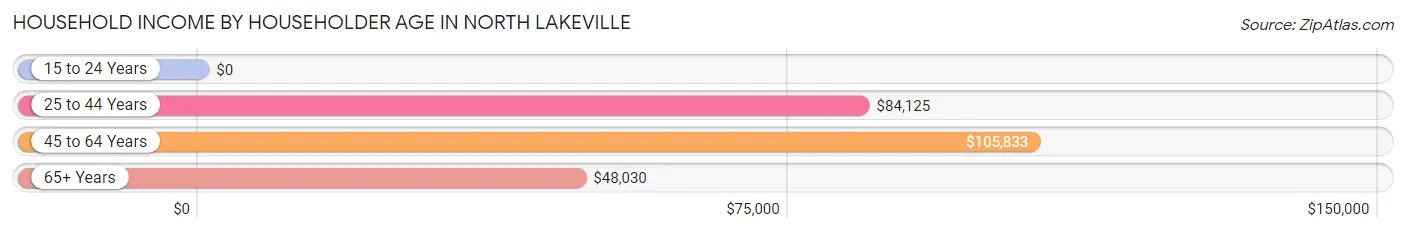
| Income Bracket | # Households | Median Income |
| 15 to 24 Years | 28 (2.1%) | $0 |
| 25 to 44 Years | 437 (32.2%) | $84,125 |
| 45 to 64 Years | 502 (37.0%) | $105,833 |
| 65+ Years | 390 (28.7%) | $48,030 |
| Total | 1,357 (100.0%) | $85,123 |
Poverty in North Lakeville
Income Below Poverty by Sex and Age in North Lakeville
With 9.2% poverty level for males and 9.1% for females among the residents of North Lakeville, 75 year old and over males and 65 to 74 year old females are the most vulnerable to poverty, with 12 males (21.4%) and 64 females (24.7%) in their respective age groups living below the poverty level.
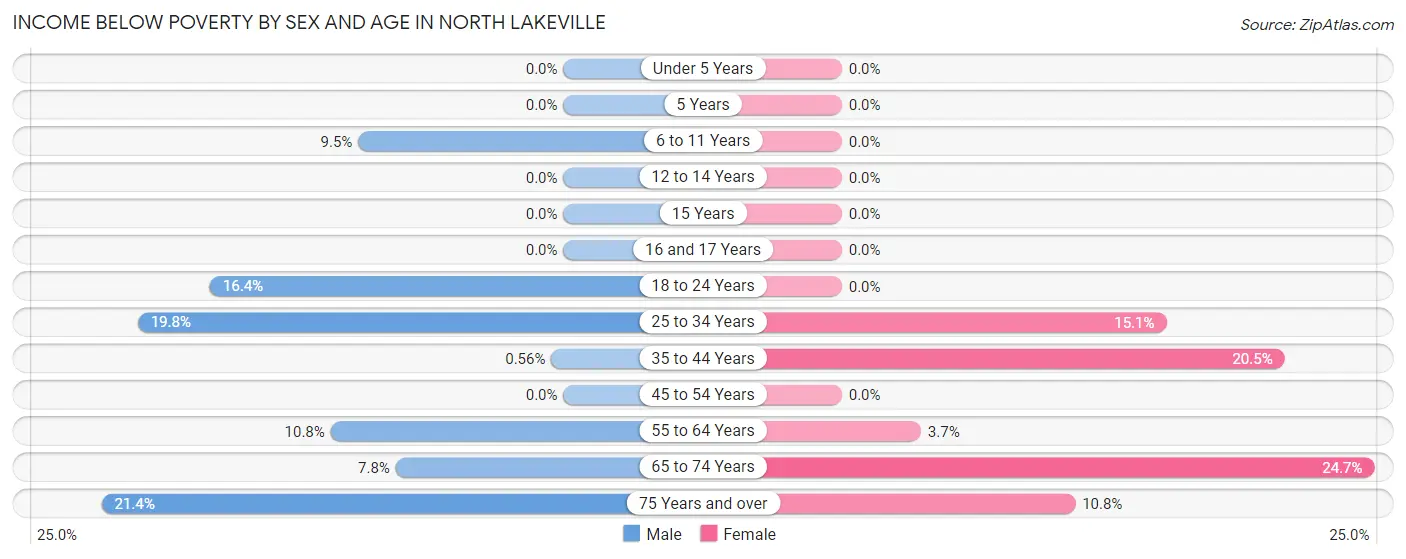
| Age Bracket | Male | Female |
| Under 5 Years | 0 (0.0%) | 0 (0.0%) |
| 5 Years | 0 (0.0%) | 0 (0.0%) |
| 6 to 11 Years | 8 (9.5%) | 0 (0.0%) |
| 12 to 14 Years | 0 (0.0%) | 0 (0.0%) |
| 15 Years | 0 (0.0%) | 0 (0.0%) |
| 16 and 17 Years | 0 (0.0%) | 0 (0.0%) |
| 18 to 24 Years | 31 (16.4%) | 0 (0.0%) |
| 25 to 34 Years | 63 (19.8%) | 39 (15.1%) |
| 35 to 44 Years | 1 (0.6%) | 46 (20.5%) |
| 45 to 54 Years | 0 (0.0%) | 0 (0.0%) |
| 55 to 64 Years | 27 (10.8%) | 11 (3.7%) |
| 65 to 74 Years | 13 (7.8%) | 64 (24.7%) |
| 75 Years and over | 12 (21.4%) | 13 (10.8%) |
| Total | 155 (9.2%) | 173 (9.1%) |
Income Above Poverty by Sex and Age in North Lakeville
According to the poverty statistics in North Lakeville, males aged under 5 years and females aged under 5 years are the age groups that are most secure financially, with 100.0% of males and 100.0% of females in these age groups living above the poverty line.
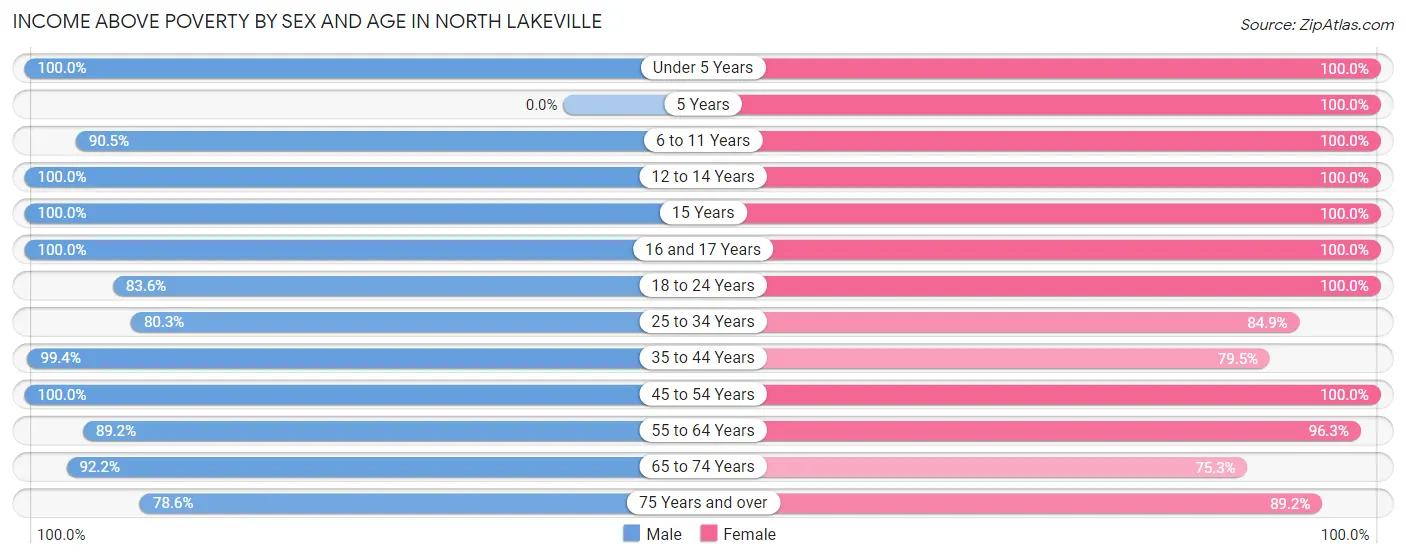
| Age Bracket | Male | Female |
| Under 5 Years | 109 (100.0%) | 194 (100.0%) |
| 5 Years | 0 (0.0%) | 8 (100.0%) |
| 6 to 11 Years | 76 (90.5%) | 153 (100.0%) |
| 12 to 14 Years | 53 (100.0%) | 81 (100.0%) |
| 15 Years | 22 (100.0%) | 8 (100.0%) |
| 16 and 17 Years | 83 (100.0%) | 15 (100.0%) |
| 18 to 24 Years | 158 (83.6%) | 126 (100.0%) |
| 25 to 34 Years | 256 (80.2%) | 220 (84.9%) |
| 35 to 44 Years | 177 (99.4%) | 178 (79.5%) |
| 45 to 54 Years | 165 (100.0%) | 152 (100.0%) |
| 55 to 64 Years | 223 (89.2%) | 289 (96.3%) |
| 65 to 74 Years | 154 (92.2%) | 195 (75.3%) |
| 75 Years and over | 44 (78.6%) | 107 (89.2%) |
| Total | 1,520 (90.7%) | 1,726 (90.9%) |
Income Below Poverty Among Married-Couple Families in North Lakeville
The poverty statistics for married-couple families in North Lakeville show that 1.9% or 12 of the total 635 families live below the poverty line. Families with no children have the highest poverty rate of 3.4%, comprising of 12 families. On the other hand, families with 1 or 2 children have the lowest poverty rate of 0.0%, which includes 0 families.
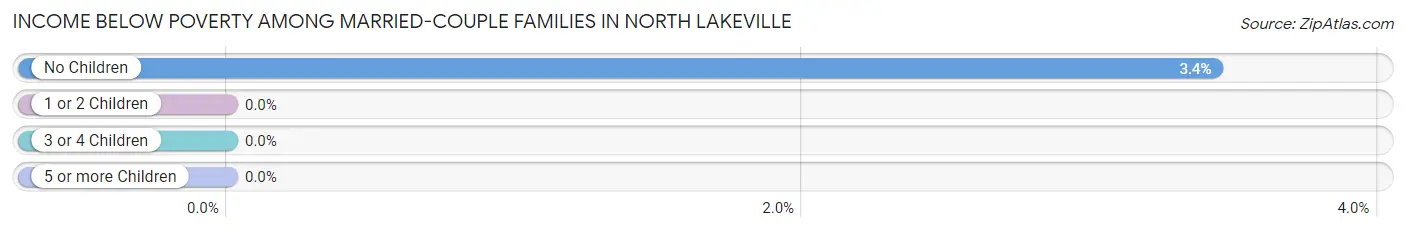
| Children | Above Poverty | Below Poverty |
| No Children | 338 (96.6%) | 12 (3.4%) |
| 1 or 2 Children | 206 (100.0%) | 0 (0.0%) |
| 3 or 4 Children | 79 (100.0%) | 0 (0.0%) |
| 5 or more Children | 0 (0.0%) | 0 (0.0%) |
| Total | 623 (98.1%) | 12 (1.9%) |
Income Below Poverty Among Single-Parent Households in North Lakeville
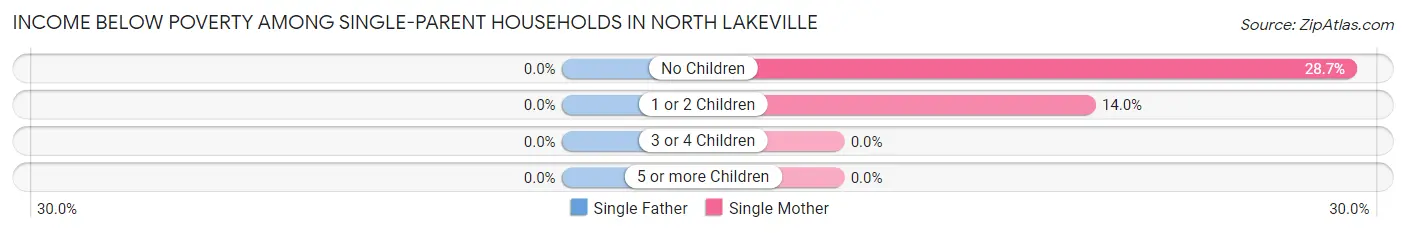
| Children | Single Father | Single Mother |
| No Children | 0 (0.0%) | 39 (28.7%) |
| 1 or 2 Children | 0 (0.0%) | 8 (14.0%) |
| 3 or 4 Children | 0 (0.0%) | 0 (0.0%) |
| 5 or more Children | 0 (0.0%) | 0 (0.0%) |
| Total | 0 (0.0%) | 47 (22.3%) |
Income Below Poverty Among Married-Couple vs Single-Parent Households in North Lakeville
The poverty data for North Lakeville shows that 12 of the married-couple family households (1.9%) and 47 of the single-parent households (15.2%) are living below the poverty level. Within the married-couple family households, those with no children have the highest poverty rate, with 12 households (3.4%) falling below the poverty line. Among the single-parent households, those with no children have the highest poverty rate, with 39 household (23.8%) living below poverty.
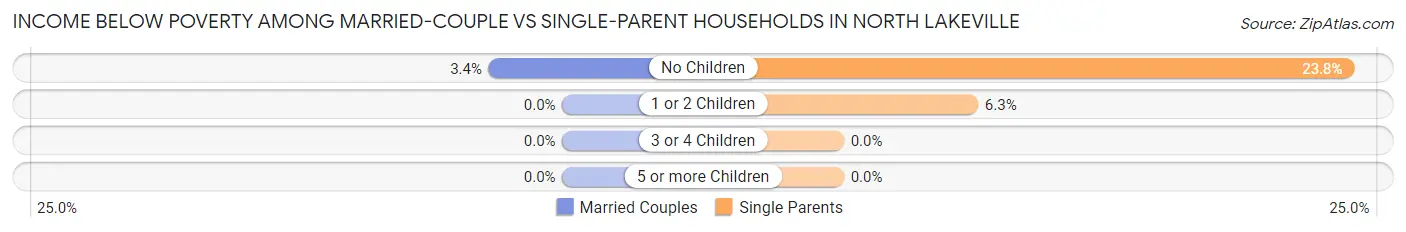
| Children | Married-Couple Families | Single-Parent Households |
| No Children | 12 (3.4%) | 39 (23.8%) |
| 1 or 2 Children | 0 (0.0%) | 8 (6.2%) |
| 3 or 4 Children | 0 (0.0%) | 0 (0.0%) |
| 5 or more Children | 0 (0.0%) | 0 (0.0%) |
| Total | 12 (1.9%) | 47 (15.2%) |
Employment Characteristics in North Lakeville
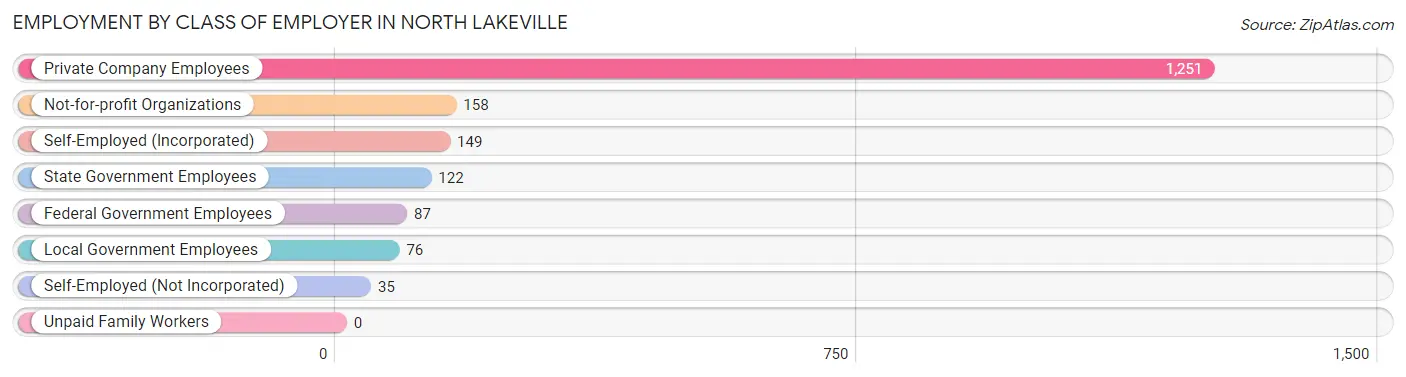
Employment by Class of Employer in North Lakeville
Among the 1,878 employed individuals in North Lakeville, private company employees (1,251 | 66.6%), not-for-profit organizations (158 | 8.4%), and self-employed (incorporated) (149 | 7.9%) make up the most common classes of employment.
| Employer Class | # Employees | % Employees |
| Private Company Employees | 1,251 | 66.6% |
| Self-Employed (Incorporated) | 149 | 7.9% |
| Self-Employed (Not Incorporated) | 35 | 1.9% |
| Not-for-profit Organizations | 158 | 8.4% |
| Local Government Employees | 76 | 4.1% |
| State Government Employees | 122 | 6.5% |
| Federal Government Employees | 87 | 4.6% |
| Unpaid Family Workers | 0 | 0.0% |
| Total | 1,878 | 100.0% |
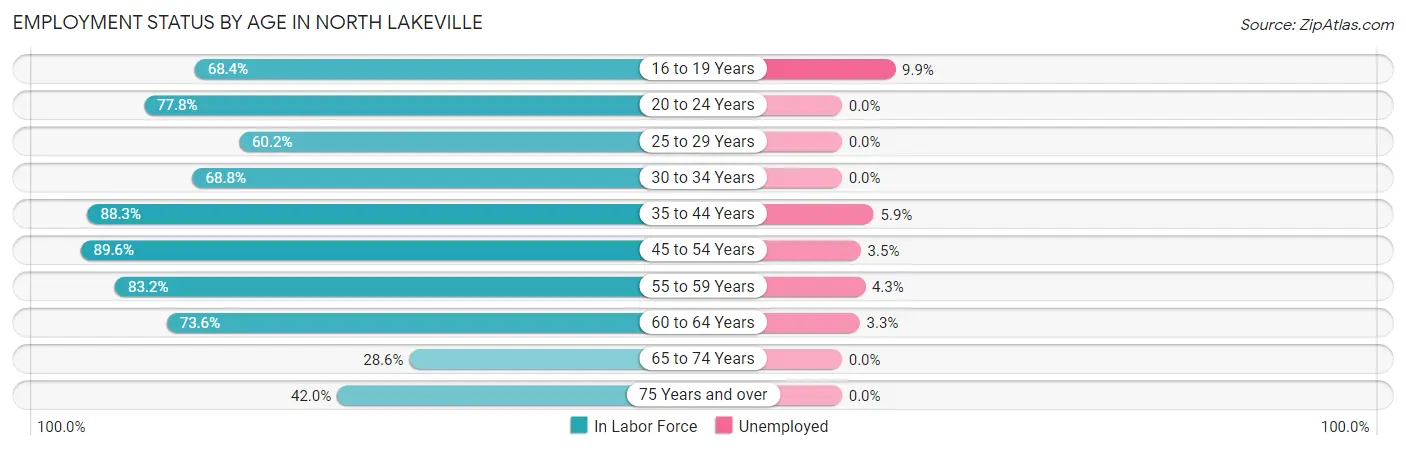
Employment Status by Age in North Lakeville
According to the labor force statistics for North Lakeville, out of the total population over 16 years of age (2,862), 68.1% or 1,949 individuals are in the labor force, with 3.2% or 62 of them unemployed. The age group with the highest labor force participation rate is 45 to 54 years, with 89.6% or 284 individuals in the labor force. Within the labor force, the 16 to 19 years age range has the highest percentage of unemployed individuals, with 9.9% or 14 of them being unemployed.
| Age Bracket | In Labor Force | Unemployed |
| 16 to 19 Years | 141 (68.4%) | 14 (9.9%) |
| 20 to 24 Years | 161 (77.8%) | 0 (0.0%) |
| 25 to 29 Years | 145 (60.2%) | 0 (0.0%) |
| 30 to 34 Years | 232 (68.8%) | 0 (0.0%) |
| 35 to 44 Years | 355 (88.3%) | 21 (5.9%) |
| 45 to 54 Years | 284 (89.6%) | 10 (3.5%) |
| 55 to 59 Years | 253 (83.2%) | 11 (4.3%) |
| 60 to 64 Years | 181 (73.6%) | 6 (3.3%) |
| 65 to 74 Years | 122 (28.6%) | 0 (0.0%) |
| 75 Years and over | 74 (42.0%) | 0 (0.0%) |
| Total | 1,949 (68.1%) | 62 (3.2%) |
Employment Status by Educational Attainment in North Lakeville
According to labor force statistics for North Lakeville, 78.5% of individuals (1,450) out of the total population between 25 and 64 years of age (1,847) are in the labor force, with 3.3% or 48 of them being unemployed. The group with the highest labor force participation rate are those with the educational attainment of high school diploma, with 90.0% or 362 individuals in the labor force. Within the labor force, individuals with college / associate degree education have the highest percentage of unemployment, with 3.5% or 11 of them being unemployed.

| Educational Attainment | In Labor Force | Unemployed |
| Less than High School | 17 (44.7%) | 0 (0.0%) |
| High School Diploma | 362 (90.0%) | 12 (3.0%) |
| College / Associate Degree | 310 (55.9%) | 19 (3.5%) |
| Bachelor's Degree or higher | 761 (89.3%) | 29 (3.4%) |
| Total | 1,450 (78.5%) | 61 (3.3%) |
Employment Occupations by Sex in North Lakeville
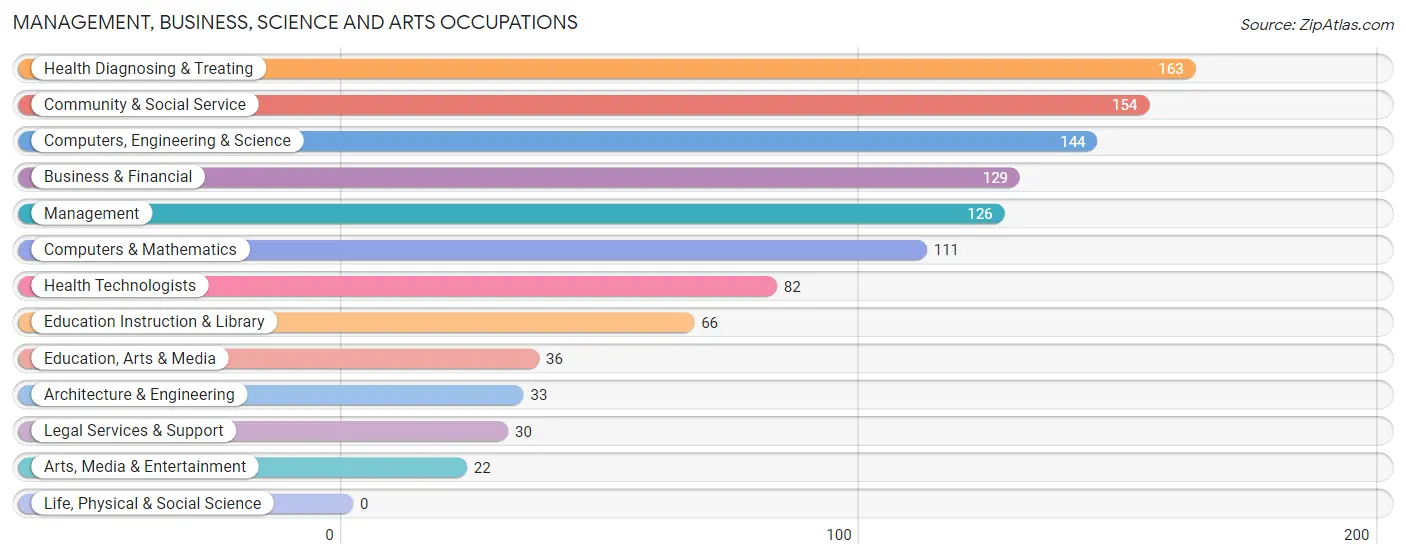
Management, Business, Science and Arts Occupations
The most common Management, Business, Science and Arts occupations in North Lakeville are Health Diagnosing & Treating (163 | 8.6%), Community & Social Service (154 | 8.2%), Computers, Engineering & Science (144 | 7.6%), Business & Financial (129 | 6.8%), and Management (126 | 6.7%).
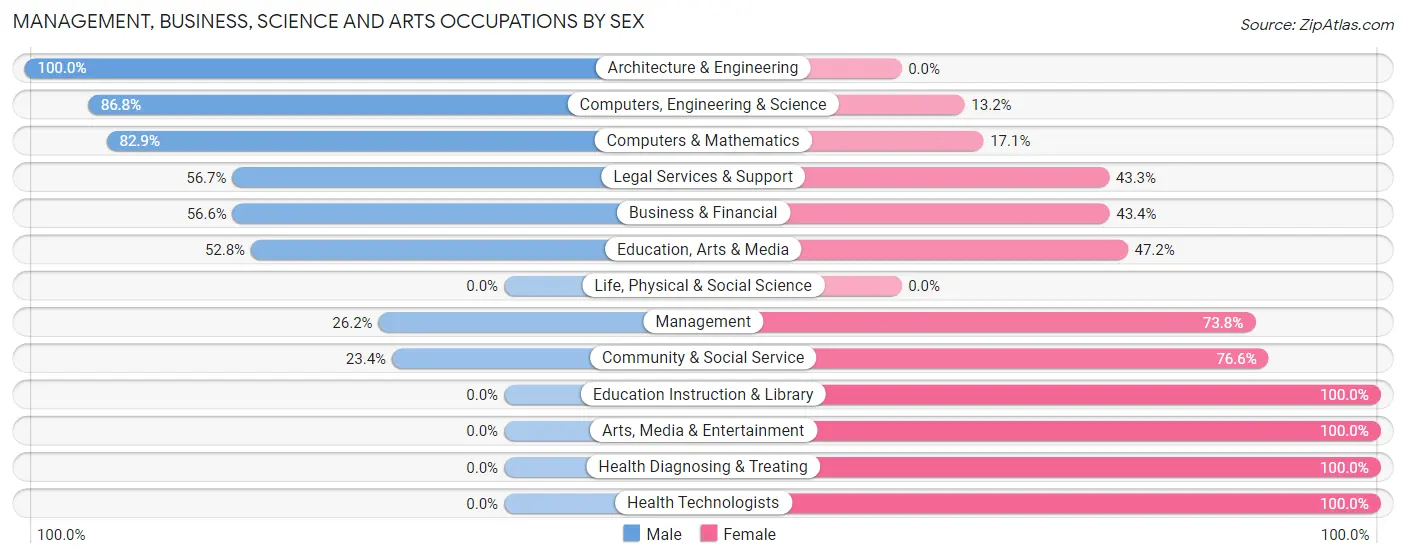
Management, Business, Science and Arts Occupations by Sex
Within the Management, Business, Science and Arts occupations in North Lakeville, the most male-oriented occupations are Architecture & Engineering (100.0%), Computers, Engineering & Science (86.8%), and Computers & Mathematics (82.9%), while the most female-oriented occupations are Education Instruction & Library (100.0%), Arts, Media & Entertainment (100.0%), and Health Diagnosing & Treating (100.0%).
| Occupation | Male | Female |
| Management | 33 (26.2%) | 93 (73.8%) |
| Business & Financial | 73 (56.6%) | 56 (43.4%) |
| Computers, Engineering & Science | 125 (86.8%) | 19 (13.2%) |
| Computers & Mathematics | 92 (82.9%) | 19 (17.1%) |
| Architecture & Engineering | 33 (100.0%) | 0 (0.0%) |
| Life, Physical & Social Science | 0 (0.0%) | 0 (0.0%) |
| Community & Social Service | 36 (23.4%) | 118 (76.6%) |
| Education, Arts & Media | 19 (52.8%) | 17 (47.2%) |
| Legal Services & Support | 17 (56.7%) | 13 (43.3%) |
| Education Instruction & Library | 0 (0.0%) | 66 (100.0%) |
| Arts, Media & Entertainment | 0 (0.0%) | 22 (100.0%) |
| Health Diagnosing & Treating | 0 (0.0%) | 163 (100.0%) |
| Health Technologists | 0 (0.0%) | 82 (100.0%) |
| Total (Category) | 267 (37.3%) | 449 (62.7%) |
| Total (Overall) | 880 (46.7%) | 1,006 (53.3%) |
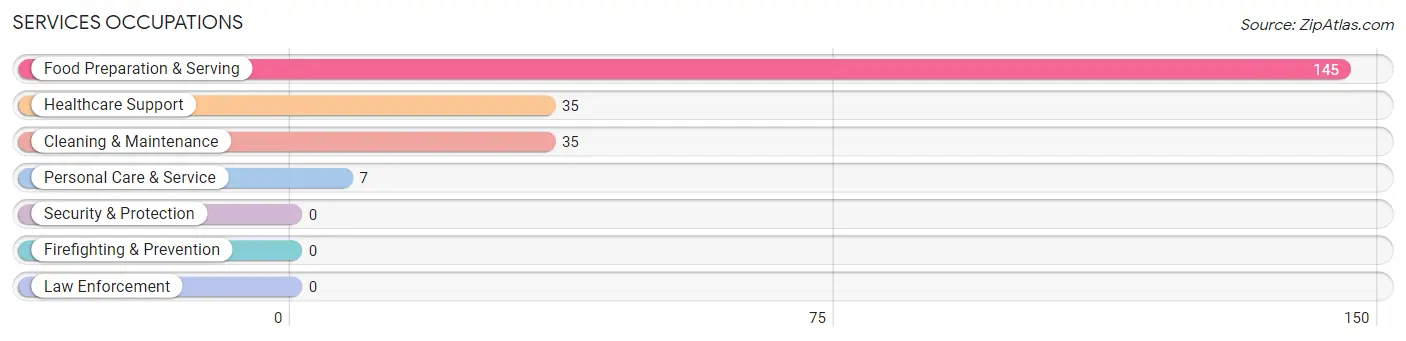
Services Occupations
The most common Services occupations in North Lakeville are Food Preparation & Serving (145 | 7.7%), Healthcare Support (35 | 1.9%), Cleaning & Maintenance (35 | 1.9%), and Personal Care & Service (7 | 0.4%).
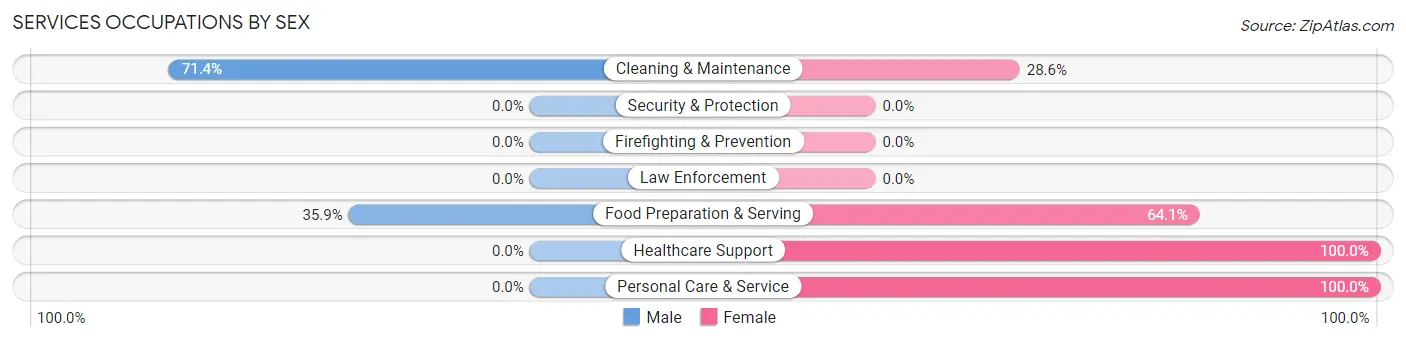
Services Occupations by Sex
Within the Services occupations in North Lakeville, the most male-oriented occupations are Cleaning & Maintenance (71.4%), and Food Preparation & Serving (35.9%), while the most female-oriented occupations are Healthcare Support (100.0%), Personal Care & Service (100.0%), and Food Preparation & Serving (64.1%).
| Occupation | Male | Female |
| Healthcare Support | 0 (0.0%) | 35 (100.0%) |
| Security & Protection | 0 (0.0%) | 0 (0.0%) |
| Firefighting & Prevention | 0 (0.0%) | 0 (0.0%) |
| Law Enforcement | 0 (0.0%) | 0 (0.0%) |
| Food Preparation & Serving | 52 (35.9%) | 93 (64.1%) |
| Cleaning & Maintenance | 25 (71.4%) | 10 (28.6%) |
| Personal Care & Service | 0 (0.0%) | 7 (100.0%) |
| Total (Category) | 77 (34.7%) | 145 (65.3%) |
| Total (Overall) | 880 (46.7%) | 1,006 (53.3%) |
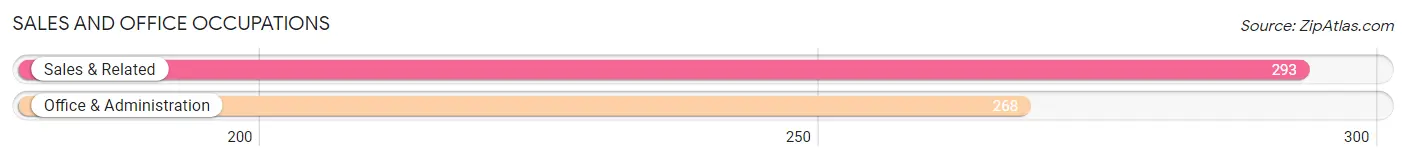
Sales and Office Occupations
The most common Sales and Office occupations in North Lakeville are Sales & Related (293 | 15.5%), and Office & Administration (268 | 14.2%).
Sales and Office Occupations by Sex

| Occupation | Male | Female |
| Sales & Related | 157 (53.6%) | 136 (46.4%) |
| Office & Administration | 38 (14.2%) | 230 (85.8%) |
| Total (Category) | 195 (34.8%) | 366 (65.2%) |
| Total (Overall) | 880 (46.7%) | 1,006 (53.3%) |
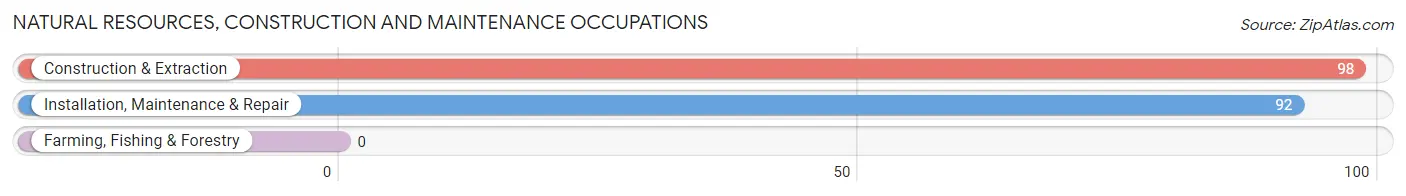
Natural Resources, Construction and Maintenance Occupations
The most common Natural Resources, Construction and Maintenance occupations in North Lakeville are Construction & Extraction (98 | 5.2%), and Installation, Maintenance & Repair (92 | 4.9%).
Natural Resources, Construction and Maintenance Occupations by Sex

| Occupation | Male | Female |
| Farming, Fishing & Forestry | 0 (0.0%) | 0 (0.0%) |
| Construction & Extraction | 98 (100.0%) | 0 (0.0%) |
| Installation, Maintenance & Repair | 92 (100.0%) | 0 (0.0%) |
| Total (Category) | 190 (100.0%) | 0 (0.0%) |
| Total (Overall) | 880 (46.7%) | 1,006 (53.3%) |
Production, Transportation and Moving Occupations
The most common Production, Transportation and Moving occupations in North Lakeville are Material Moving (84 | 4.4%), Production (69 | 3.7%), and Transportation (44 | 2.3%).

Production, Transportation and Moving Occupations by Sex
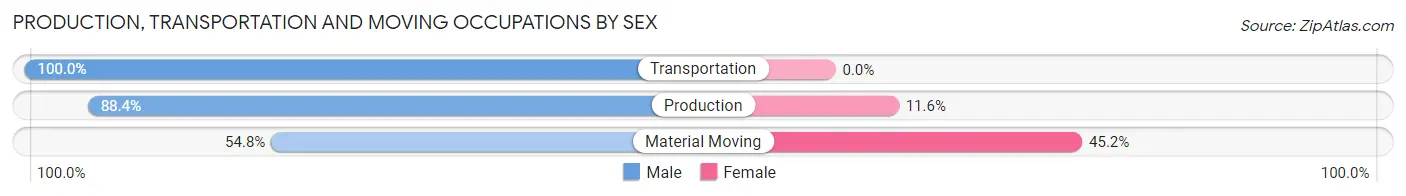
| Occupation | Male | Female |
| Production | 61 (88.4%) | 8 (11.6%) |
| Transportation | 44 (100.0%) | 0 (0.0%) |
| Material Moving | 46 (54.8%) | 38 (45.2%) |
| Total (Category) | 151 (76.6%) | 46 (23.4%) |
| Total (Overall) | 880 (46.7%) | 1,006 (53.3%) |
Employment Industries by Sex in North Lakeville
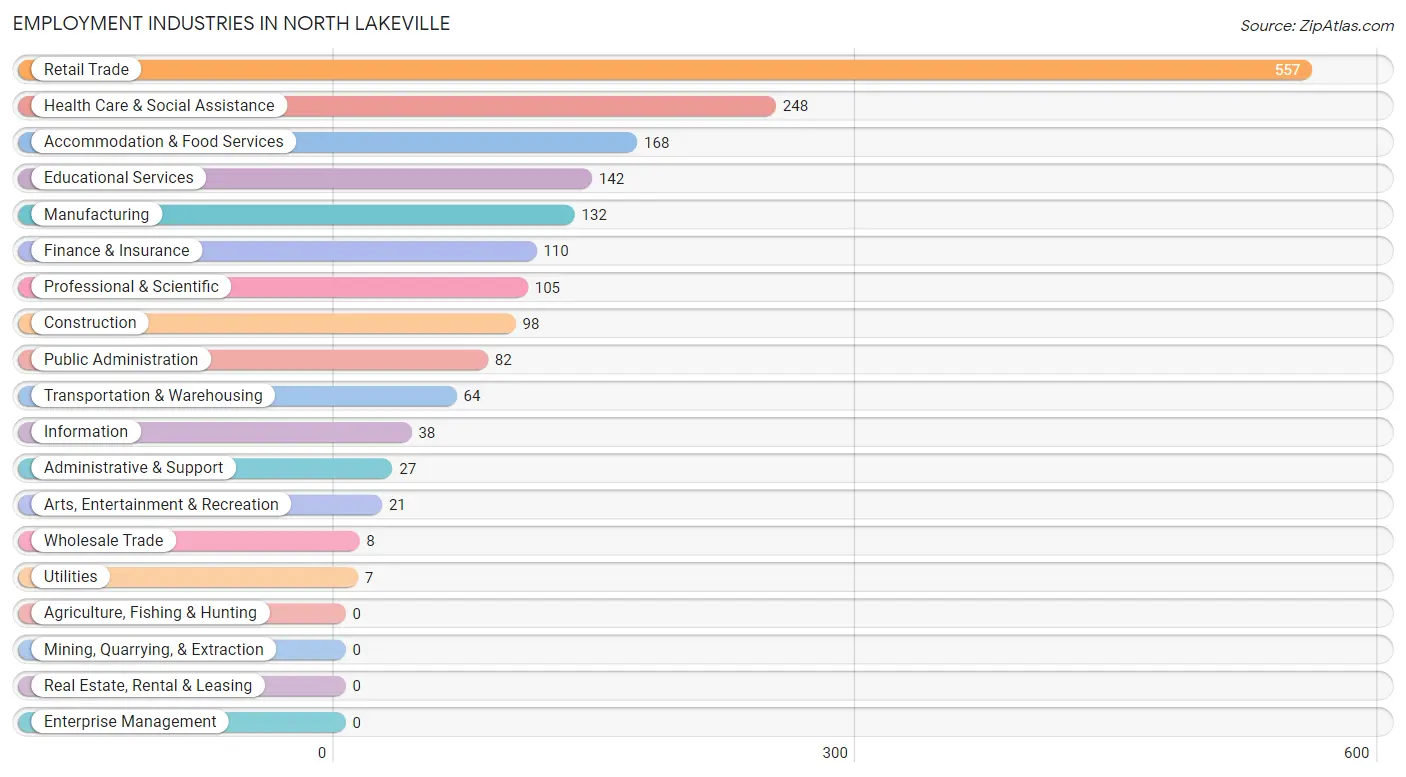
Employment Industries in North Lakeville
The major employment industries in North Lakeville include Retail Trade (557 | 29.5%), Health Care & Social Assistance (248 | 13.2%), Accommodation & Food Services (168 | 8.9%), Educational Services (142 | 7.5%), and Manufacturing (132 | 7.0%).
Employment Industries by Sex in North Lakeville
The North Lakeville industries that see more men than women are Construction (100.0%), Wholesale Trade (100.0%), and Utilities (100.0%), whereas the industries that tend to have a higher number of women are Arts, Entertainment & Recreation (100.0%), Health Care & Social Assistance (86.3%), and Educational Services (78.2%).
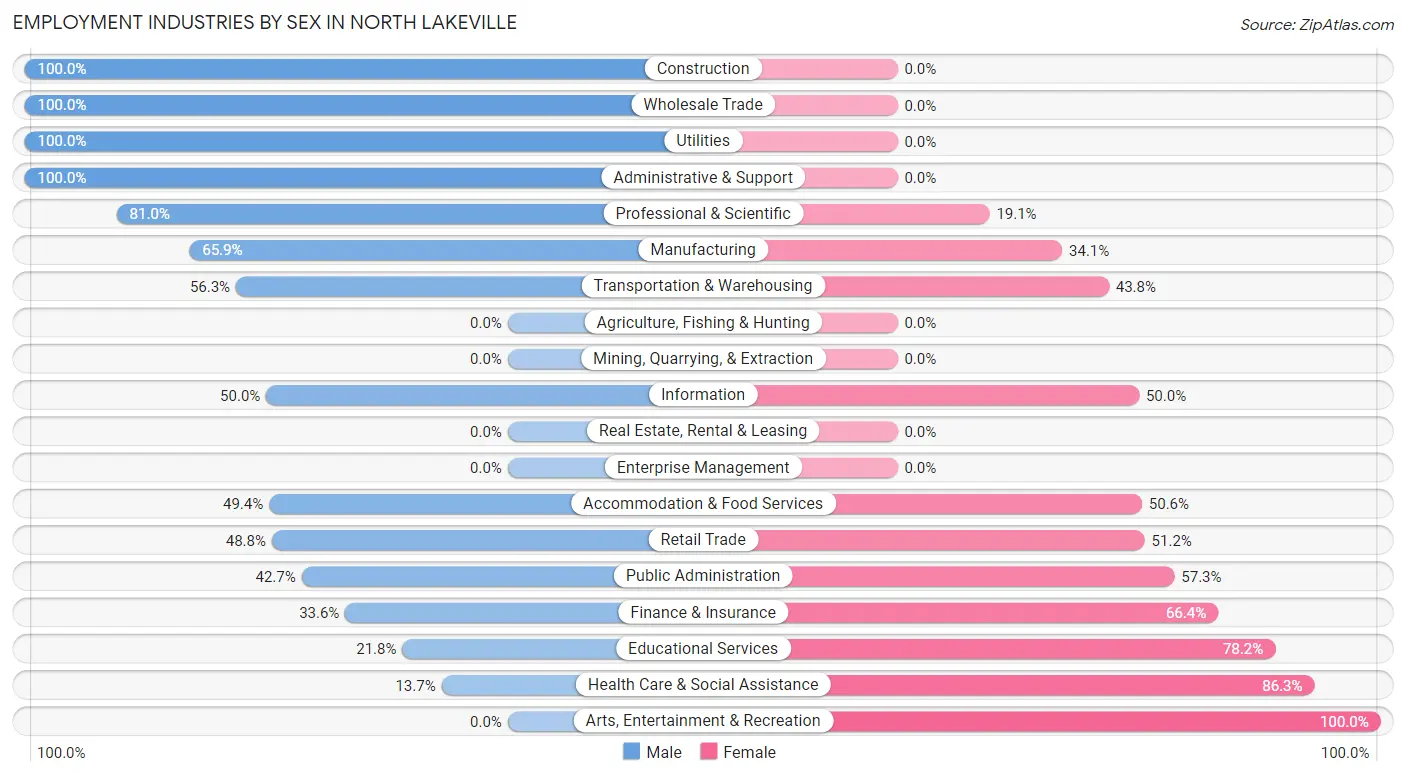
| Industry | Male | Female |
| Agriculture, Fishing & Hunting | 0 (0.0%) | 0 (0.0%) |
| Mining, Quarrying, & Extraction | 0 (0.0%) | 0 (0.0%) |
| Construction | 98 (100.0%) | 0 (0.0%) |
| Manufacturing | 87 (65.9%) | 45 (34.1%) |
| Wholesale Trade | 8 (100.0%) | 0 (0.0%) |
| Retail Trade | 272 (48.8%) | 285 (51.2%) |
| Transportation & Warehousing | 36 (56.2%) | 28 (43.8%) |
| Utilities | 7 (100.0%) | 0 (0.0%) |
| Information | 19 (50.0%) | 19 (50.0%) |
| Finance & Insurance | 37 (33.6%) | 73 (66.4%) |
| Real Estate, Rental & Leasing | 0 (0.0%) | 0 (0.0%) |
| Professional & Scientific | 85 (80.9%) | 20 (19.1%) |
| Enterprise Management | 0 (0.0%) | 0 (0.0%) |
| Administrative & Support | 27 (100.0%) | 0 (0.0%) |
| Educational Services | 31 (21.8%) | 111 (78.2%) |
| Health Care & Social Assistance | 34 (13.7%) | 214 (86.3%) |
| Arts, Entertainment & Recreation | 0 (0.0%) | 21 (100.0%) |
| Accommodation & Food Services | 83 (49.4%) | 85 (50.6%) |
| Public Administration | 35 (42.7%) | 47 (57.3%) |
| Total | 880 (46.7%) | 1,006 (53.3%) |
Education in North Lakeville
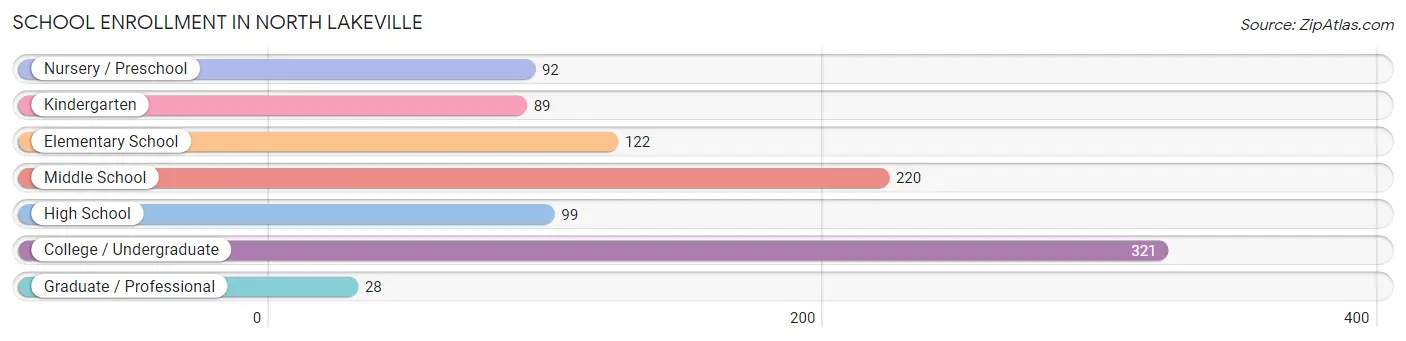
School Enrollment in North Lakeville
The most common levels of schooling among the 971 students in North Lakeville are college / undergraduate (321 | 33.1%), middle school (220 | 22.7%), and elementary school (122 | 12.6%).
| School Level | # Students | % Students |
| Nursery / Preschool | 92 | 9.5% |
| Kindergarten | 89 | 9.2% |
| Elementary School | 122 | 12.6% |
| Middle School | 220 | 22.7% |
| High School | 99 | 10.2% |
| College / Undergraduate | 321 | 33.1% |
| Graduate / Professional | 28 | 2.9% |
| Total | 971 | 100.0% |
School Enrollment by Age by Funding Source in North Lakeville
Out of a total of 971 students who are enrolled in schools in North Lakeville, 231 (23.8%) attend a private institution, while the remaining 740 (76.2%) are enrolled in public schools. The age group of 3 to 4 year olds has the highest likelihood of being enrolled in private schools, with 92 (100.0% in the age bracket) enrolled. Conversely, the age group of 10 to 14 year olds has the lowest likelihood of being enrolled in a private school, with 205 (100.0% in the age bracket) attending a public institution.
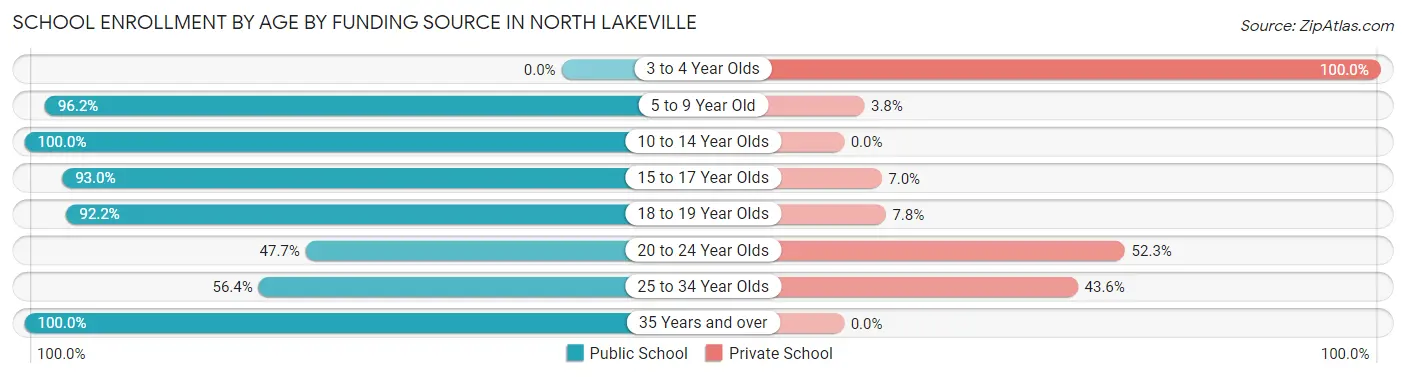
| Age Bracket | Public School | Private School |
| 3 to 4 Year Olds | 0 (0.0%) | 92 (100.0%) |
| 5 to 9 Year Old | 203 (96.2%) | 8 (3.8%) |
| 10 to 14 Year Olds | 205 (100.0%) | 0 (0.0%) |
| 15 to 17 Year Olds | 106 (93.0%) | 8 (7.0%) |
| 18 to 19 Year Olds | 71 (92.2%) | 6 (7.8%) |
| 20 to 24 Year Olds | 51 (47.7%) | 56 (52.3%) |
| 25 to 34 Year Olds | 79 (56.4%) | 61 (43.6%) |
| 35 Years and over | 25 (100.0%) | 0 (0.0%) |
| Total | 740 (76.2%) | 231 (23.8%) |
Educational Attainment by Field of Study in North Lakeville
Business (286 | 28.6%), science & technology (120 | 12.0%), psychology (73 | 7.3%), liberal arts & history (73 | 7.3%), and education (72 | 7.2%) are the most common fields of study among 1,000 individuals in North Lakeville who have obtained a bachelor's degree or higher.
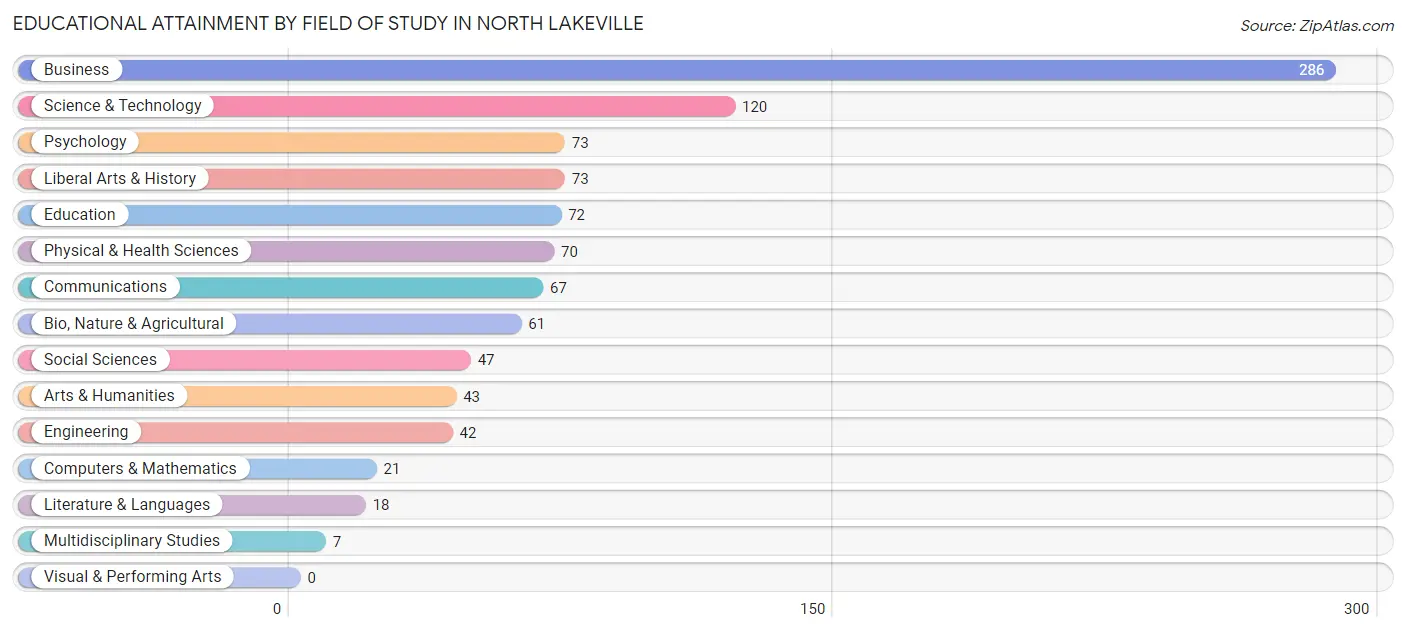
| Field of Study | # Graduates | % Graduates |
| Computers & Mathematics | 21 | 2.1% |
| Bio, Nature & Agricultural | 61 | 6.1% |
| Physical & Health Sciences | 70 | 7.0% |
| Psychology | 73 | 7.3% |
| Social Sciences | 47 | 4.7% |
| Engineering | 42 | 4.2% |
| Multidisciplinary Studies | 7 | 0.7% |
| Science & Technology | 120 | 12.0% |
| Business | 286 | 28.6% |
| Education | 72 | 7.2% |
| Literature & Languages | 18 | 1.8% |
| Liberal Arts & History | 73 | 7.3% |
| Visual & Performing Arts | 0 | 0.0% |
| Communications | 67 | 6.7% |
| Arts & Humanities | 43 | 4.3% |
| Total | 1,000 | 100.0% |
Transportation & Commute in North Lakeville
Vehicle Availability by Sex in North Lakeville
The most prevalent vehicle ownership categories in North Lakeville are males with 3 vehicles (395, accounting for 44.9%) and females with 3 vehicles (272, making up 39.6%).
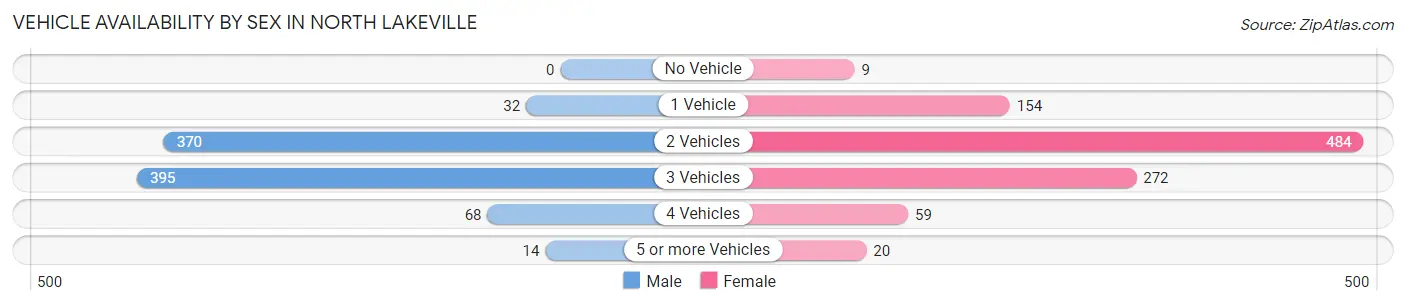
| Vehicles Available | Male | Female |
| No Vehicle | 0 (0.0%) | 9 (0.9%) |
| 1 Vehicle | 32 (3.6%) | 154 (15.4%) |
| 2 Vehicles | 370 (42.1%) | 484 (48.5%) |
| 3 Vehicles | 395 (44.9%) | 272 (27.3%) |
| 4 Vehicles | 68 (7.7%) | 59 (5.9%) |
| 5 or more Vehicles | 14 (1.6%) | 20 (2.0%) |
| Total | 879 (100.0%) | 998 (100.0%) |
Commute Time in North Lakeville
The most frequently occuring commute durations in North Lakeville are 30 to 34 minutes (238 commuters, 14.1%), 5 to 9 minutes (211 commuters, 12.5%), and less than 5 minutes (202 commuters, 12.0%).
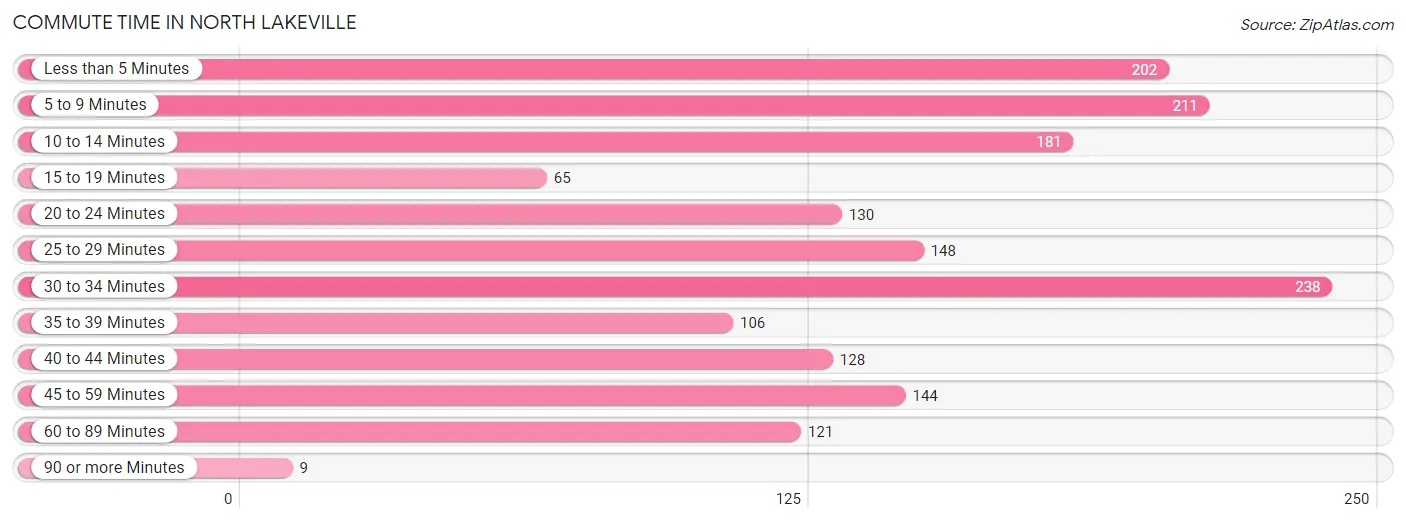
| Commute Time | # Commuters | % Commuters |
| Less than 5 Minutes | 202 | 12.0% |
| 5 to 9 Minutes | 211 | 12.5% |
| 10 to 14 Minutes | 181 | 10.7% |
| 15 to 19 Minutes | 65 | 3.9% |
| 20 to 24 Minutes | 130 | 7.7% |
| 25 to 29 Minutes | 148 | 8.8% |
| 30 to 34 Minutes | 238 | 14.1% |
| 35 to 39 Minutes | 106 | 6.3% |
| 40 to 44 Minutes | 128 | 7.6% |
| 45 to 59 Minutes | 144 | 8.6% |
| 60 to 89 Minutes | 121 | 7.2% |
| 90 or more Minutes | 9 | 0.5% |
Commute Time by Sex in North Lakeville
The most common commute times in North Lakeville are 40 to 44 minutes (115 commuters, 15.3%) for males and 30 to 34 minutes (137 commuters, 14.7%) for females.
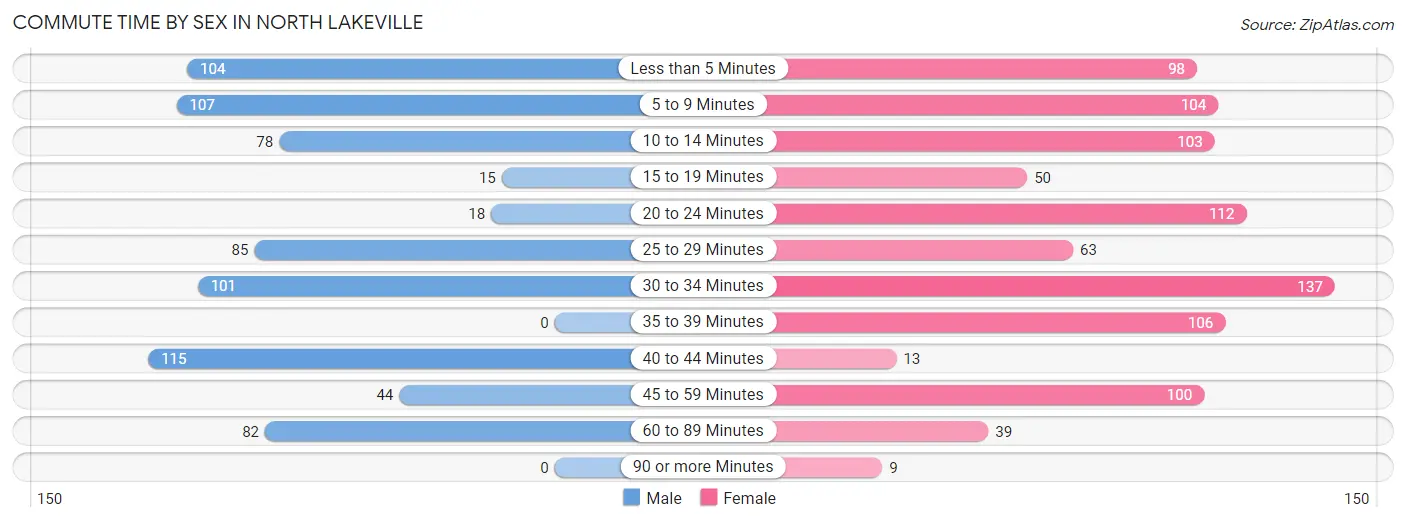
| Commute Time | Male | Female |
| Less than 5 Minutes | 104 (13.9%) | 98 (10.5%) |
| 5 to 9 Minutes | 107 (14.3%) | 104 (11.1%) |
| 10 to 14 Minutes | 78 (10.4%) | 103 (11.0%) |
| 15 to 19 Minutes | 15 (2.0%) | 50 (5.3%) |
| 20 to 24 Minutes | 18 (2.4%) | 112 (12.0%) |
| 25 to 29 Minutes | 85 (11.4%) | 63 (6.8%) |
| 30 to 34 Minutes | 101 (13.5%) | 137 (14.7%) |
| 35 to 39 Minutes | 0 (0.0%) | 106 (11.4%) |
| 40 to 44 Minutes | 115 (15.3%) | 13 (1.4%) |
| 45 to 59 Minutes | 44 (5.9%) | 100 (10.7%) |
| 60 to 89 Minutes | 82 (11.0%) | 39 (4.2%) |
| 90 or more Minutes | 0 (0.0%) | 9 (1.0%) |
Time of Departure to Work by Sex in North Lakeville
The most frequent times of departure to work in North Lakeville are 8:00 AM to 8:29 AM (196, 26.2%) for males and 8:00 AM to 8:29 AM (160, 17.1%) for females.
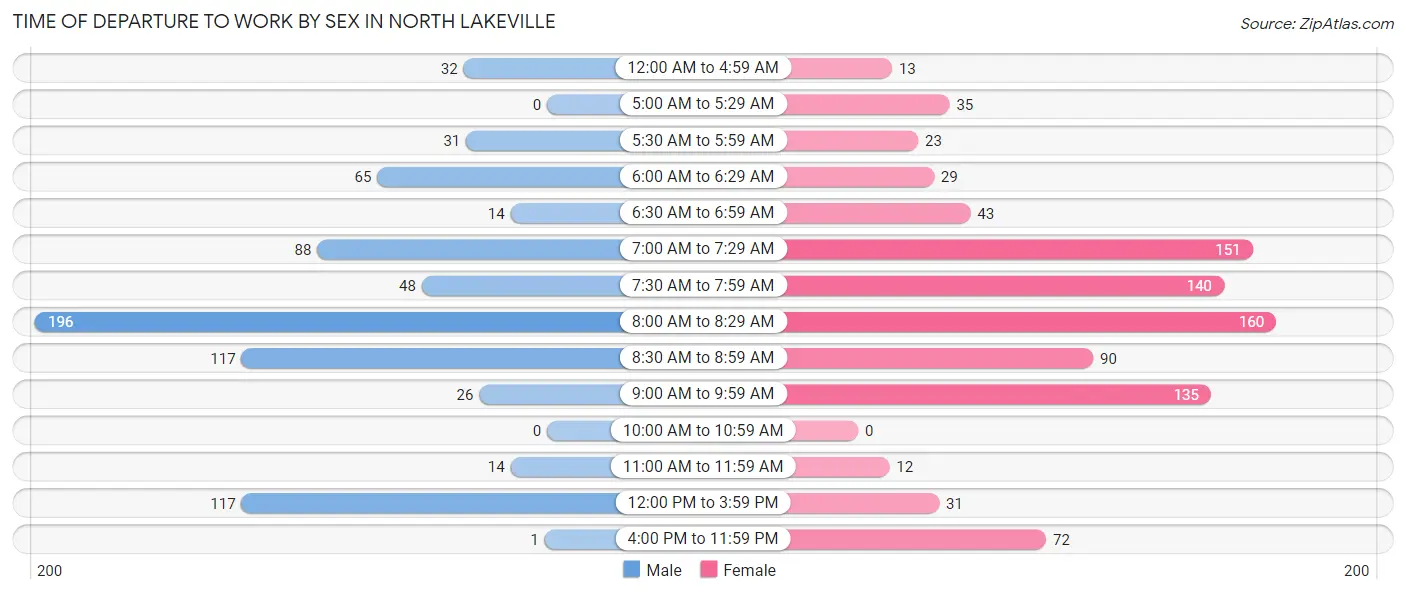
| Time of Departure | Male | Female |
| 12:00 AM to 4:59 AM | 32 (4.3%) | 13 (1.4%) |
| 5:00 AM to 5:29 AM | 0 (0.0%) | 35 (3.7%) |
| 5:30 AM to 5:59 AM | 31 (4.1%) | 23 (2.5%) |
| 6:00 AM to 6:29 AM | 65 (8.7%) | 29 (3.1%) |
| 6:30 AM to 6:59 AM | 14 (1.9%) | 43 (4.6%) |
| 7:00 AM to 7:29 AM | 88 (11.7%) | 151 (16.2%) |
| 7:30 AM to 7:59 AM | 48 (6.4%) | 140 (15.0%) |
| 8:00 AM to 8:29 AM | 196 (26.2%) | 160 (17.1%) |
| 8:30 AM to 8:59 AM | 117 (15.6%) | 90 (9.6%) |
| 9:00 AM to 9:59 AM | 26 (3.5%) | 135 (14.4%) |
| 10:00 AM to 10:59 AM | 0 (0.0%) | 0 (0.0%) |
| 11:00 AM to 11:59 AM | 14 (1.9%) | 12 (1.3%) |
| 12:00 PM to 3:59 PM | 117 (15.6%) | 31 (3.3%) |
| 4:00 PM to 11:59 PM | 1 (0.1%) | 72 (7.7%) |
| Total | 749 (100.0%) | 934 (100.0%) |
Housing Occupancy in North Lakeville
Occupancy by Ownership in North Lakeville
Of the total 1,357 dwellings in North Lakeville, owner-occupied units account for 869 (64.0%), while renter-occupied units make up 488 (36.0%).
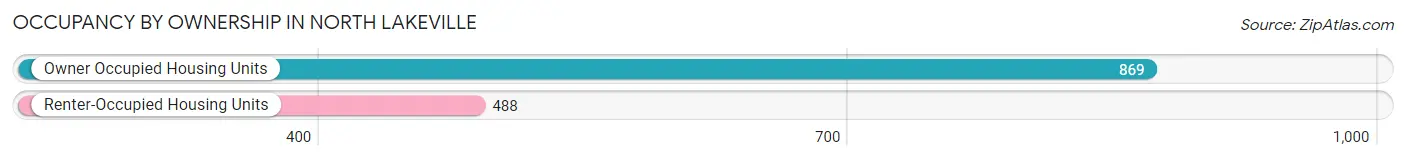
| Occupancy | # Housing Units | % Housing Units |
| Owner Occupied Housing Units | 869 | 64.0% |
| Renter-Occupied Housing Units | 488 | 36.0% |
| Total Occupied Housing Units | 1,357 | 100.0% |
Occupancy by Household Size in North Lakeville
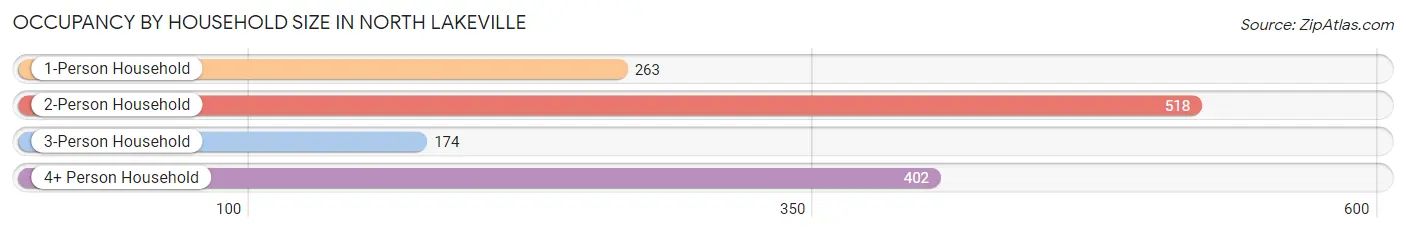
| Household Size | # Housing Units | % Housing Units |
| 1-Person Household | 263 | 19.4% |
| 2-Person Household | 518 | 38.2% |
| 3-Person Household | 174 | 12.8% |
| 4+ Person Household | 402 | 29.6% |
| Total Housing Units | 1,357 | 100.0% |
Occupancy by Ownership by Household Size in North Lakeville
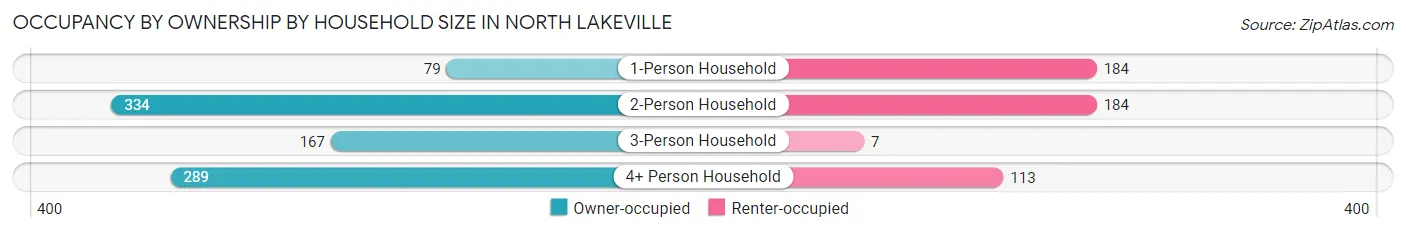
| Household Size | Owner-occupied | Renter-occupied |
| 1-Person Household | 79 (30.0%) | 184 (70.0%) |
| 2-Person Household | 334 (64.5%) | 184 (35.5%) |
| 3-Person Household | 167 (96.0%) | 7 (4.0%) |
| 4+ Person Household | 289 (71.9%) | 113 (28.1%) |
| Total Housing Units | 869 (64.0%) | 488 (36.0%) |
Occupancy by Educational Attainment in North Lakeville
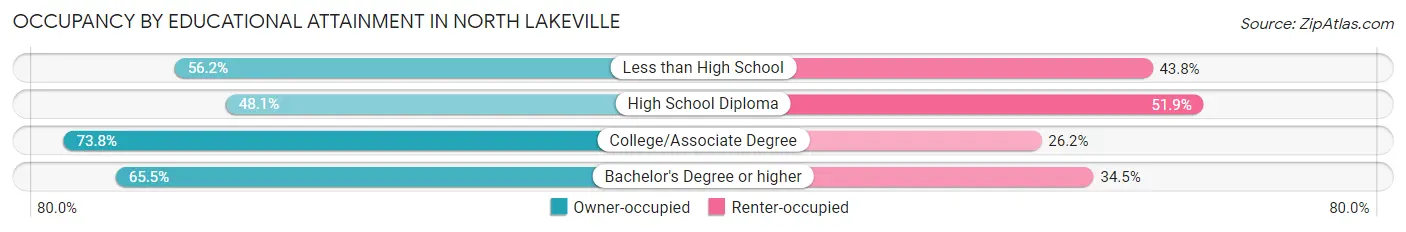
| Household Size | Owner-occupied | Renter-occupied |
| Less than High School | 50 (56.2%) | 39 (43.8%) |
| High School Diploma | 137 (48.1%) | 148 (51.9%) |
| College/Associate Degree | 338 (73.8%) | 120 (26.2%) |
| Bachelor's Degree or higher | 344 (65.5%) | 181 (34.5%) |
Occupancy by Age of Householder in North Lakeville
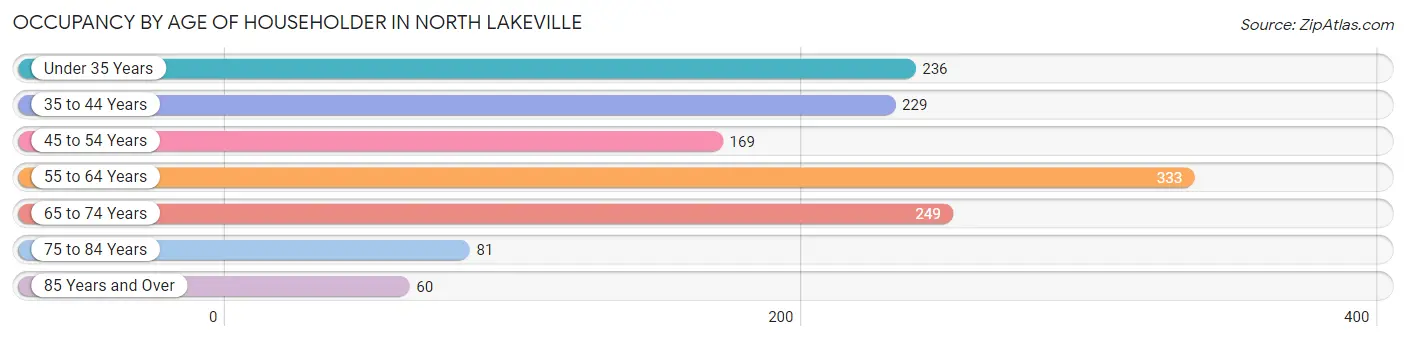
| Age Bracket | # Households | % Households |
| Under 35 Years | 236 | 17.4% |
| 35 to 44 Years | 229 | 16.9% |
| 45 to 54 Years | 169 | 12.4% |
| 55 to 64 Years | 333 | 24.5% |
| 65 to 74 Years | 249 | 18.3% |
| 75 to 84 Years | 81 | 6.0% |
| 85 Years and Over | 60 | 4.4% |
| Total | 1,357 | 100.0% |
Housing Finances in North Lakeville
Median Income by Occupancy in North Lakeville
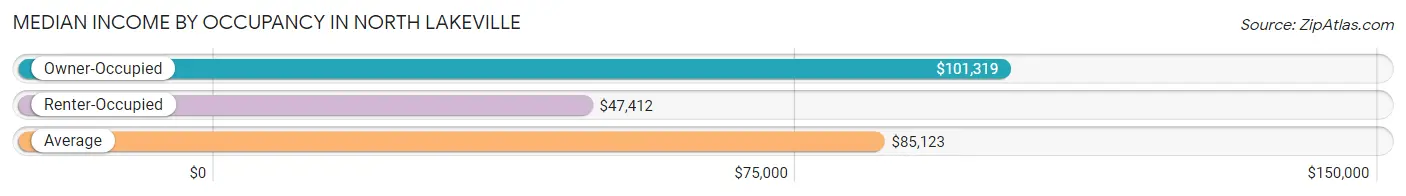
| Occupancy Type | # Households | Median Income |
| Owner-Occupied | 869 (64.0%) | $101,319 |
| Renter-Occupied | 488 (36.0%) | $47,412 |
| Average | 1,357 (100.0%) | $85,123 |
Occupancy by Householder Income Bracket in North Lakeville
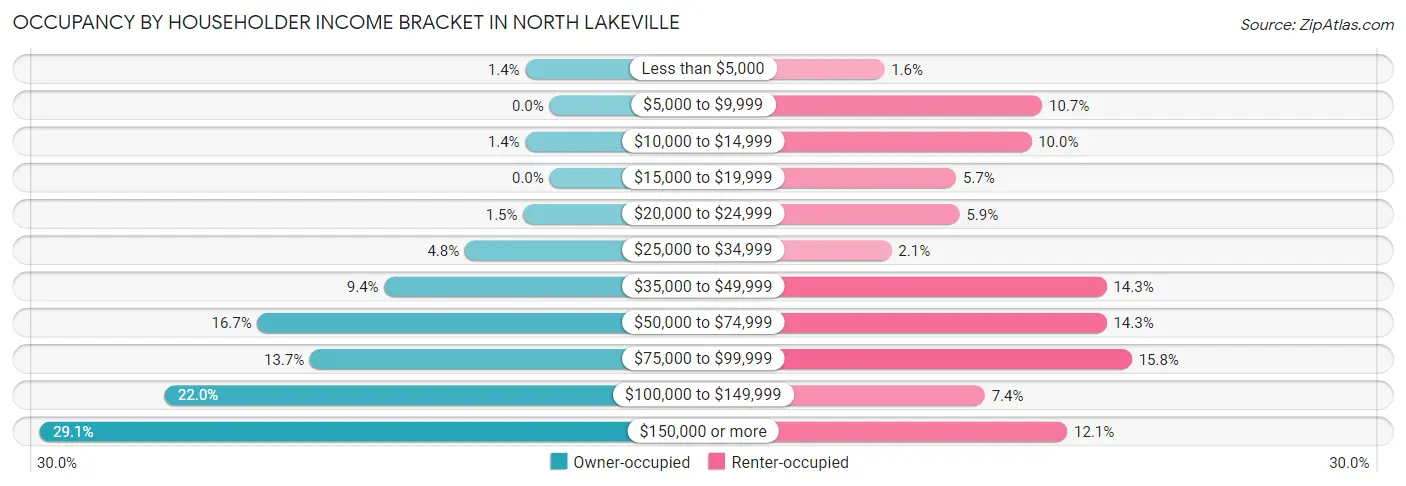
| Income Bracket | Owner-occupied | Renter-occupied |
| Less than $5,000 | 12 (1.4%) | 8 (1.6%) |
| $5,000 to $9,999 | 0 (0.0%) | 52 (10.7%) |
| $10,000 to $14,999 | 12 (1.4%) | 49 (10.0%) |
| $15,000 to $19,999 | 0 (0.0%) | 28 (5.7%) |
| $20,000 to $24,999 | 13 (1.5%) | 29 (5.9%) |
| $25,000 to $34,999 | 42 (4.8%) | 10 (2.1%) |
| $35,000 to $49,999 | 82 (9.4%) | 70 (14.3%) |
| $50,000 to $74,999 | 145 (16.7%) | 70 (14.3%) |
| $75,000 to $99,999 | 119 (13.7%) | 77 (15.8%) |
| $100,000 to $149,999 | 191 (22.0%) | 36 (7.4%) |
| $150,000 or more | 253 (29.1%) | 59 (12.1%) |
| Total | 869 (100.0%) | 488 (100.0%) |
Monthly Housing Cost Tiers in North Lakeville
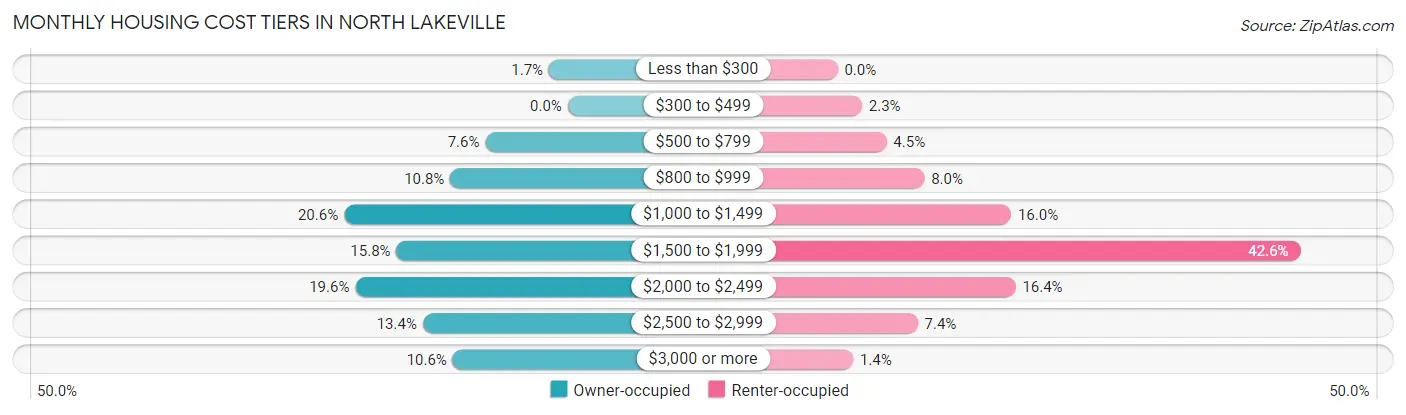
| Monthly Cost | Owner-occupied | Renter-occupied |
| Less than $300 | 15 (1.7%) | 0 (0.0%) |
| $300 to $499 | 0 (0.0%) | 11 (2.2%) |
| $500 to $799 | 66 (7.6%) | 22 (4.5%) |
| $800 to $999 | 94 (10.8%) | 39 (8.0%) |
| $1,000 to $1,499 | 179 (20.6%) | 78 (16.0%) |
| $1,500 to $1,999 | 137 (15.8%) | 208 (42.6%) |
| $2,000 to $2,499 | 170 (19.6%) | 80 (16.4%) |
| $2,500 to $2,999 | 116 (13.4%) | 36 (7.4%) |
| $3,000 or more | 92 (10.6%) | 7 (1.4%) |
| Total | 869 (100.0%) | 488 (100.0%) |
Physical Housing Characteristics in North Lakeville
Housing Structures in North Lakeville
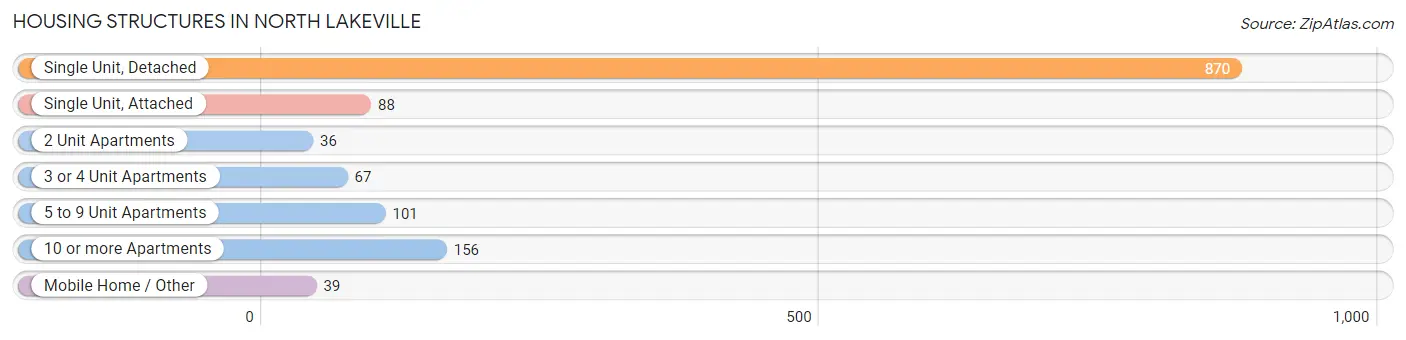
| Structure Type | # Housing Units | % Housing Units |
| Single Unit, Detached | 870 | 64.1% |
| Single Unit, Attached | 88 | 6.5% |
| 2 Unit Apartments | 36 | 2.6% |
| 3 or 4 Unit Apartments | 67 | 4.9% |
| 5 to 9 Unit Apartments | 101 | 7.4% |
| 10 or more Apartments | 156 | 11.5% |
| Mobile Home / Other | 39 | 2.9% |
| Total | 1,357 | 100.0% |
Housing Structures by Occupancy in North Lakeville
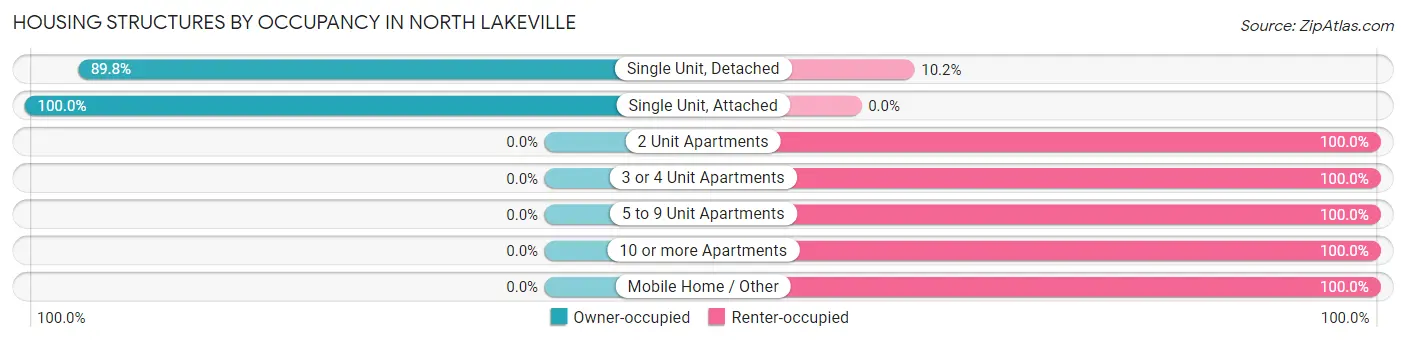
| Structure Type | Owner-occupied | Renter-occupied |
| Single Unit, Detached | 781 (89.8%) | 89 (10.2%) |
| Single Unit, Attached | 88 (100.0%) | 0 (0.0%) |
| 2 Unit Apartments | 0 (0.0%) | 36 (100.0%) |
| 3 or 4 Unit Apartments | 0 (0.0%) | 67 (100.0%) |
| 5 to 9 Unit Apartments | 0 (0.0%) | 101 (100.0%) |
| 10 or more Apartments | 0 (0.0%) | 156 (100.0%) |
| Mobile Home / Other | 0 (0.0%) | 39 (100.0%) |
| Total | 869 (64.0%) | 488 (36.0%) |
Housing Structures by Number of Rooms in North Lakeville
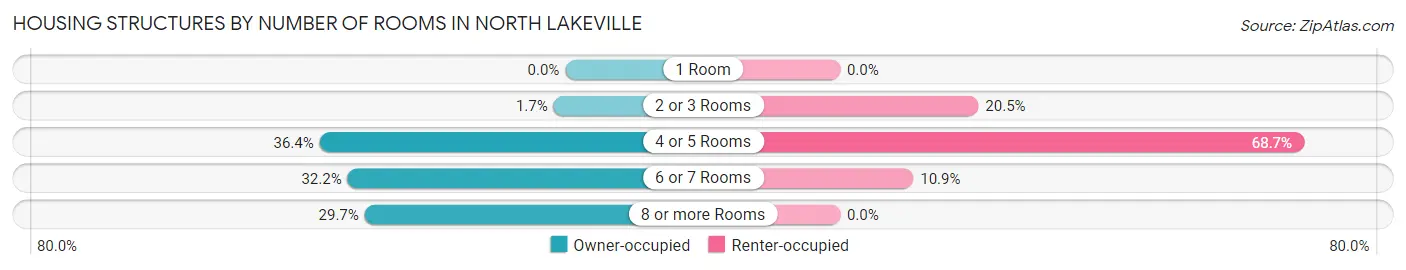
| Number of Rooms | Owner-occupied | Renter-occupied |
| 1 Room | 0 (0.0%) | 0 (0.0%) |
| 2 or 3 Rooms | 15 (1.7%) | 100 (20.5%) |
| 4 or 5 Rooms | 316 (36.4%) | 335 (68.6%) |
| 6 or 7 Rooms | 280 (32.2%) | 53 (10.9%) |
| 8 or more Rooms | 258 (29.7%) | 0 (0.0%) |
| Total | 869 (100.0%) | 488 (100.0%) |
Housing Structure by Heating Type in North Lakeville
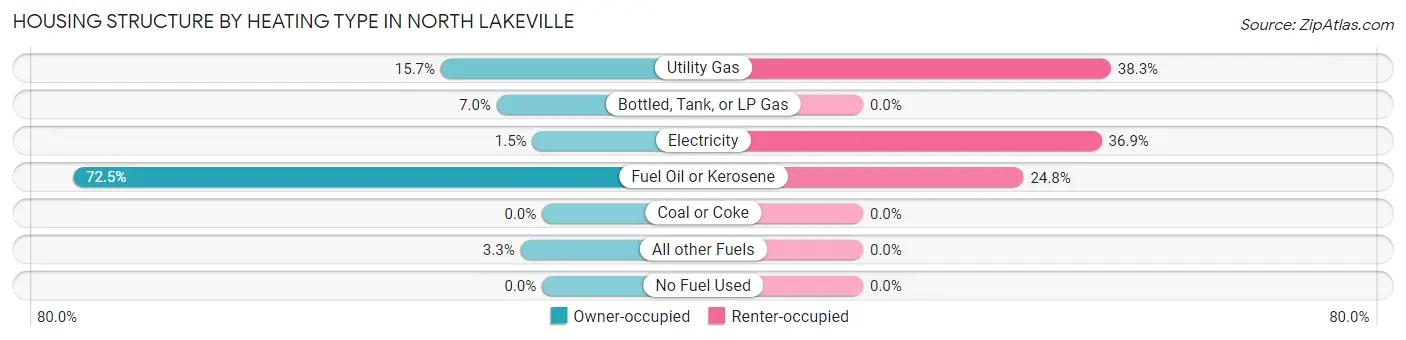
| Heating Type | Owner-occupied | Renter-occupied |
| Utility Gas | 136 (15.7%) | 187 (38.3%) |
| Bottled, Tank, or LP Gas | 61 (7.0%) | 0 (0.0%) |
| Electricity | 13 (1.5%) | 180 (36.9%) |
| Fuel Oil or Kerosene | 630 (72.5%) | 121 (24.8%) |
| Coal or Coke | 0 (0.0%) | 0 (0.0%) |
| All other Fuels | 29 (3.3%) | 0 (0.0%) |
| No Fuel Used | 0 (0.0%) | 0 (0.0%) |
| Total | 869 (100.0%) | 488 (100.0%) |
Household Vehicle Usage in North Lakeville
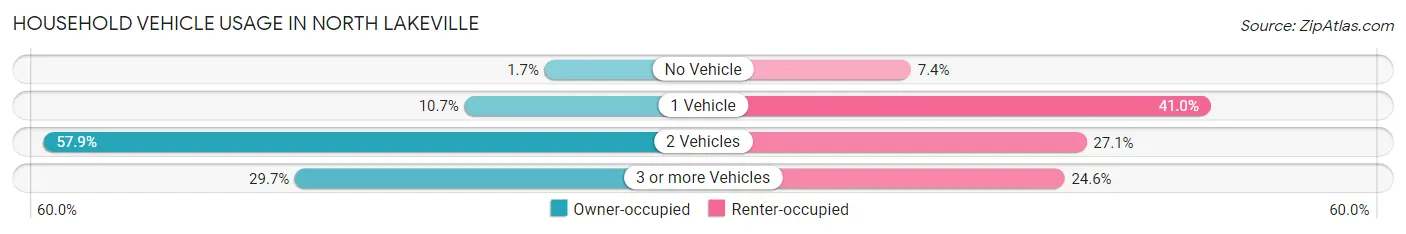
| Vehicles per Household | Owner-occupied | Renter-occupied |
| No Vehicle | 15 (1.7%) | 36 (7.4%) |
| 1 Vehicle | 93 (10.7%) | 200 (41.0%) |
| 2 Vehicles | 503 (57.9%) | 132 (27.1%) |
| 3 or more Vehicles | 258 (29.7%) | 120 (24.6%) |
| Total | 869 (100.0%) | 488 (100.0%) |
Real Estate & Mortgages in North Lakeville
Real Estate and Mortgage Overview in North Lakeville
| Characteristic | Without Mortgage | With Mortgage |
| Housing Units | 274 | 595 |
| Median Property Value | $482,500 | $463,000 |
| Median Household Income | $124,792 | $128 |
| Monthly Housing Costs | $960 | $92 |
| Real Estate Taxes | $5,617 | $25 |
Property Value by Mortgage Status in North Lakeville
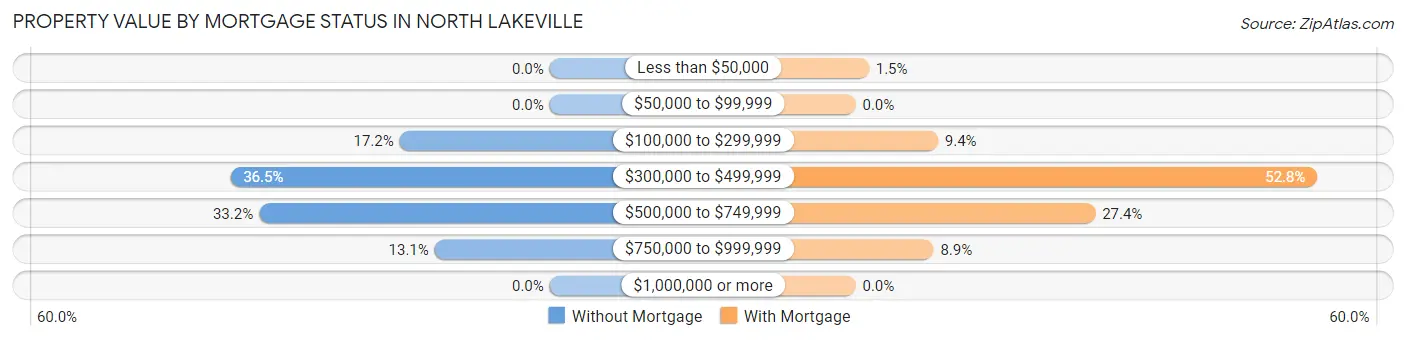
| Property Value | Without Mortgage | With Mortgage |
| Less than $50,000 | 0 (0.0%) | 9 (1.5%) |
| $50,000 to $99,999 | 0 (0.0%) | 0 (0.0%) |
| $100,000 to $299,999 | 47 (17.2%) | 56 (9.4%) |
| $300,000 to $499,999 | 100 (36.5%) | 314 (52.8%) |
| $500,000 to $749,999 | 91 (33.2%) | 163 (27.4%) |
| $750,000 to $999,999 | 36 (13.1%) | 53 (8.9%) |
| $1,000,000 or more | 0 (0.0%) | 0 (0.0%) |
| Total | 274 (100.0%) | 595 (100.0%) |
Household Income by Mortgage Status in North Lakeville
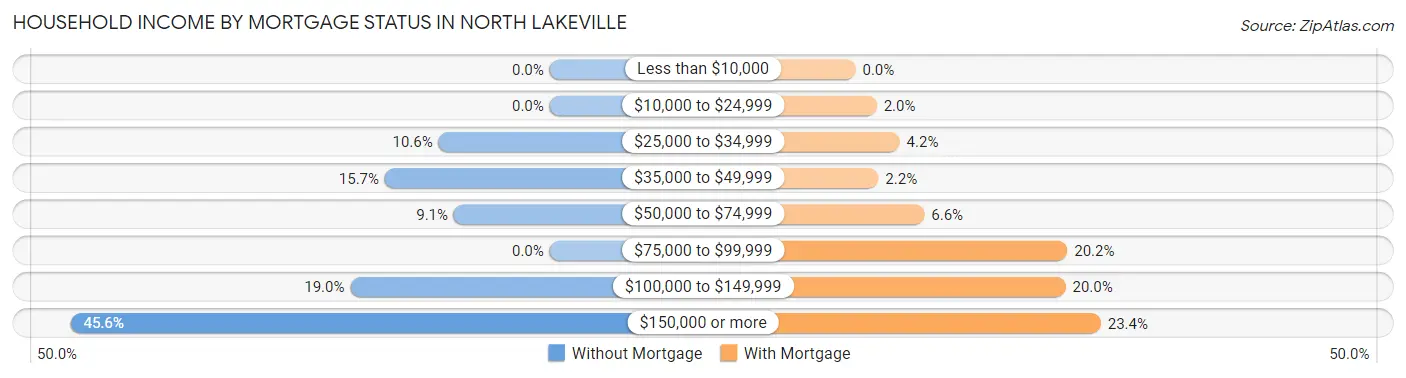
| Household Income | Without Mortgage | With Mortgage |
| Less than $10,000 | 0 (0.0%) | 0 (0.0%) |
| $10,000 to $24,999 | 0 (0.0%) | 12 (2.0%) |
| $25,000 to $34,999 | 29 (10.6%) | 25 (4.2%) |
| $35,000 to $49,999 | 43 (15.7%) | 13 (2.2%) |
| $50,000 to $74,999 | 25 (9.1%) | 39 (6.6%) |
| $75,000 to $99,999 | 0 (0.0%) | 120 (20.2%) |
| $100,000 to $149,999 | 52 (19.0%) | 119 (20.0%) |
| $150,000 or more | 125 (45.6%) | 139 (23.4%) |
| Total | 274 (100.0%) | 595 (100.0%) |
Property Value to Household Income Ratio in North Lakeville
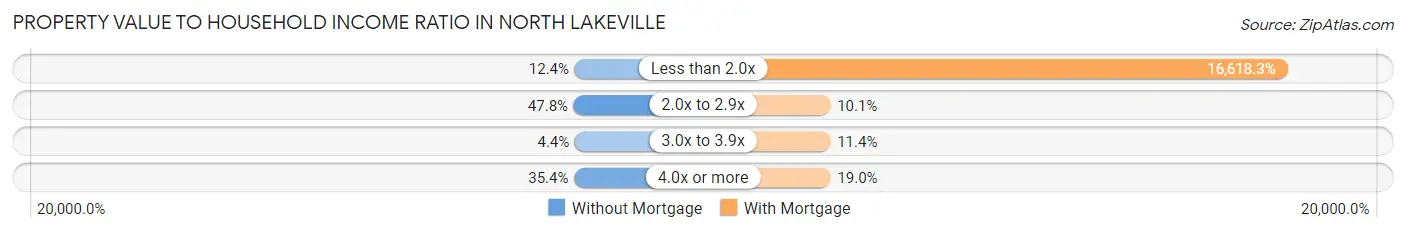
| Value-to-Income Ratio | Without Mortgage | With Mortgage |
| Less than 2.0x | 34 (12.4%) | 98,879 (16,618.3%) |
| 2.0x to 2.9x | 131 (47.8%) | 60 (10.1%) |
| 3.0x to 3.9x | 12 (4.4%) | 68 (11.4%) |
| 4.0x or more | 97 (35.4%) | 113 (19.0%) |
| Total | 274 (100.0%) | 595 (100.0%) |
Real Estate Taxes by Mortgage Status in North Lakeville

| Property Taxes | Without Mortgage | With Mortgage |
| Less than $800 | 0 (0.0%) | 0 (0.0%) |
| $800 to $1,499 | 0 (0.0%) | 0 (0.0%) |
| $800 to $1,499 | 259 (94.5%) | 33 (5.6%) |
| Total | 274 (100.0%) | 595 (100.0%) |
Health & Disability in North Lakeville
Health Insurance Coverage by Age in North Lakeville
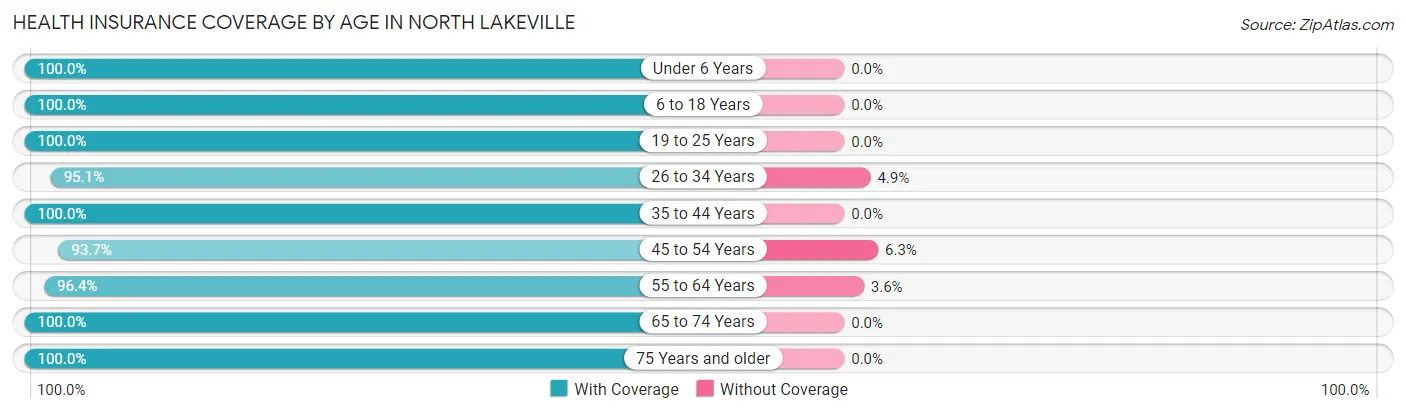
| Age Bracket | With Coverage | Without Coverage |
| Under 6 Years | 335 (100.0%) | 0 (0.0%) |
| 6 to 18 Years | 571 (100.0%) | 0 (0.0%) |
| 19 to 25 Years | 346 (100.0%) | 0 (0.0%) |
| 26 to 34 Years | 487 (95.1%) | 25 (4.9%) |
| 35 to 44 Years | 402 (100.0%) | 0 (0.0%) |
| 45 to 54 Years | 297 (93.7%) | 20 (6.3%) |
| 55 to 64 Years | 530 (96.4%) | 20 (3.6%) |
| 65 to 74 Years | 426 (100.0%) | 0 (0.0%) |
| 75 Years and older | 176 (100.0%) | 0 (0.0%) |
| Total | 3,570 (98.2%) | 65 (1.8%) |
Health Insurance Coverage by Citizenship Status in North Lakeville

| Citizenship Status | With Coverage | Without Coverage |
| Native Born | 335 (100.0%) | 0 (0.0%) |
| Foreign Born, Citizen | 571 (100.0%) | 0 (0.0%) |
| Foreign Born, not a Citizen | 346 (100.0%) | 0 (0.0%) |
Health Insurance Coverage by Household Income in North Lakeville

| Household Income | With Coverage | Without Coverage |
| Under $25,000 | 302 (100.0%) | 0 (0.0%) |
| $25,000 to $49,999 | 502 (97.5%) | 13 (2.5%) |
| $50,000 to $74,999 | 590 (94.9%) | 32 (5.1%) |
| $75,000 to $99,999 | 423 (100.0%) | 0 (0.0%) |
| $100,000 and over | 1,748 (98.9%) | 20 (1.1%) |
Public vs Private Health Insurance Coverage by Age in North Lakeville
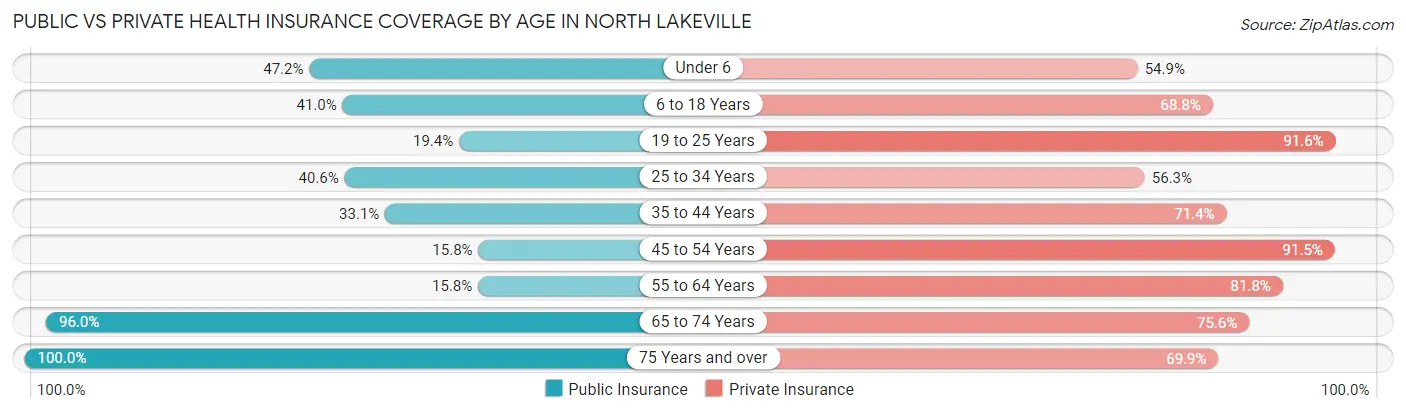
| Age Bracket | Public Insurance | Private Insurance |
| Under 6 | 158 (47.2%) | 184 (54.9%) |
| 6 to 18 Years | 234 (41.0%) | 393 (68.8%) |
| 19 to 25 Years | 67 (19.4%) | 317 (91.6%) |
| 25 to 34 Years | 208 (40.6%) | 288 (56.2%) |
| 35 to 44 Years | 133 (33.1%) | 287 (71.4%) |
| 45 to 54 Years | 50 (15.8%) | 290 (91.5%) |
| 55 to 64 Years | 87 (15.8%) | 450 (81.8%) |
| 65 to 74 Years | 409 (96.0%) | 322 (75.6%) |
| 75 Years and over | 176 (100.0%) | 123 (69.9%) |
| Total | 1,522 (41.9%) | 2,654 (73.0%) |
Disability Status by Sex by Age in North Lakeville
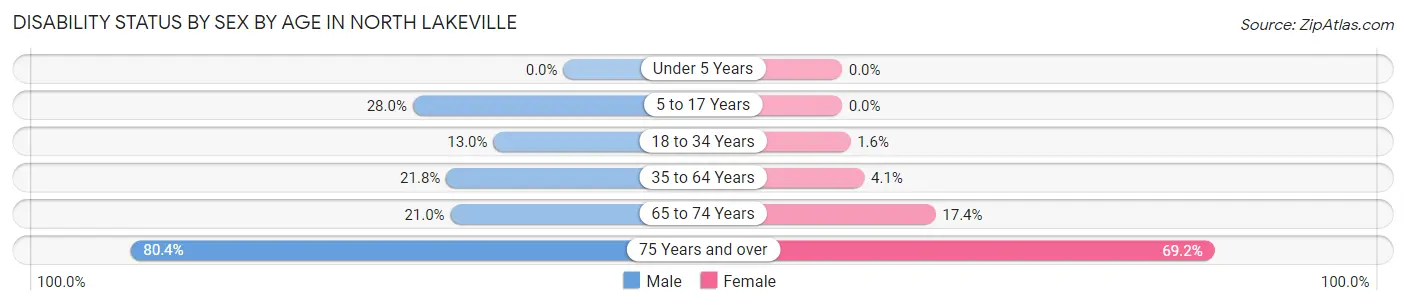
| Age Bracket | Male | Female |
| Under 5 Years | 0 (0.0%) | 0 (0.0%) |
| 5 to 17 Years | 78 (28.0%) | 0 (0.0%) |
| 18 to 34 Years | 66 (13.0%) | 6 (1.6%) |
| 35 to 64 Years | 129 (21.7%) | 28 (4.1%) |
| 65 to 74 Years | 35 (21.0%) | 45 (17.4%) |
| 75 Years and over | 45 (80.4%) | 83 (69.2%) |
Disability Class by Sex by Age in North Lakeville
Disability Class: Hearing Difficulty
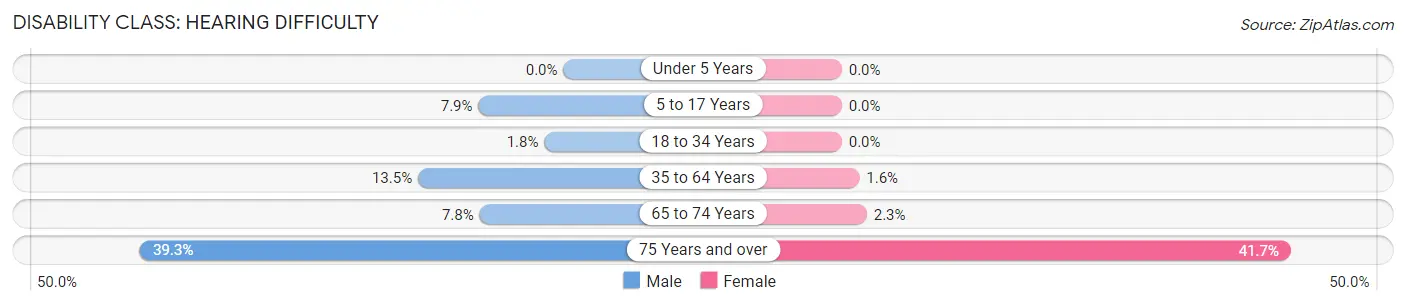
| Age Bracket | Male | Female |
| Under 5 Years | 0 (0.0%) | 0 (0.0%) |
| 5 to 17 Years | 22 (7.9%) | 0 (0.0%) |
| 18 to 34 Years | 9 (1.8%) | 0 (0.0%) |
| 35 to 64 Years | 80 (13.5%) | 11 (1.6%) |
| 65 to 74 Years | 13 (7.8%) | 6 (2.3%) |
| 75 Years and over | 22 (39.3%) | 50 (41.7%) |
Disability Class: Vision Difficulty
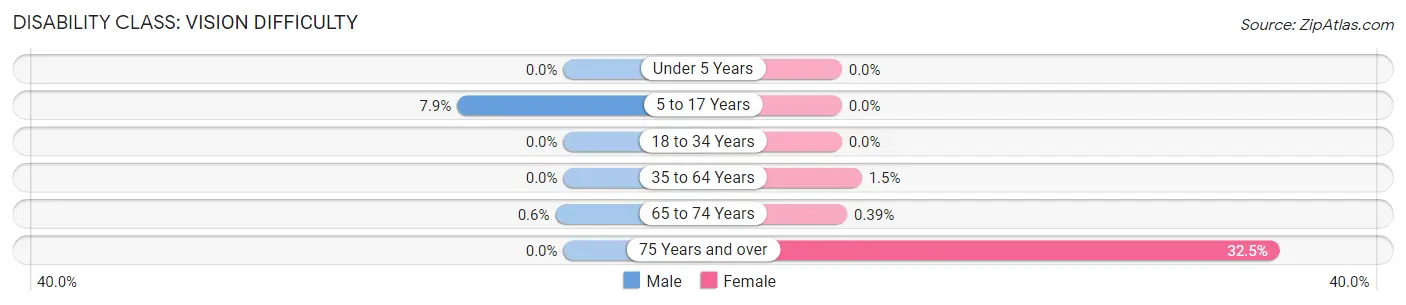
| Age Bracket | Male | Female |
| Under 5 Years | 0 (0.0%) | 0 (0.0%) |
| 5 to 17 Years | 22 (7.9%) | 0 (0.0%) |
| 18 to 34 Years | 0 (0.0%) | 0 (0.0%) |
| 35 to 64 Years | 0 (0.0%) | 10 (1.5%) |
| 65 to 74 Years | 1 (0.6%) | 1 (0.4%) |
| 75 Years and over | 0 (0.0%) | 39 (32.5%) |
Disability Class: Cognitive Difficulty
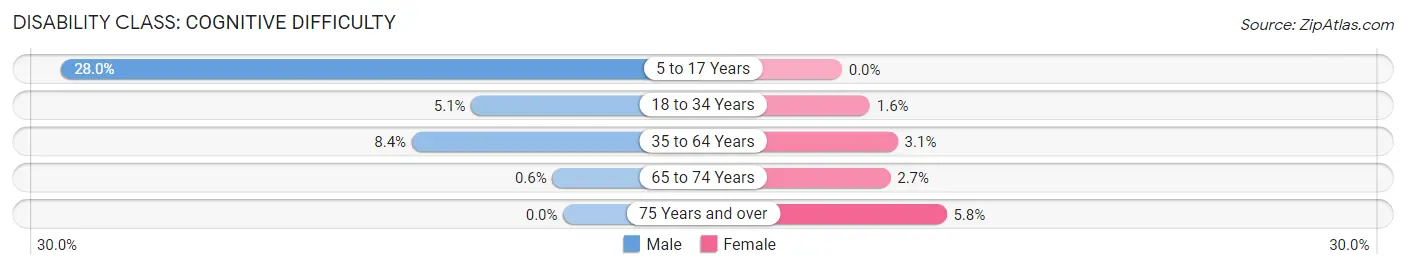
| Age Bracket | Male | Female |
| 5 to 17 Years | 78 (28.0%) | 0 (0.0%) |
| 18 to 34 Years | 26 (5.1%) | 6 (1.6%) |
| 35 to 64 Years | 50 (8.4%) | 21 (3.1%) |
| 65 to 74 Years | 1 (0.6%) | 7 (2.7%) |
| 75 Years and over | 0 (0.0%) | 7 (5.8%) |
Disability Class: Ambulatory Difficulty
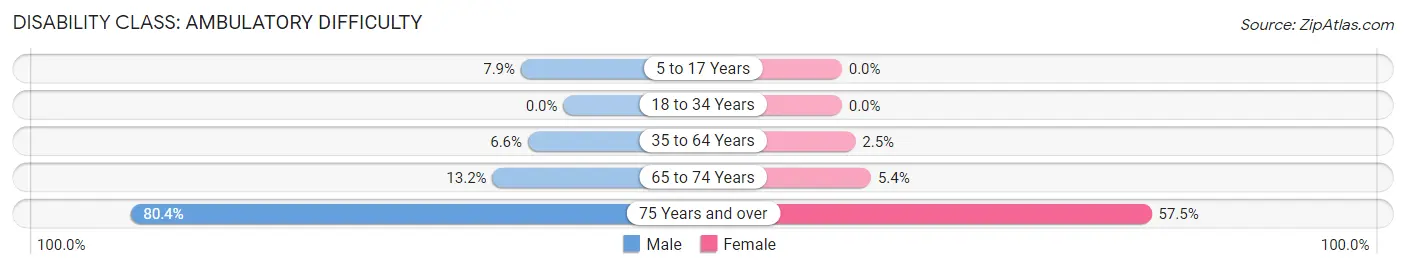
| Age Bracket | Male | Female |
| 5 to 17 Years | 22 (7.9%) | 0 (0.0%) |
| 18 to 34 Years | 0 (0.0%) | 0 (0.0%) |
| 35 to 64 Years | 39 (6.6%) | 17 (2.5%) |
| 65 to 74 Years | 22 (13.2%) | 14 (5.4%) |
| 75 Years and over | 45 (80.4%) | 69 (57.5%) |
Disability Class: Self-Care Difficulty
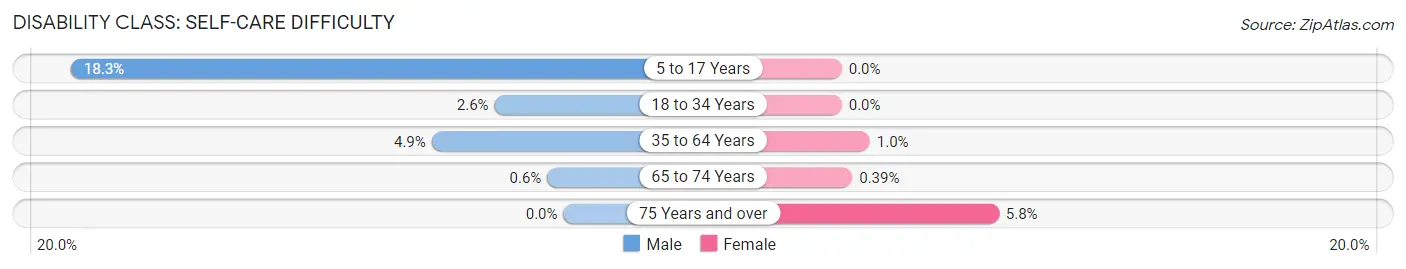
| Age Bracket | Male | Female |
| 5 to 17 Years | 51 (18.3%) | 0 (0.0%) |
| 18 to 34 Years | 13 (2.6%) | 0 (0.0%) |
| 35 to 64 Years | 29 (4.9%) | 7 (1.0%) |
| 65 to 74 Years | 1 (0.6%) | 1 (0.4%) |
| 75 Years and over | 0 (0.0%) | 7 (5.8%) |
Technology Access in North Lakeville
Computing Device Access in North Lakeville
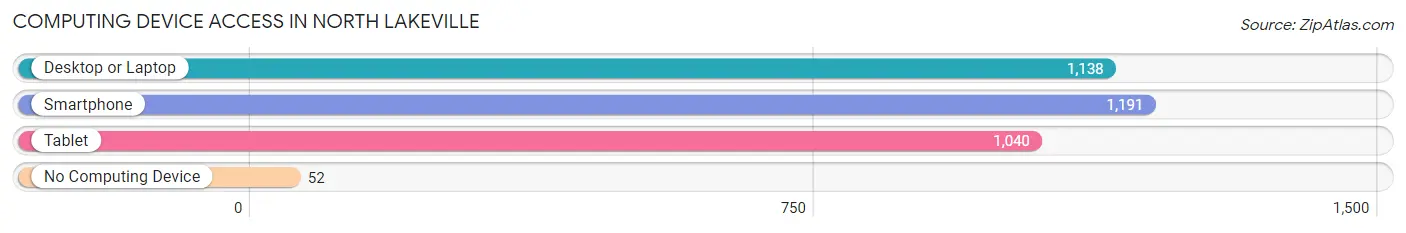
| Device Type | # Households | % Households |
| Desktop or Laptop | 1,138 | 83.9% |
| Smartphone | 1,191 | 87.8% |
| Tablet | 1,040 | 76.6% |
| No Computing Device | 52 | 3.8% |
| Total | 1,357 | 100.0% |
Internet Access in North Lakeville
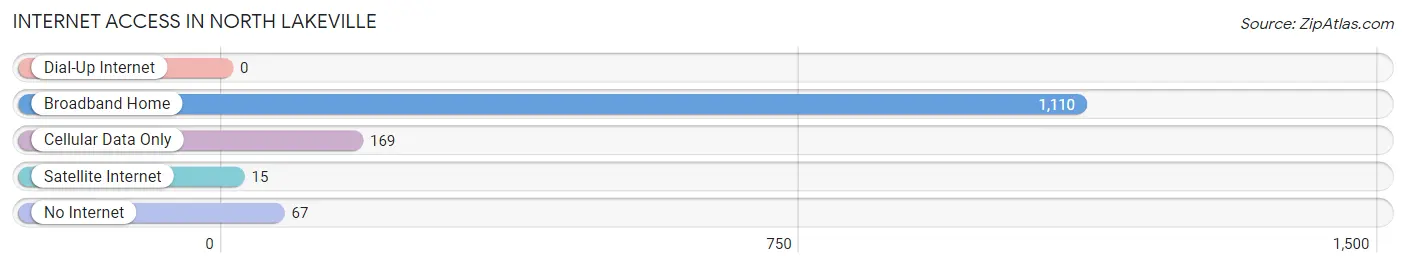
| Internet Type | # Households | % Households |
| Dial-Up Internet | 0 | 0.0% |
| Broadband Home | 1,110 | 81.8% |
| Cellular Data Only | 169 | 12.4% |
| Satellite Internet | 15 | 1.1% |
| No Internet | 67 | 4.9% |
| Total | 1,357 | 100.0% |
North Lakeville Summary
Lakeville, MA is a small town located in Plymouth County, Massachusetts. It is situated on the eastern shore of the Taunton River, approximately 25 miles south of Boston. The town was originally part of Freetown, which was incorporated in 1659. In 1853, the town of Lakeville was incorporated from parts of Freetown and Middleborough.
Geography
Lakeville is located in southeastern Massachusetts, approximately 25 miles south of Boston. It is bordered by the towns of Middleborough to the north, Freetown to the east, Rochester to the south, and Bridgewater to the west. The town is situated on the eastern shore of the Taunton River, which forms the town’s northern border. The town is mostly rural, with a few small villages scattered throughout. The highest point in the town is the summit of Great Hill, which is located in the northern part of town and rises to an elevation of 441 feet.
The town is home to several bodies of water, including Long Pond, Assawompset Pond, and Great Quittacas Pond. The town also contains several small streams, including the Assawompset Brook, the Great Quittacas Brook, and the Taunton River.
Economy
The economy of Lakeville is largely based on agriculture and tourism. The town is home to several farms, which produce a variety of crops, including corn, hay, and vegetables. The town is also home to several wineries, which produce a variety of wines.
Tourism is also an important part of the town’s economy. The town is home to several popular attractions, including the Lakeville Historical Society, the Lakeville Arts Center, and the Lakeville Country Club. The town is also home to several parks, including the Assawompset Pond State Reservation and the Great Quittacas Pond State Reservation.
Demographics
As of the 2010 census, the town of Lakeville had a population of 10,602. The racial makeup of the town was 94.3% White, 1.7% African American, 0.3% Native American, 1.2% Asian, 0.1% Pacific Islander, 1.2% from other races, and 1.4% from two or more races. Hispanic or Latino of any race were 2.7% of the population.
The median household income in the town was $76,845, and the median family income was $86,945. The per capita income for the town was $31,945. About 4.3% of families and 5.7% of the population were below the poverty line, including 6.3% of those under age 18 and 4.2% of those age 65 or over.
Conclusion
Lakeville, MA is a small town located in Plymouth County, Massachusetts. It is situated on the eastern shore of the Taunton River, approximately 25 miles south of Boston. The town was originally part of Freetown, which was incorporated in 1659. The town’s economy is largely based on agriculture and tourism, and the town is home to several popular attractions. As of the 2010 census, the town had a population of 10,602, with a median household income of $76,845.
Common Questions
What is the Total Population of North Lakeville?
Total Population of North Lakeville is 3,635.
What is the Total Male Population of North Lakeville?
Total Male Population of North Lakeville is 1,718.
What is the Total Female Population of North Lakeville?
Total Female Population of North Lakeville is 1,917.
What is the Ratio of Males per 100 Females in North Lakeville?
There are 89.62 Males per 100 Females in North Lakeville.
What is the Ratio of Females per 100 Males in North Lakeville?
There are 111.58 Females per 100 Males in North Lakeville.
What is the Median Population Age in North Lakeville?
Median Population Age in North Lakeville is 36.3 Years.
What is the Average Family Size in North Lakeville
Average Family Size in North Lakeville is 3.0 People.
What is the Average Household Size in North Lakeville
Average Household Size in North Lakeville is 2.7 People.
What is Per Capita Income in North Lakeville?
Per Capita income in North Lakeville is $40,036.
What is the Median Family Income in North Lakeville?
Median Family Income in North Lakeville is $97,545.
What is the Median Household income in North Lakeville?
Median Household Income in North Lakeville is $85,123.
What is Income or Wage Gap in North Lakeville?
Income or Wage Gap in North Lakeville is 34.7%.
Women in North Lakeville earn 65.3 cents for every dollar earned by a man.
What is Inequality or Gini Index in North Lakeville?
Inequality or Gini Index in North Lakeville is 0.42.
How Large is the Labor Force in North Lakeville?
There are 1,949 People in the Labor Forcein in North Lakeville.
What is the Percentage of People in the Labor Force in North Lakeville?
68.1% of People are in the Labor Force in North Lakeville.
What is the Unemployment Rate in North Lakeville?
Unemployment Rate in North Lakeville is 3.2%.