Cities with the Highest Percentage of Immigrants from Southern Europe in Virginia
RELATED REPORTS & OPTIONS
Southern Europe
Virginia
Compare Cities
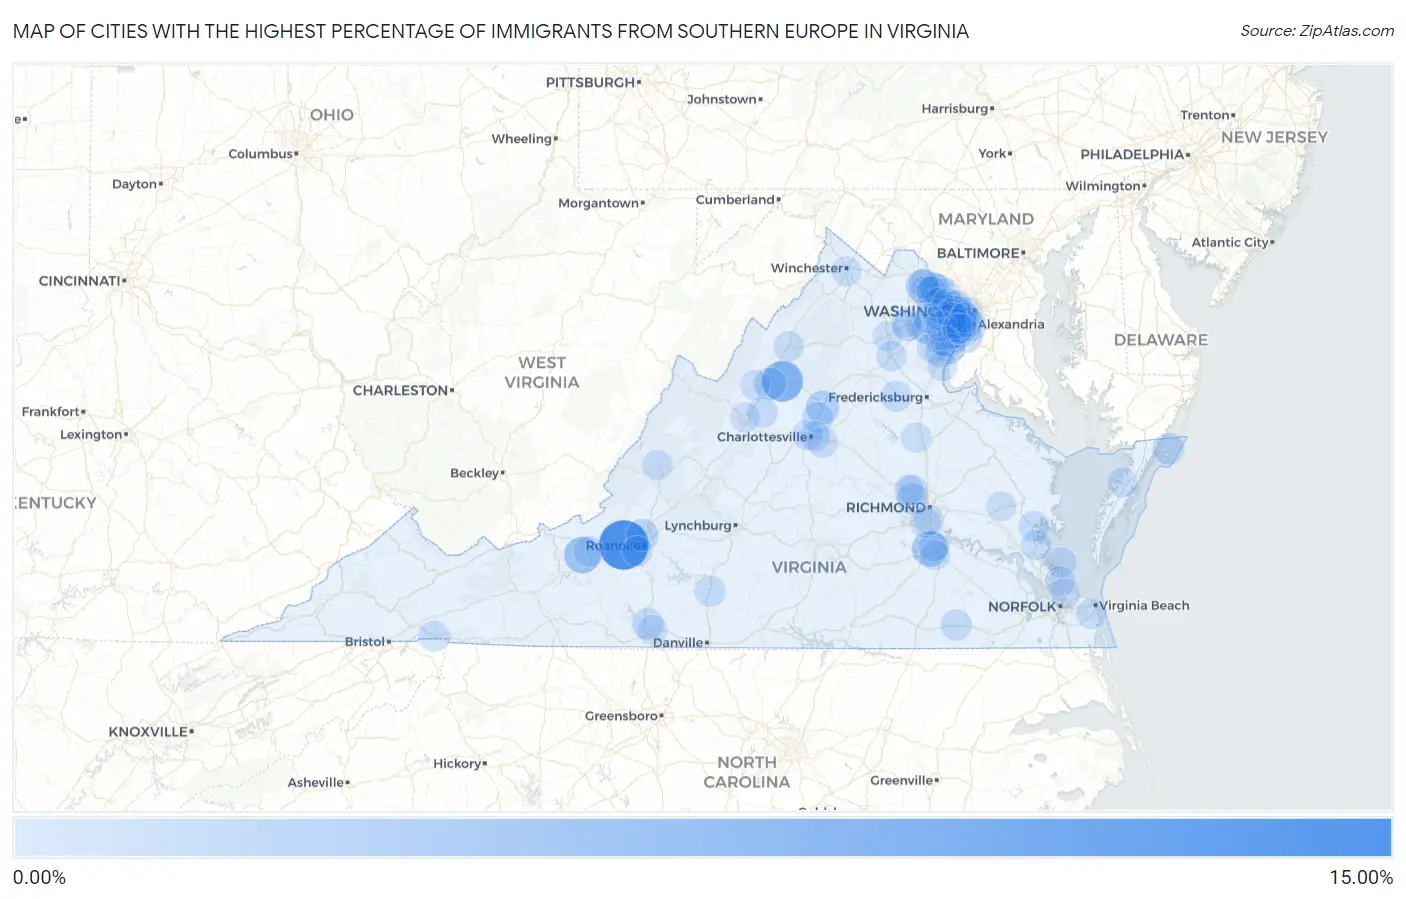
Map of Cities with the Highest Percentage of Immigrants from Southern Europe in Virginia
0.00%
15.00%
Cities with the Highest Percentage of Immigrants from Southern Europe in Virginia
| City | Southern Europe | vs State | vs National | |
| 1. | Glenvar | 10.19% | 0.16%(+10.0)#1 | 0.22%(+9.97)#19 |
| 2. | Camp Barrett | 6.18% | 0.16%(+6.02)#2 | 0.22%(+5.96)#54 |
| 3. | Massanutten | 5.57% | 0.16%(+5.42)#3 | 0.22%(+5.35)#64 |
| 4. | Prices Fork | 3.45% | 0.16%(+3.29)#4 | 0.22%(+3.23)#115 |
| 5. | Ettrick | 2.98% | 0.16%(+2.82)#5 | 0.22%(+2.76)#158 |
| 6. | Ruckersville | 1.88% | 0.16%(+1.72)#6 | 0.22%(+1.66)#314 |
| 7. | Belmont | 1.76% | 0.16%(+1.60)#7 | 0.22%(+1.54)#350 |
| 8. | Vienna | 1.29% | 0.16%(+1.13)#8 | 0.22%(+1.07)#548 |
| 9. | Hollins | 1.26% | 0.16%(+1.10)#9 | 0.22%(+1.04)#559 |
| 10. | Massanetta Springs | 1.22% | 0.16%(+1.06)#10 | 0.22%(+0.995)#586 |
| 11. | Kings Park | 1.10% | 0.16%(+0.940)#11 | 0.22%(+0.879)#684 |
| 12. | Difficult Run | 0.92% | 0.16%(+0.761)#12 | 0.22%(+0.700)#862 |
| 13. | Sudley | 0.92% | 0.16%(+0.758)#13 | 0.22%(+0.698)#868 |
| 14. | Tysons | 0.92% | 0.16%(+0.757)#14 | 0.22%(+0.696)#870 |
| 15. | Chincoteague | 0.91% | 0.16%(+0.749)#15 | 0.22%(+0.688)#879 |
| 16. | Collinsville | 0.88% | 0.16%(+0.718)#16 | 0.22%(+0.657)#915 |
| 17. | Tuckahoe | 0.82% | 0.16%(+0.657)#17 | 0.22%(+0.596)#981 |
| 18. | Union Mill | 0.81% | 0.16%(+0.654)#18 | 0.22%(+0.594)#984 |
| 19. | Manassas Park | 0.77% | 0.16%(+0.606)#19 | 0.22%(+0.545)#1,056 |
| 20. | Capron | 0.76% | 0.16%(+0.598)#20 | 0.22%(+0.538)#1,062 |
| 21. | Hayfield | 0.75% | 0.16%(+0.593)#21 | 0.22%(+0.532)#1,065 |
| 22. | Lowes Island | 0.68% | 0.16%(+0.524)#22 | 0.22%(+0.463)#1,216 |
| 23. | Occoquan | 0.65% | 0.16%(+0.494)#23 | 0.22%(+0.433)#1,296 |
| 24. | Gretna | 0.65% | 0.16%(+0.493)#24 | 0.22%(+0.432)#1,300 |
| 25. | Countryside | 0.63% | 0.16%(+0.473)#25 | 0.22%(+0.412)#1,342 |
| 26. | Piney Mountain | 0.62% | 0.16%(+0.462)#26 | 0.22%(+0.401)#1,367 |
| 27. | Dunn Loring | 0.57% | 0.16%(+0.415)#27 | 0.22%(+0.354)#1,468 |
| 28. | Fairfax | 0.56% | 0.16%(+0.402)#28 | 0.22%(+0.341)#1,510 |
| 29. | Leesylvania | 0.56% | 0.16%(+0.397)#29 | 0.22%(+0.336)#1,525 |
| 30. | Lake Wilderness | 0.54% | 0.16%(+0.385)#30 | 0.22%(+0.324)#1,556 |
| 31. | Gloucester Courthouse | 0.54% | 0.16%(+0.382)#31 | 0.22%(+0.321)#1,570 |
| 32. | Damascus | 0.52% | 0.16%(+0.362)#32 | 0.22%(+0.301)#1,612 |
| 33. | Floris | 0.51% | 0.16%(+0.353)#33 | 0.22%(+0.292)#1,641 |
| 34. | Oakton | 0.49% | 0.16%(+0.331)#34 | 0.22%(+0.270)#1,702 |
| 35. | Ashburn | 0.48% | 0.16%(+0.325)#35 | 0.22%(+0.264)#1,731 |
| 36. | Rose Hill Cdp Fairfax County | 0.48% | 0.16%(+0.322)#36 | 0.22%(+0.261)#1,738 |
| 37. | Great Falls | 0.48% | 0.16%(+0.322)#37 | 0.22%(+0.261)#1,739 |
| 38. | Falls Church | 0.48% | 0.16%(+0.321)#38 | 0.22%(+0.260)#1,744 |
| 39. | Innsbrook | 0.47% | 0.16%(+0.312)#39 | 0.22%(+0.251)#1,771 |
| 40. | Idylwood | 0.46% | 0.16%(+0.302)#40 | 0.22%(+0.241)#1,801 |
| 41. | Lincolnia | 0.46% | 0.16%(+0.300)#41 | 0.22%(+0.239)#1,808 |
| 42. | Arlington | 0.45% | 0.16%(+0.291)#42 | 0.22%(+0.230)#1,834 |
| 43. | Cascades | 0.45% | 0.16%(+0.287)#43 | 0.22%(+0.226)#1,849 |
| 44. | Independent Hill | 0.44% | 0.16%(+0.277)#44 | 0.22%(+0.216)#1,884 |
| 45. | New Hope | 0.43% | 0.16%(+0.272)#45 | 0.22%(+0.211)#1,904 |
| 46. | Blacksburg | 0.39% | 0.16%(+0.233)#46 | 0.22%(+0.172)#2,047 |
| 47. | County Center | 0.37% | 0.16%(+0.214)#47 | 0.22%(+0.153)#2,138 |
| 48. | Mount Vernon | 0.35% | 0.16%(+0.194)#48 | 0.22%(+0.133)#2,228 |
| 49. | Annandale | 0.35% | 0.16%(+0.193)#49 | 0.22%(+0.132)#2,242 |
| 50. | Fair Oaks | 0.34% | 0.16%(+0.180)#50 | 0.22%(+0.119)#2,296 |
| 51. | Wolf Trap | 0.34% | 0.16%(+0.178)#51 | 0.22%(+0.117)#2,307 |
| 52. | Rivanna | 0.34% | 0.16%(+0.176)#52 | 0.22%(+0.115)#2,315 |
| 53. | Woodbridge | 0.33% | 0.16%(+0.172)#53 | 0.22%(+0.111)#2,343 |
| 54. | Seven Corners | 0.32% | 0.16%(+0.158)#54 | 0.22%(+0.097)#2,412 |
| 55. | Mclean | 0.32% | 0.16%(+0.157)#55 | 0.22%(+0.097)#2,416 |
| 56. | Poquoson | 0.31% | 0.16%(+0.153)#56 | 0.22%(+0.092)#2,430 |
| 57. | University Of Virginia | 0.31% | 0.16%(+0.152)#57 | 0.22%(+0.091)#2,436 |
| 58. | Pantops | 0.31% | 0.16%(+0.151)#58 | 0.22%(+0.090)#2,442 |
| 59. | Cave Spring | 0.30% | 0.16%(+0.145)#59 | 0.22%(+0.084)#2,484 |
| 60. | Newington | 0.30% | 0.16%(+0.143)#60 | 0.22%(+0.082)#2,491 |
| 61. | West Springfield | 0.28% | 0.16%(+0.123)#61 | 0.22%(+0.062)#2,593 |
| 62. | Colonial Heights | 0.28% | 0.16%(+0.122)#62 | 0.22%(+0.061)#2,601 |
| 63. | Huntington | 0.28% | 0.16%(+0.121)#63 | 0.22%(+0.060)#2,604 |
| 64. | Meadowbrook | 0.28% | 0.16%(+0.120)#64 | 0.22%(+0.059)#2,614 |
| 65. | New Market | 0.28% | 0.16%(+0.118)#65 | 0.22%(+0.057)#2,625 |
| 66. | Newington Forest | 0.28% | 0.16%(+0.118)#66 | 0.22%(+0.057)#2,630 |
| 67. | Alexandria | 0.27% | 0.16%(+0.116)#67 | 0.22%(+0.055)#2,639 |
| 68. | North Springfield | 0.27% | 0.16%(+0.116)#68 | 0.22%(+0.055)#2,640 |
| 69. | Merrifield | 0.27% | 0.16%(+0.112)#69 | 0.22%(+0.051)#2,679 |
| 70. | Montclair | 0.26% | 0.16%(+0.104)#70 | 0.22%(+0.043)#2,729 |
| 71. | Bealeton | 0.26% | 0.16%(+0.098)#71 | 0.22%(+0.037)#2,779 |
| 72. | Virginia Beach | 0.26% | 0.16%(+0.096)#72 | 0.22%(+0.035)#2,787 |
| 73. | Gloucester Point | 0.25% | 0.16%(+0.095)#73 | 0.22%(+0.034)#2,792 |
| 74. | Clifton Forge | 0.25% | 0.16%(+0.095)#74 | 0.22%(+0.034)#2,794 |
| 75. | Woodburn | 0.25% | 0.16%(+0.092)#75 | 0.22%(+0.031)#2,821 |
| 76. | Bensley | 0.25% | 0.16%(+0.090)#76 | 0.22%(+0.029)#2,832 |
| 77. | Staunton | 0.25% | 0.16%(+0.087)#77 | 0.22%(+0.026)#2,849 |
| 78. | Fairfax Station | 0.24% | 0.16%(+0.077)#78 | 0.22%(+0.016)#2,910 |
| 79. | Lake Ridge | 0.23% | 0.16%(+0.076)#79 | 0.22%(+0.015)#2,920 |
| 80. | Springfield | 0.23% | 0.16%(+0.073)#80 | 0.22%(+0.012)#2,945 |
| 81. | Winchester | 0.23% | 0.16%(+0.072)#81 | 0.22%(+0.011)#2,954 |
| 82. | Lake Land Or | 0.22% | 0.16%(+0.061)#82 | 0.22%(+0.000)#3,019 |
| 83. | Lansdowne | 0.22% | 0.16%(+0.059)#83 | 0.22%(-0.002)#3,035 |
| 84. | Bailey S Crossroads | 0.21% | 0.16%(+0.051)#84 | 0.22%(-0.010)#3,100 |
| 85. | Onancock | 0.21% | 0.16%(+0.050)#85 | 0.22%(-0.011)#3,112 |
| 86. | Petersburg | 0.21% | 0.16%(+0.048)#86 | 0.22%(-0.013)#3,129 |
| 87. | West Point | 0.21% | 0.16%(+0.047)#87 | 0.22%(-0.014)#3,140 |
| 88. | Bridgewater | 0.20% | 0.16%(+0.039)#88 | 0.22%(-0.022)#3,211 |
| 89. | Reston | 0.20% | 0.16%(+0.037)#89 | 0.22%(-0.024)#3,232 |
| 90. | Haymarket | 0.19% | 0.16%(+0.032)#90 | 0.22%(-0.029)#3,277 |
| 91. | Warrenton | 0.19% | 0.16%(+0.029)#91 | 0.22%(-0.032)#3,301 |
| 92. | Short Pump | 0.19% | 0.16%(+0.027)#92 | 0.22%(-0.033)#3,312 |
| 93. | Quantico Base | 0.19% | 0.16%(+0.027)#93 | 0.22%(-0.034)#3,316 |
| 94. | Centreville | 0.19% | 0.16%(+0.027)#94 | 0.22%(-0.034)#3,321 |
| 95. | Norfolk | 0.18% | 0.16%(+0.018)#95 | 0.22%(-0.043)#3,403 |
| 96. | Gainesville | 0.18% | 0.16%(+0.018)#96 | 0.22%(-0.043)#3,405 |
| 97. | Dulles Town Center | 0.17% | 0.16%(+0.011)#97 | 0.22%(-0.050)#3,459 |
| 98. | Hampton | 0.17% | 0.16%(+0.010)#98 | 0.22%(-0.051)#3,468 |
| 99. | Franconia | 0.17% | 0.16%(+0.008)#99 | 0.22%(-0.053)#3,485 |
| 100. | Martinsville | 0.16% | 0.16%(+0.003)#100 | 0.22%(-0.058)#3,524 |
Common Questions
What are the Top 10 Cities with the Highest Percentage of Immigrants from Southern Europe in Virginia?
Top 10 Cities with the Highest Percentage of Immigrants from Southern Europe in Virginia are:
#1
10.19%
#2
5.57%
#3
3.45%
#4
2.98%
#5
1.88%
#6
1.76%
#7
1.29%
#8
1.26%
#9
1.22%
#10
1.10%
What city has the Highest Percentage of Immigrants from Southern Europe in Virginia?
Glenvar has the Highest Percentage of Immigrants from Southern Europe in Virginia with 10.19%.
What is the Percentage of Immigrants from Southern Europe in the State of Virginia?
Percentage of Immigrants from Southern Europe in Virginia is 0.16%.
What is the Percentage of Immigrants from Southern Europe in the United States?
Percentage of Immigrants from Southern Europe in the United States is 0.22%.