Cities with the Highest Percentage of Immigrants from Southern Europe in Indiana
RELATED REPORTS & OPTIONS
Southern Europe
Indiana
Compare Cities
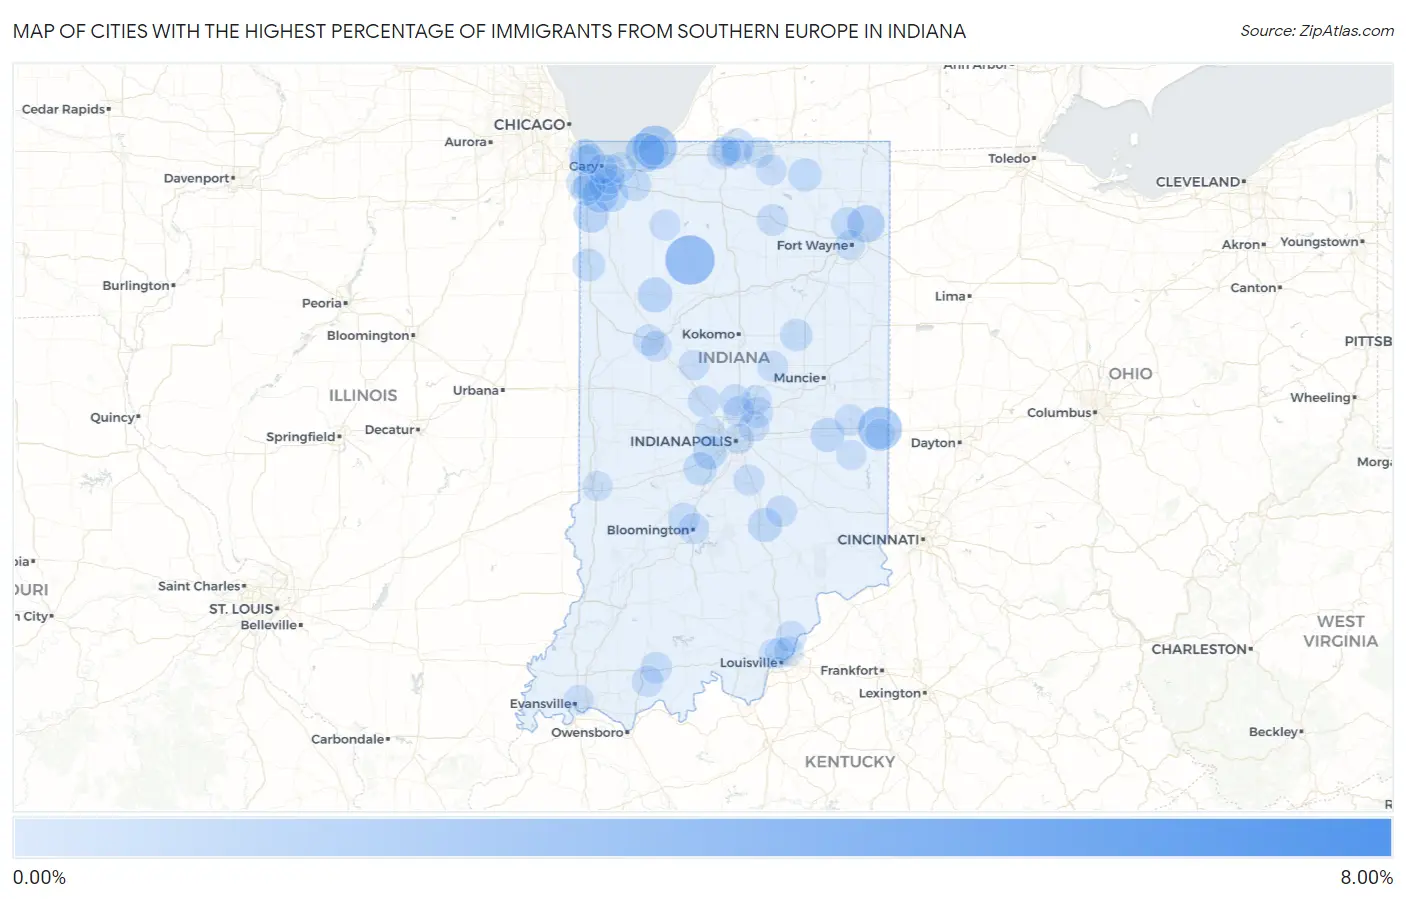
Map of Cities with the Highest Percentage of Immigrants from Southern Europe in Indiana
0.00%
8.00%
Cities with the Highest Percentage of Immigrants from Southern Europe in Indiana
| City | Southern Europe | vs State | vs National | |
| 1. | Ontario | 6.54% | 0.061%(+6.48)#1 | 0.22%(+6.32)#50 |
| 2. | Star City | 2.65% | 0.061%(+2.59)#2 | 0.22%(+2.43)#188 |
| 3. | Pottawattamie Park | 1.89% | 0.061%(+1.83)#3 | 0.22%(+1.67)#308 |
| 4. | Spring Grove | 1.87% | 0.061%(+1.81)#4 | 0.22%(+1.65)#316 |
| 5. | Town Of Pines | 1.23% | 0.061%(+1.17)#5 | 0.22%(+1.01)#577 |
| 6. | Leo Cedarville | 0.96% | 0.061%(+0.898)#6 | 0.22%(+0.739)#822 |
| 7. | Lowell | 0.72% | 0.061%(+0.657)#7 | 0.22%(+0.498)#1,139 |
| 8. | Crown Point | 0.71% | 0.061%(+0.650)#8 | 0.22%(+0.491)#1,156 |
| 9. | Reynolds | 0.65% | 0.061%(+0.590)#9 | 0.22%(+0.431)#1,301 |
| 10. | Columbus | 0.58% | 0.061%(+0.518)#10 | 0.22%(+0.360)#1,460 |
| 11. | Lewisville | 0.54% | 0.061%(+0.484)#11 | 0.22%(+0.325)#1,555 |
| 12. | Winfield | 0.53% | 0.061%(+0.465)#12 | 0.22%(+0.306)#1,599 |
| 13. | Plainfield | 0.50% | 0.061%(+0.438)#13 | 0.22%(+0.279)#1,674 |
| 14. | Monrovia | 0.44% | 0.061%(+0.383)#14 | 0.22%(+0.225)#1,861 |
| 15. | Topeka | 0.44% | 0.061%(+0.380)#15 | 0.22%(+0.222)#1,873 |
| 16. | Granger | 0.42% | 0.061%(+0.358)#16 | 0.22%(+0.200)#1,944 |
| 17. | Huntertown | 0.40% | 0.061%(+0.335)#17 | 0.22%(+0.176)#2,024 |
| 18. | Morocco | 0.36% | 0.061%(+0.300)#18 | 0.22%(+0.141)#2,184 |
| 19. | Merrillville | 0.35% | 0.061%(+0.292)#19 | 0.22%(+0.133)#2,226 |
| 20. | Jonesboro | 0.32% | 0.061%(+0.263)#20 | 0.22%(+0.104)#2,375 |
| 21. | Dyer | 0.32% | 0.061%(+0.262)#21 | 0.22%(+0.103)#2,385 |
| 22. | Valparaiso | 0.29% | 0.061%(+0.224)#22 | 0.22%(+0.065)#2,575 |
| 23. | Whiting | 0.28% | 0.061%(+0.223)#23 | 0.22%(+0.064)#2,585 |
| 24. | Ellettsville | 0.26% | 0.061%(+0.194)#24 | 0.22%(+0.035)#2,784 |
| 25. | Schererville | 0.25% | 0.061%(+0.186)#25 | 0.22%(+0.027)#2,844 |
| 26. | Hope | 0.21% | 0.061%(+0.149)#26 | 0.22%(-0.010)#3,096 |
| 27. | Lebanon | 0.21% | 0.061%(+0.147)#27 | 0.22%(-0.012)#3,120 |
| 28. | Ferdinand | 0.21% | 0.061%(+0.145)#28 | 0.22%(-0.014)#3,143 |
| 29. | Westfield | 0.21% | 0.061%(+0.144)#29 | 0.22%(-0.015)#3,150 |
| 30. | Warsaw | 0.19% | 0.061%(+0.133)#30 | 0.22%(-0.026)#3,243 |
| 31. | West Lafayette | 0.19% | 0.061%(+0.124)#31 | 0.22%(-0.035)#3,330 |
| 32. | St John | 0.18% | 0.061%(+0.122)#32 | 0.22%(-0.037)#3,341 |
| 33. | Santa Claus | 0.18% | 0.061%(+0.121)#33 | 0.22%(-0.038)#3,351 |
| 34. | Bloomington | 0.16% | 0.061%(+0.094)#34 | 0.22%(-0.064)#3,585 |
| 35. | Hagerstown | 0.16% | 0.061%(+0.094)#35 | 0.22%(-0.065)#3,590 |
| 36. | North Judson | 0.14% | 0.061%(+0.082)#36 | 0.22%(-0.077)#3,706 |
| 37. | Charlestown | 0.14% | 0.061%(+0.076)#37 | 0.22%(-0.082)#3,760 |
| 38. | South Bend | 0.14% | 0.061%(+0.074)#38 | 0.22%(-0.084)#3,781 |
| 39. | Fishers | 0.13% | 0.061%(+0.070)#39 | 0.22%(-0.089)#3,830 |
| 40. | Franklin | 0.13% | 0.061%(+0.069)#40 | 0.22%(-0.090)#3,841 |
| 41. | Lake Station | 0.13% | 0.061%(+0.066)#41 | 0.22%(-0.093)#3,874 |
| 42. | Elwood | 0.12% | 0.061%(+0.059)#42 | 0.22%(-0.100)#3,972 |
| 43. | Lafayette | 0.12% | 0.061%(+0.057)#43 | 0.22%(-0.101)#3,991 |
| 44. | Lawrence | 0.10% | 0.061%(+0.040)#44 | 0.22%(-0.118)#4,172 |
| 45. | Mishawaka | 0.094% | 0.061%(+0.033)#45 | 0.22%(-0.126)#4,258 |
| 46. | Carmel | 0.086% | 0.061%(+0.025)#46 | 0.22%(-0.134)#4,356 |
| 47. | Frankfort | 0.069% | 0.061%(+0.008)#47 | 0.22%(-0.151)#4,579 |
| 48. | Michigan City | 0.063% | 0.061%(+0.001)#48 | 0.22%(-0.158)#4,647 |
| 49. | Indianapolis | 0.058% | 0.061%(-0.003)#49 | 0.22%(-0.162)#4,706 |
| 50. | Goshen | 0.058% | 0.061%(-0.004)#50 | 0.22%(-0.162)#4,719 |
| 51. | Portage | 0.050% | 0.061%(-0.011)#51 | 0.22%(-0.170)#4,796 |
| 52. | Elkhart | 0.050% | 0.061%(-0.011)#52 | 0.22%(-0.170)#4,799 |
| 53. | Hobart | 0.044% | 0.061%(-0.017)#53 | 0.22%(-0.176)#4,879 |
| 54. | New Albany | 0.040% | 0.061%(-0.021)#54 | 0.22%(-0.180)#4,919 |
| 55. | Fort Wayne | 0.040% | 0.061%(-0.022)#55 | 0.22%(-0.180)#4,921 |
| 56. | Brownsburg | 0.031% | 0.061%(-0.031)#56 | 0.22%(-0.189)#5,032 |
| 57. | Connersville | 0.030% | 0.061%(-0.031)#57 | 0.22%(-0.190)#5,044 |
| 58. | Clarksville | 0.027% | 0.061%(-0.034)#58 | 0.22%(-0.193)#5,078 |
| 59. | Hammond | 0.021% | 0.061%(-0.041)#59 | 0.22%(-0.199)#5,155 |
| 60. | Noblesville | 0.020% | 0.061%(-0.041)#60 | 0.22%(-0.200)#5,166 |
| 61. | East Chicago | 0.019% | 0.061%(-0.042)#61 | 0.22%(-0.201)#5,177 |
| 62. | Terre Haute | 0.017% | 0.061%(-0.044)#62 | 0.22%(-0.203)#5,202 |
| 63. | Richmond | 0.017% | 0.061%(-0.044)#63 | 0.22%(-0.203)#5,204 |
| 64. | Jeffersonville | 0.016% | 0.061%(-0.045)#64 | 0.22%(-0.204)#5,209 |
| 65. | Notre Dame | 0.015% | 0.061%(-0.046)#65 | 0.22%(-0.205)#5,213 |
| 66. | Gary | 0.010% | 0.061%(-0.051)#66 | 0.22%(-0.210)#5,256 |
| 67. | Evansville | 0.0068% | 0.061%(-0.054)#67 | 0.22%(-0.213)#5,285 |
Common Questions
What are the Top 10 Cities with the Highest Percentage of Immigrants from Southern Europe in Indiana?
Top 10 Cities with the Highest Percentage of Immigrants from Southern Europe in Indiana are:
#1
2.65%
#2
1.89%
#3
1.87%
#4
1.23%
#5
0.96%
#6
0.72%
#7
0.71%
#8
0.65%
#9
0.58%
#10
0.54%
What city has the Highest Percentage of Immigrants from Southern Europe in Indiana?
Star City has the Highest Percentage of Immigrants from Southern Europe in Indiana with 2.65%.
What is the Percentage of Immigrants from Southern Europe in the State of Indiana?
Percentage of Immigrants from Southern Europe in Indiana is 0.061%.
What is the Percentage of Immigrants from Southern Europe in the United States?
Percentage of Immigrants from Southern Europe in the United States is 0.22%.