Cities with the Highest Percentage of Immigrants from Southern Europe in Pennsylvania
RELATED REPORTS & OPTIONS
Southern Europe
Pennsylvania
Compare Cities
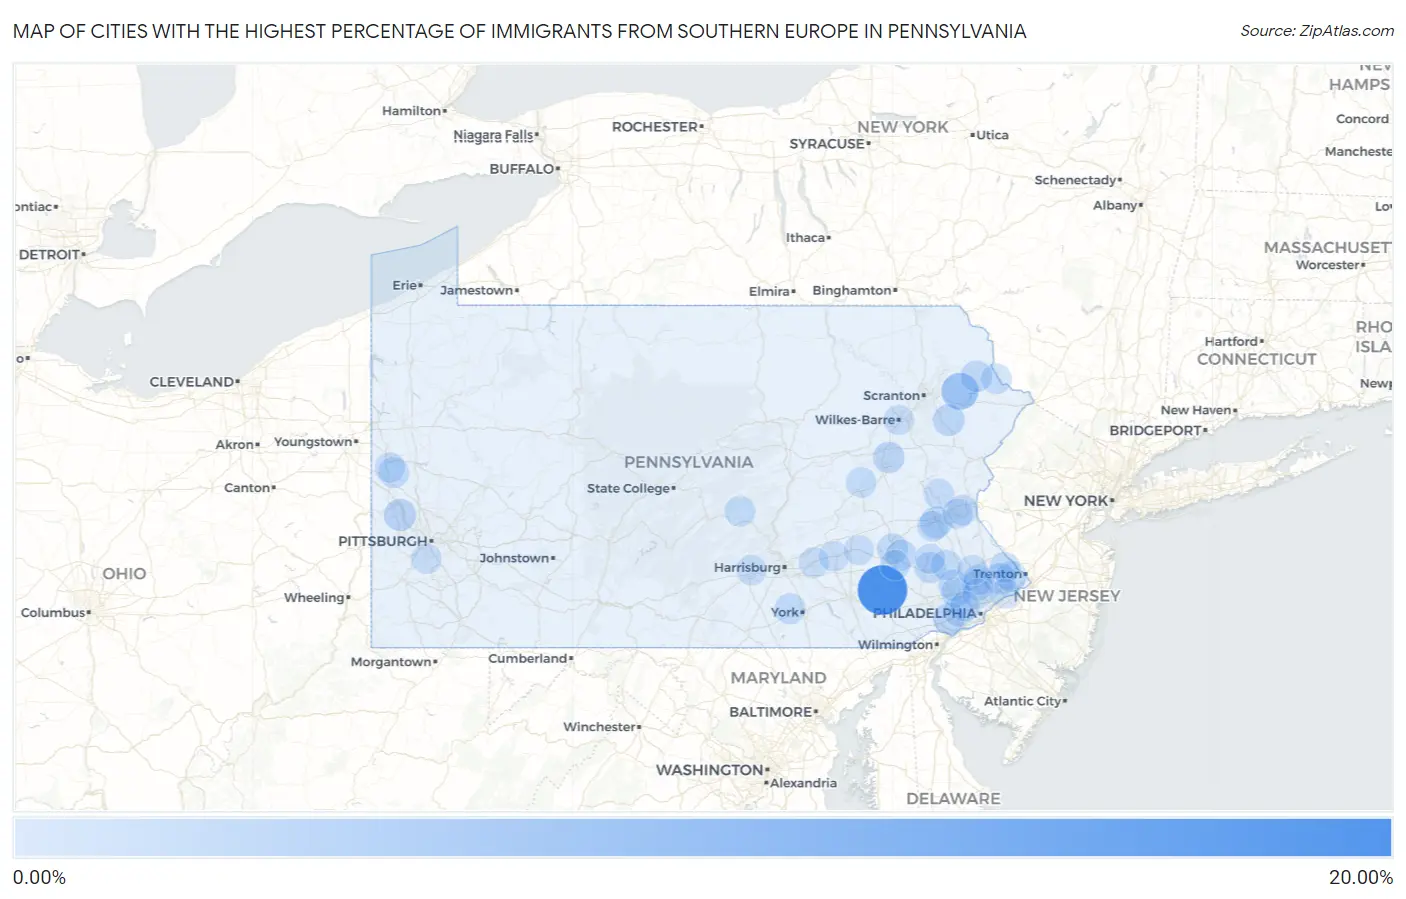
Map of Cities with the Highest Percentage of Immigrants from Southern Europe in Pennsylvania
0.00%
20.00%
Cities with the Highest Percentage of Immigrants from Southern Europe in Pennsylvania
| City | Southern Europe | vs State | vs National | |
| 1. | East Earl | 19.58% | 0.22%(+19.4)#1 | 0.22%(+19.4)#4 |
| 2. | Le Raysville Borough | 13.84% | 0.22%(+13.6)#2 | 0.22%(+13.6)#8 |
| 3. | The Hideout | 6.86% | 0.22%(+6.65)#3 | 0.22%(+6.64)#44 |
| 4. | Aliquippa | 2.46% | 0.22%(+2.24)#4 | 0.22%(+2.24)#213 |
| 5. | New Ringgold Borough | 2.39% | 0.22%(+2.17)#5 | 0.22%(+2.17)#220 |
| 6. | Wescosville | 2.37% | 0.22%(+2.15)#6 | 0.22%(+2.15)#224 |
| 7. | Tionesta Borough | 2.23% | 0.22%(+2.02)#7 | 0.22%(+2.01)#247 |
| 8. | Sharpsville Borough | 2.12% | 0.22%(+1.90)#8 | 0.22%(+1.90)#265 |
| 9. | New Philadelphia Borough | 2.09% | 0.22%(+1.87)#9 | 0.22%(+1.87)#270 |
| 10. | Gouldsboro | 2.08% | 0.22%(+1.87)#10 | 0.22%(+1.86)#271 |
| 11. | Lima | 1.97% | 0.22%(+1.75)#11 | 0.22%(+1.75)#291 |
| 12. | Lake City Borough | 1.88% | 0.22%(+1.66)#12 | 0.22%(+1.66)#315 |
| 13. | Churchville | 1.85% | 0.22%(+1.64)#13 | 0.22%(+1.63)#319 |
| 14. | Pardeesville | 1.82% | 0.22%(+1.60)#14 | 0.22%(+1.60)#330 |
| 15. | Sutersville Borough | 1.80% | 0.22%(+1.58)#15 | 0.22%(+1.58)#336 |
| 16. | White Mills | 1.74% | 0.22%(+1.53)#16 | 0.22%(+1.52)#355 |
| 17. | Bridgeport Borough | 1.74% | 0.22%(+1.52)#17 | 0.22%(+1.52)#356 |
| 18. | Fredericksburg Cdp Crawford County | 1.64% | 0.22%(+1.42)#18 | 0.22%(+1.42)#386 |
| 19. | Pottsgrove | 1.61% | 0.22%(+1.40)#19 | 0.22%(+1.39)#392 |
| 20. | Narberth Borough | 1.61% | 0.22%(+1.39)#20 | 0.22%(+1.39)#394 |
| 21. | New Hope Borough | 1.41% | 0.22%(+1.19)#21 | 0.22%(+1.19)#468 |
| 22. | Brookhaven Borough | 1.37% | 0.22%(+1.15)#22 | 0.22%(+1.15)#495 |
| 23. | Green Tree Borough | 1.36% | 0.22%(+1.14)#23 | 0.22%(+1.14)#502 |
| 24. | Stroudsburg Borough | 1.32% | 0.22%(+1.11)#24 | 0.22%(+1.10)#524 |
| 25. | Weigelstown | 1.28% | 0.22%(+1.06)#25 | 0.22%(+1.06)#552 |
| 26. | Trooper | 1.27% | 0.22%(+1.06)#26 | 0.22%(+1.05)#555 |
| 27. | Fort Washington | 1.27% | 0.22%(+1.05)#27 | 0.22%(+1.05)#556 |
| 28. | West Conshohocken Borough | 1.25% | 0.22%(+1.04)#28 | 0.22%(+1.03)#563 |
| 29. | Chewton | 1.21% | 0.22%(+0.995)#29 | 0.22%(+0.992)#589 |
| 30. | Valley View Cdp Schuylkill County | 1.19% | 0.22%(+0.975)#30 | 0.22%(+0.973)#601 |
| 31. | Muhlenberg Park | 1.19% | 0.22%(+0.973)#31 | 0.22%(+0.970)#602 |
| 32. | Mount Jewett Borough | 1.18% | 0.22%(+0.964)#32 | 0.22%(+0.962)#613 |
| 33. | Stony Creek Mills | 1.16% | 0.22%(+0.938)#33 | 0.22%(+0.936)#632 |
| 34. | Woodbourne | 1.14% | 0.22%(+0.917)#34 | 0.22%(+0.915)#652 |
| 35. | Glen Osborne Borough | 1.13% | 0.22%(+0.909)#35 | 0.22%(+0.906)#660 |
| 36. | Mcalisterville | 1.12% | 0.22%(+0.900)#36 | 0.22%(+0.898)#668 |
| 37. | Ancient Oaks | 1.05% | 0.22%(+0.828)#37 | 0.22%(+0.826)#732 |
| 38. | Roseto Borough | 1.03% | 0.22%(+0.808)#38 | 0.22%(+0.806)#757 |
| 39. | East Bangor Borough | 1.01% | 0.22%(+0.793)#39 | 0.22%(+0.791)#768 |
| 40. | Masthope | 1.01% | 0.22%(+0.787)#40 | 0.22%(+0.785)#775 |
| 41. | Eagleville Cdp Montgomery County | 0.99% | 0.22%(+0.770)#41 | 0.22%(+0.768)#795 |
| 42. | Lansdale Borough | 0.98% | 0.22%(+0.765)#42 | 0.22%(+0.762)#798 |
| 43. | Cheltenham | 0.97% | 0.22%(+0.756)#43 | 0.22%(+0.753)#808 |
| 44. | Little Meadows Borough | 0.97% | 0.22%(+0.753)#44 | 0.22%(+0.751)#811 |
| 45. | Loganton Borough | 0.95% | 0.22%(+0.735)#45 | 0.22%(+0.732)#828 |
| 46. | Shenandoah Heights | 0.94% | 0.22%(+0.722)#46 | 0.22%(+0.720)#841 |
| 47. | Middletown | 0.94% | 0.22%(+0.721)#47 | 0.22%(+0.719)#843 |
| 48. | Luzerne Borough | 0.92% | 0.22%(+0.702)#48 | 0.22%(+0.700)#863 |
| 49. | Verona Borough | 0.91% | 0.22%(+0.695)#49 | 0.22%(+0.693)#874 |
| 50. | Broomall | 0.91% | 0.22%(+0.692)#50 | 0.22%(+0.690)#877 |
| 51. | King Of Prussia | 0.90% | 0.22%(+0.679)#51 | 0.22%(+0.677)#894 |
| 52. | Coraopolis Borough | 0.89% | 0.22%(+0.672)#52 | 0.22%(+0.669)#902 |
| 53. | Newtown Grant | 0.87% | 0.22%(+0.654)#53 | 0.22%(+0.652)#918 |
| 54. | Denver Borough | 0.87% | 0.22%(+0.653)#54 | 0.22%(+0.651)#919 |
| 55. | Downingtown Borough | 0.87% | 0.22%(+0.648)#55 | 0.22%(+0.645)#924 |
| 56. | Aspinwall Borough | 0.83% | 0.22%(+0.613)#56 | 0.22%(+0.610)#955 |
| 57. | Spring Mount | 0.82% | 0.22%(+0.601)#57 | 0.22%(+0.598)#975 |
| 58. | Bath Borough | 0.82% | 0.22%(+0.600)#58 | 0.22%(+0.597)#977 |
| 59. | Cherryville | 0.82% | 0.22%(+0.598)#59 | 0.22%(+0.595)#982 |
| 60. | East Pittsburgh Borough | 0.80% | 0.22%(+0.586)#60 | 0.22%(+0.584)#996 |
| 61. | Palmdale | 0.77% | 0.22%(+0.550)#61 | 0.22%(+0.548)#1,054 |
| 62. | Sewickley Borough | 0.75% | 0.22%(+0.531)#62 | 0.22%(+0.529)#1,070 |
| 63. | Throop Borough | 0.74% | 0.22%(+0.521)#63 | 0.22%(+0.518)#1,095 |
| 64. | Maple Glen | 0.74% | 0.22%(+0.521)#64 | 0.22%(+0.518)#1,096 |
| 65. | Wyndmoor | 0.74% | 0.22%(+0.520)#65 | 0.22%(+0.517)#1,101 |
| 66. | Churchill Borough | 0.74% | 0.22%(+0.518)#66 | 0.22%(+0.515)#1,106 |
| 67. | Waymart Borough | 0.73% | 0.22%(+0.516)#67 | 0.22%(+0.514)#1,108 |
| 68. | Richlandtown Borough | 0.73% | 0.22%(+0.510)#68 | 0.22%(+0.508)#1,120 |
| 69. | West Pittsburg | 0.71% | 0.22%(+0.493)#69 | 0.22%(+0.491)#1,157 |
| 70. | Collingdale Borough | 0.70% | 0.22%(+0.482)#70 | 0.22%(+0.479)#1,189 |
| 71. | Flying Hills | 0.70% | 0.22%(+0.482)#71 | 0.22%(+0.479)#1,190 |
| 72. | Thompson Borough | 0.69% | 0.22%(+0.470)#72 | 0.22%(+0.467)#1,210 |
| 73. | Bethel Park | 0.69% | 0.22%(+0.468)#73 | 0.22%(+0.465)#1,214 |
| 74. | Dormont Borough | 0.68% | 0.22%(+0.465)#74 | 0.22%(+0.463)#1,217 |
| 75. | Mifflintown Borough | 0.68% | 0.22%(+0.460)#75 | 0.22%(+0.457)#1,233 |
| 76. | Clearfield Borough | 0.67% | 0.22%(+0.456)#76 | 0.22%(+0.454)#1,241 |
| 77. | Eddington | 0.67% | 0.22%(+0.449)#77 | 0.22%(+0.446)#1,255 |
| 78. | Houston Borough | 0.66% | 0.22%(+0.447)#78 | 0.22%(+0.444)#1,262 |
| 79. | Pleasant Hill | 0.64% | 0.22%(+0.426)#79 | 0.22%(+0.424)#1,318 |
| 80. | East Mckeesport Borough | 0.63% | 0.22%(+0.409)#80 | 0.22%(+0.407)#1,357 |
| 81. | Blakely Borough | 0.62% | 0.22%(+0.399)#81 | 0.22%(+0.397)#1,381 |
| 82. | Schlusser | 0.61% | 0.22%(+0.394)#82 | 0.22%(+0.391)#1,395 |
| 83. | Cambridge Springs Borough | 0.61% | 0.22%(+0.392)#83 | 0.22%(+0.389)#1,402 |
| 84. | West Newton Borough | 0.60% | 0.22%(+0.386)#84 | 0.22%(+0.383)#1,413 |
| 85. | Midland Borough | 0.60% | 0.22%(+0.384)#85 | 0.22%(+0.382)#1,416 |
| 86. | Bethlehem | 0.60% | 0.22%(+0.378)#86 | 0.22%(+0.376)#1,425 |
| 87. | Irwin Borough | 0.59% | 0.22%(+0.375)#87 | 0.22%(+0.373)#1,429 |
| 88. | Montgomeryville | 0.58% | 0.22%(+0.367)#88 | 0.22%(+0.364)#1,450 |
| 89. | Wilkes Barre | 0.58% | 0.22%(+0.363)#89 | 0.22%(+0.360)#1,459 |
| 90. | Forest Hills Borough | 0.58% | 0.22%(+0.361)#90 | 0.22%(+0.358)#1,461 |
| 91. | Stouchsburg | 0.57% | 0.22%(+0.354)#91 | 0.22%(+0.351)#1,475 |
| 92. | Wyomissing Borough | 0.57% | 0.22%(+0.352)#92 | 0.22%(+0.349)#1,485 |
| 93. | Tullytown Borough | 0.56% | 0.22%(+0.343)#93 | 0.22%(+0.340)#1,517 |
| 94. | Jefferson Hills Borough | 0.55% | 0.22%(+0.335)#94 | 0.22%(+0.333)#1,536 |
| 95. | Ardmore | 0.55% | 0.22%(+0.329)#95 | 0.22%(+0.327)#1,552 |
| 96. | Carnegie Borough | 0.55% | 0.22%(+0.328)#96 | 0.22%(+0.325)#1,554 |
| 97. | Kulpmont Borough | 0.54% | 0.22%(+0.326)#97 | 0.22%(+0.324)#1,560 |
| 98. | Gilbertsville | 0.54% | 0.22%(+0.323)#98 | 0.22%(+0.320)#1,571 |
| 99. | Sinking Spring Borough | 0.54% | 0.22%(+0.322)#99 | 0.22%(+0.320)#1,572 |
| 100. | Canonsburg Borough | 0.54% | 0.22%(+0.320)#100 | 0.22%(+0.318)#1,578 |
Common Questions
What are the Top 10 Cities with the Highest Percentage of Immigrants from Southern Europe in Pennsylvania?
Top 10 Cities with the Highest Percentage of Immigrants from Southern Europe in Pennsylvania are:
#1
19.58%
#2
6.86%
#3
2.46%
#4
2.37%
#5
2.08%
#6
1.97%
#7
1.85%
#8
1.82%
#9
1.74%
#10
1.61%
What city has the Highest Percentage of Immigrants from Southern Europe in Pennsylvania?
East Earl has the Highest Percentage of Immigrants from Southern Europe in Pennsylvania with 19.58%.
What is the Percentage of Immigrants from Southern Europe in the State of Pennsylvania?
Percentage of Immigrants from Southern Europe in Pennsylvania is 0.22%.
What is the Percentage of Immigrants from Southern Europe in the United States?
Percentage of Immigrants from Southern Europe in the United States is 0.22%.