Cities with the Highest Percentage of Immigrants from Southern Europe in Kentucky

RELATED REPORTS & OPTIONS

Southern Europe
Population
Families and Households
Female Fertility
Female Fertility (Unmarried)
Race (Community Size)
Race (Percentage)
Ancestry (Community Size)
AfghanAfricanAlaska NativeAlaskan AthabascanAlbanianAleutAlsatianAmericanApacheArabArapahoArgentineanArmenianAssyrian / Chaldean / SyriacAustralianAustrianBahamianBangladeshiBarbadianBasqueBelgianBelizeanBermudanBhutaneseBlackfeetBolivianBrazilianBritishBritish West IndianBulgarianBurmeseCajunCambodianCanadianCape VerdeanCarpatho RusynCelticCentral AmericanCentral American IndianCherokeeCheyenneChickasawChileanChineseChippewaChoctawColombianColvilleComancheCosta RicanCreeCreekCroatianCrowCubanCypriotCzechCzechoslovakianDanishDelawareDominicanDutchDutch West IndianEastern EuropeanEcuadorianEgyptianEnglishEstonianEthiopianEuropeanFijianFilipinoFinnishFrenchFrench American IndianFrench CanadianGermanGerman RussianGhanaianGreekGuamanian / ChamorroGuatemalanGuyaneseHaitianHmongHonduranHopiHoumaHungarianIcelanderIndian (Asian)IndonesianInupiatIranianIraqiIrishIroquoisIsraeliItalianJamaicanJapaneseJordanianKenyanKiowaKoreanLaotianLatvianLebaneseLiberianLithuanianLumbeeLuxembourgerMacedonianMalaysianMalteseMarshalleseMenomineeMexicanMexican American IndianMongolianMoroccanNative HawaiianNavajoNepaleseNew ZealanderNicaraguanNigerianNorthern EuropeanNorwegianOkinawanOsageOttawaPaiutePakistaniPalestinianPanamanianParaguayanPennsylvania GermanPeruvianPimaPolishPortuguesePotawatomiPuebloPuerto RicanPuget Sound SalishRomanianRussianSalvadoranSamoanScandinavianScotch-IrishScottishSeminoleSenegaleseSerbianShoshoneSierra LeoneanSiouxSlavicSlovakSloveneSomaliSouth AfricanSouth AmericanSouth American IndianSoviet UnionSpaniardSpanishSpanish AmericanSpanish American IndianSri LankanSubsaharan AfricanSudaneseSwedishSwissSyrianTaiwaneseThaiTlingit-HaidaTohono O'OdhamTonganTrinidadian and TobagonianTsimshianTurkishU.S. Virgin IslanderUgandanUkrainianUruguayanUteVenezuelanVietnameseWelshWest IndianYakamaYaquiYugoslavianYumanYup'ikZimbabwean
Ancestry (Percentage)
AfghanAfricanAlaska NativeAlaskan AthabascanAlbanianAleutAlsatianAmericanApacheArabArapahoArgentineanArmenianAssyrian / Chaldean / SyriacAustralianAustrianBahamianBangladeshiBarbadianBasqueBelgianBelizeanBermudanBhutaneseBlackfeetBolivianBrazilianBritishBritish West IndianBulgarianBurmeseCajunCambodianCanadianCape VerdeanCarpatho RusynCelticCentral AmericanCentral American IndianCherokeeCheyenneChickasawChileanChineseChippewaChoctawColombianColvilleComancheCosta RicanCreeCreekCroatianCrowCubanCypriotCzechCzechoslovakianDanishDelawareDominicanDutchDutch West IndianEastern EuropeanEcuadorianEgyptianEnglishEstonianEthiopianEuropeanFijianFilipinoFinnishFrenchFrench American IndianFrench CanadianGermanGerman RussianGhanaianGreekGuamanian / ChamorroGuatemalanGuyaneseHaitianHmongHonduranHopiHoumaHungarianIcelanderIndian (Asian)IndonesianInupiatIranianIraqiIrishIroquoisIsraeliItalianJamaicanJapaneseJordanianKenyanKiowaKoreanLaotianLatvianLebaneseLiberianLithuanianLumbeeLuxembourgerMacedonianMalaysianMalteseMarshalleseMenomineeMexicanMexican American IndianMongolianMoroccanNative HawaiianNavajoNepaleseNew ZealanderNicaraguanNigerianNorthern EuropeanNorwegianOkinawanOsageOttawaPaiutePakistaniPalestinianPanamanianParaguayanPennsylvania GermanPeruvianPimaPolishPortuguesePotawatomiPuebloPuerto RicanPuget Sound SalishRomanianRussianSalvadoranSamoanScandinavianScotch-IrishScottishSeminoleSenegaleseSerbianShoshoneSierra LeoneanSiouxSlavicSlovakSloveneSomaliSouth AfricanSouth AmericanSouth American IndianSoviet UnionSpaniardSpanishSpanish AmericanSpanish American IndianSri LankanSubsaharan AfricanSudaneseSwedishSwissSyrianTaiwaneseThaiTlingit-HaidaTohono O'OdhamTonganTrinidadian and TobagonianTsimshianTurkishU.S. Virgin IslanderUgandanUkrainianUruguayanUteVenezuelanVietnameseWelshWest IndianYakamaYaquiYugoslavianYumanYup'ikZimbabwean
Immigrant Origin (Total)
AfghanistanAfricaAlbaniaArgentinaArmeniaAsiaAustraliaAustriaAzoresBahamasBangladeshBarbadosBelarusBelgiumBelizeBoliviaBosnia and HerzegovinaBrazilBulgariaBurma / MyanmarCabo VerdeCambodiaCameroonCanadaCaribbeanCentral AmericaChileChinaColombiaCongoCosta RicaCroatiaCubaCzechoslovakiaDenmarkDominicaDominican RepublicEastern AfricaEastern AsiaEastern EuropeEcuadorEgyptEl SalvadorEnglandEritreaEthiopiaEuropeFijiFranceGermanyGhanaGreeceGrenadaGuatemalaGuyanaHaitiHondurasHong KongHungaryIndiaIndonesiaIranIraqIrelandIsraelItalyJamaicaJapanJordanKazakhstanKenyaKoreaKuwaitLaosLatin AmericaLatviaLebanonLiberiaLithuaniaMalaysiaMexicoMicronesiaMiddle AfricaMoldovaMoroccoNepalNetherlandsNicaraguaNigeriaNorth MacedoniaNorthern AfricaNorthern EuropeNorwayOceaniaPakistanPanamaPeruPhilippinesPolandPortugalRomaniaRussiaSaudi ArabiaScotlandSenegalSerbiaSierra LeoneSingaporeSomaliaSouth AfricaSouth AmericaSouth Central AsiaSouth Eastern AsiaSouthern EuropeSpainSri LankaSt. Vincent and the GrenadinesSudanSwedenSwitzerlandSyriaTaiwanThailandTrinidad and TobagoTurkeyUgandaUkraineUruguayUzbekistanVenezuelaVietnamWest IndiesWestern AfricaWestern AsiaWestern EuropeYemenZaireZimbabwe
Immigrant Origin (Percentage)
AfghanistanAfricaAlbaniaArgentinaArmeniaAsiaAustraliaAustriaAzoresBahamasBangladeshBarbadosBelarusBelgiumBelizeBoliviaBosnia and HerzegovinaBrazilBulgariaBurma / MyanmarCabo VerdeCambodiaCameroonCanadaCaribbeanCentral AmericaChileChinaColombiaCongoCosta RicaCroatiaCubaCzechoslovakiaDenmarkDominicaDominican RepublicEastern AfricaEastern AsiaEastern EuropeEcuadorEgyptEl SalvadorEnglandEritreaEthiopiaEuropeFijiFranceGermanyGhanaGreeceGrenadaGuatemalaGuyanaHaitiHondurasHong KongHungaryIndiaIndonesiaIranIraqIrelandIsraelItalyJamaicaJapanJordanKazakhstanKenyaKoreaKuwaitLaosLatin AmericaLatviaLebanonLiberiaLithuaniaMalaysiaMexicoMicronesiaMiddle AfricaMoldovaMoroccoNepalNetherlandsNicaraguaNigeriaNorth MacedoniaNorthern AfricaNorthern EuropeNorwayOceaniaPakistanPanamaPeruPhilippinesPolandPortugalRomaniaRussiaSaudi ArabiaScotlandSenegalSerbiaSierra LeoneSingaporeSomaliaSouth AfricaSouth AmericaSouth Central AsiaSouth Eastern AsiaSouthern EuropeSpainSri LankaSt. Vincent and the GrenadinesSudanSwedenSwitzerlandSyriaTaiwanThailandTrinidad and TobagoTurkeyUgandaUkraineUruguayUzbekistanVenezuelaVietnamWest IndiesWestern AfricaWestern AsiaWestern EuropeYemenZaireZimbabwe
Income
Income (Families)
Income (Households)
Poverty
Poverty (Families)
Unemployment
Employment Occupations
Employment Industries
Employer Class
Commute Time
Commute Means
School Enrollment
Education by Degree Field
Occupancy
Finances
Physical Characteristics
Kentucky
Compare Cities
Comparison Subject

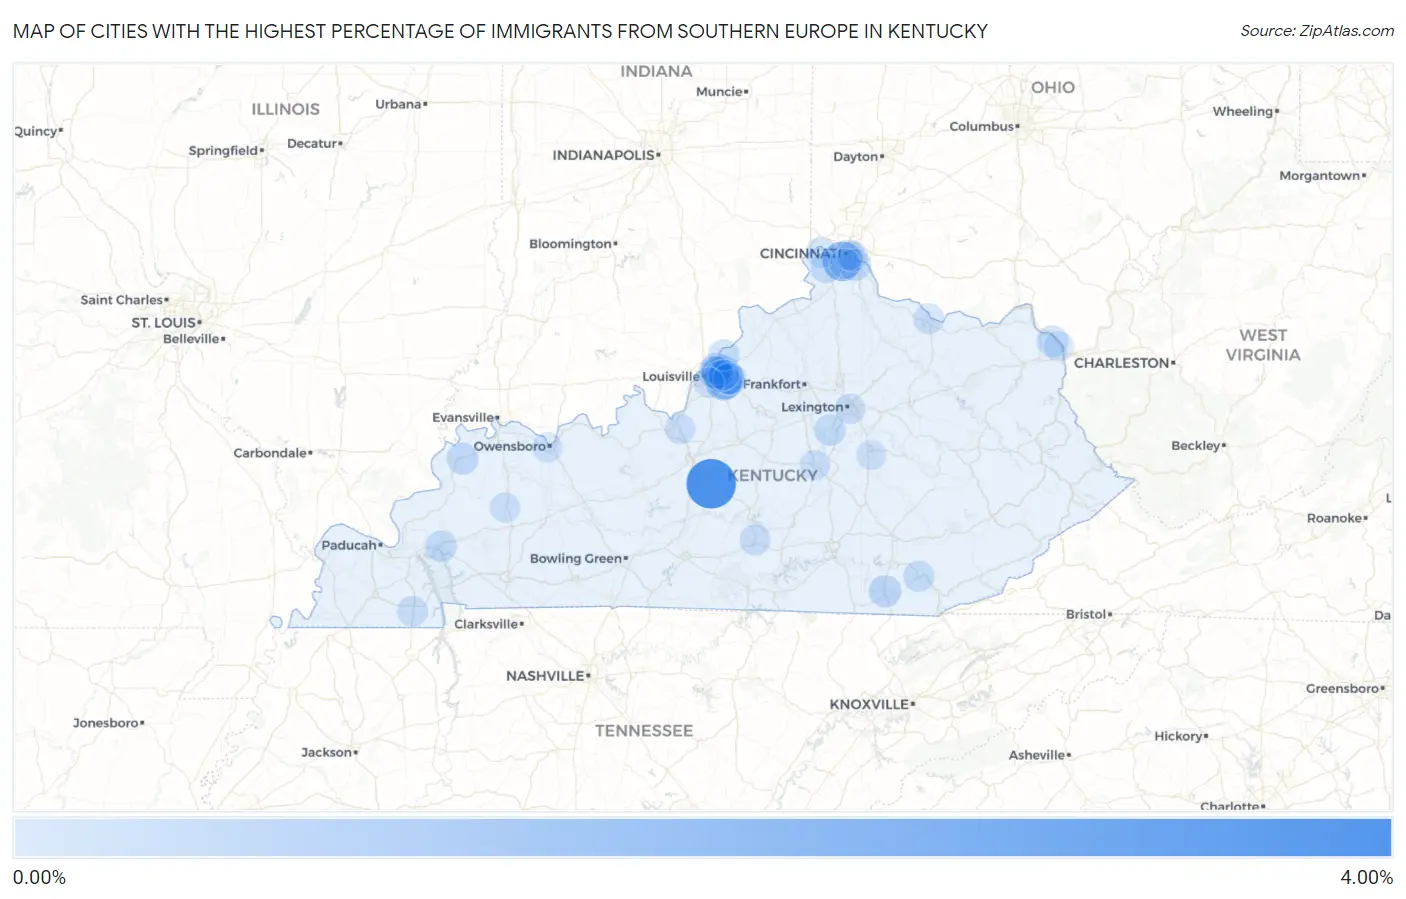
Map of Cities with the Highest Percentage of Immigrants from Southern Europe in Kentucky

0.00%
4.00%
Cities with the Highest Percentage of Immigrants from Southern Europe in Kentucky Map

Cities with the Highest Percentage of Immigrants from Southern Europe in Kentucky

City Southern Europe vs State vs National
1.Buffalo3.89%0.027%(+3.87)#10.22%(+3.67)#96
2.Fort Wright1.85%0.027%(+1.82)#20.22%(+1.63)#320
3.Forest Hills1.14%0.027%(+1.11)#30.22%(+0.916)#649
4.Sycamore0.71%0.027%(+0.688)#40.22%(+0.494)#1,145
5.Rolling Hills0.70%0.027%(+0.673)#50.22%(+0.479)#1,191
6.Jeffersontown0.67%0.027%(+0.647)#60.22%(+0.454)#1,242
7.Woodland Hills0.48%0.027%(+0.457)#70.22%(+0.263)#1,734
8.Indian Hills0.45%0.027%(+0.423)#80.22%(+0.230)#1,839
9.Windy Hills0.41%0.027%(+0.384)#90.22%(+0.190)#1,978
10.Williamsburg0.38%0.027%(+0.356)#100.22%(+0.162)#2,086
11.Northfield0.36%0.027%(+0.335)#110.22%(+0.142)#2,180
12.Cold Spring0.35%0.027%(+0.325)#120.22%(+0.131)#2,244
13.Glenview0.35%0.027%(+0.322)#130.22%(+0.128)#2,257
14.Morganfield0.31%0.027%(+0.282)#140.22%(+0.088)#2,451
15.Wilmore0.27%0.027%(+0.239)#150.22%(+0.046)#2,710
16.Norwood0.26%0.027%(+0.231)#160.22%(+0.037)#2,778
17.Eddyville0.25%0.027%(+0.225)#170.22%(+0.031)#2,817
18.Oakbrook0.25%0.027%(+0.222)#180.22%(+0.029)#2,831
19.Bellefonte0.25%0.027%(+0.220)#190.22%(+0.027)#2,846
20.Goshen0.19%0.027%(+0.166)#200.22%(-0.027)#3,254
21.Barbourville0.19%0.027%(+0.161)#210.22%(-0.032)#3,304
22.Douglass Hills0.18%0.027%(+0.156)#220.22%(-0.037)#3,346
23.Francisville0.16%0.027%(+0.133)#230.22%(-0.061)#3,557
24.Columbia0.15%0.027%(+0.119)#240.22%(-0.075)#3,680
25.Murray0.14%0.027%(+0.111)#250.22%(-0.082)#3,759
26.Maysville0.11%0.027%(+0.087)#260.22%(-0.107)#4,052
27.Lyndon0.091%0.027%(+0.064)#270.22%(-0.129)#4,311
28.Newport0.078%0.027%(+0.051)#280.22%(-0.143)#4,471
29.Fort Thomas0.075%0.027%(+0.049)#290.22%(-0.145)#4,502
30.Lexington0.069%0.027%(+0.043)#300.22%(-0.151)#4,576
31.Fort Knox0.058%0.027%(+0.031)#310.22%(-0.162)#4,715
32.Danville0.047%0.027%(+0.020)#320.22%(-0.174)#4,844
33.Madisonville0.031%0.027%(+0.004)#330.22%(-0.189)#5,024
34.Ashland0.028%0.027%(+0.001)#340.22%(-0.192)#5,066
35.Covington0.027%0.027%(+0.000)#350.22%(-0.193)#5,080
36.Louisville0.026%0.027%(-0.000)#360.22%(-0.194)#5,084
37.Richmond0.020%0.027%(-0.006)#370.22%(-0.200)#5,165
38.Owensboro0.018%0.027%(-0.008)#380.22%(-0.202)#5,189

Common Questions

What are the Top 10 Cities with the Highest Percentage of Immigrants from Southern Europe in Kentucky?
Top 10 Cities with the Highest Percentage of Immigrants from Southern Europe in Kentucky are:
What city has the Highest Percentage of Immigrants from Southern Europe in Kentucky?
Buffalo has the Highest Percentage of Immigrants from Southern Europe in Kentucky with 3.89%.
What is the Percentage of Immigrants from Southern Europe in the State of Kentucky?
Percentage of Immigrants from Southern Europe in Kentucky is 0.027%.
What is the Percentage of Immigrants from Southern Europe in the United States?
Percentage of Immigrants from Southern Europe in the United States is 0.22%.