Cities with the Highest Percentage of Immigrants from Southern Europe in Oklahoma
RELATED REPORTS & OPTIONS
Southern Europe
Oklahoma
Compare Cities
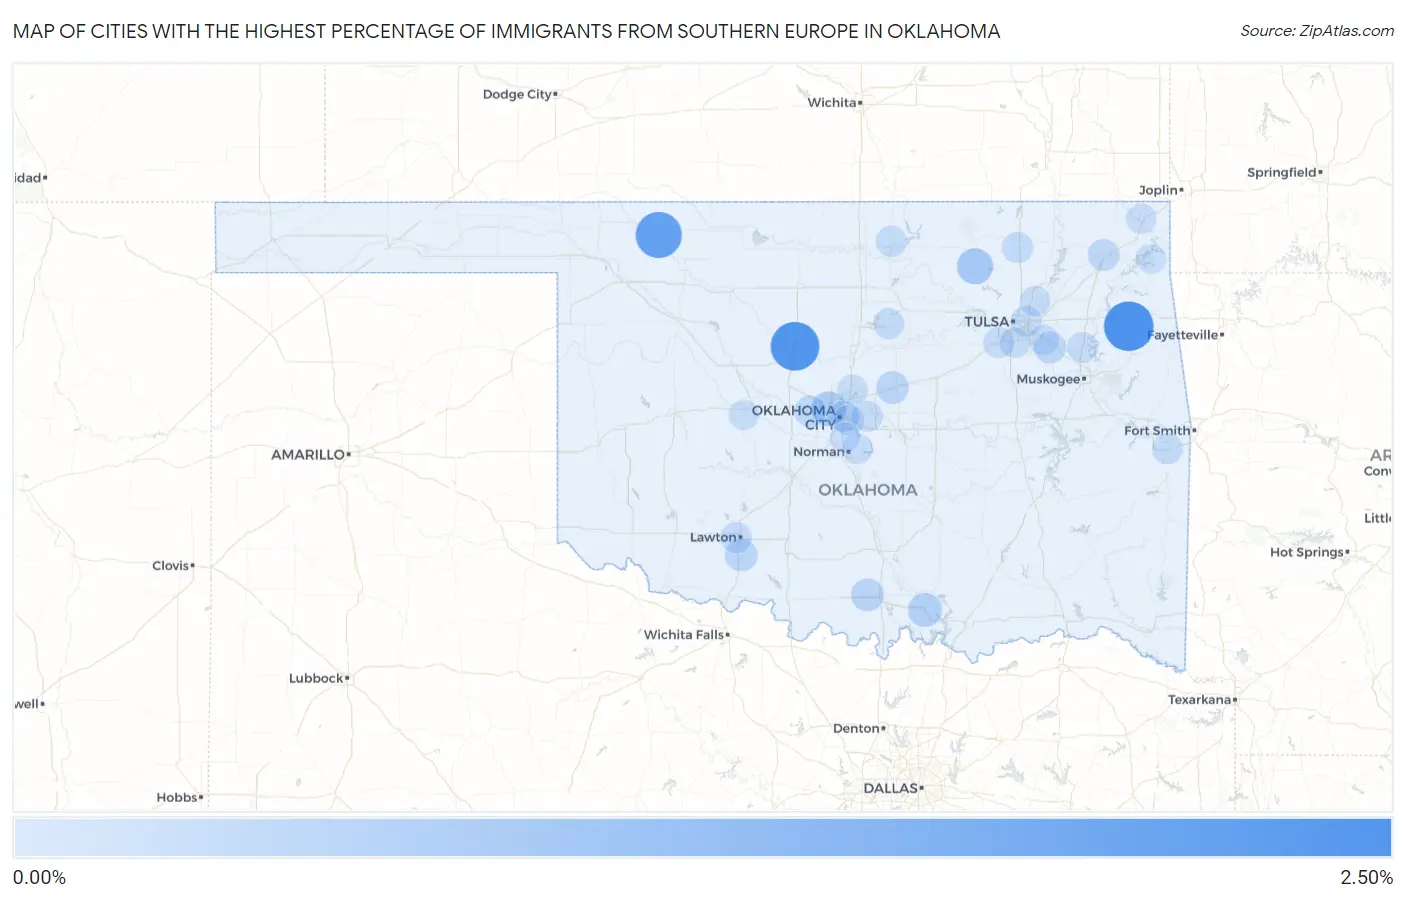
Map of Cities with the Highest Percentage of Immigrants from Southern Europe in Oklahoma
0.00%
2.50%
Cities with the Highest Percentage of Immigrants from Southern Europe in Oklahoma
| City | Southern Europe | vs State | vs National | |
| 1. | Teresita | 2.19% | 0.040%(+2.15)#1 | 0.22%(+1.97)#254 |
| 2. | Dover | 2.08% | 0.040%(+2.04)#2 | 0.22%(+1.86)#272 |
| 3. | Freedom | 1.79% | 0.040%(+1.75)#3 | 0.22%(+1.57)#341 |
| 4. | Wynona | 0.63% | 0.040%(+0.589)#4 | 0.22%(+0.409)#1,347 |
| 5. | Warr Acres | 0.49% | 0.040%(+0.449)#5 | 0.22%(+0.269)#1,704 |
| 6. | Madill | 0.41% | 0.040%(+0.367)#6 | 0.22%(+0.187)#1,993 |
| 7. | Lone Grove | 0.28% | 0.040%(+0.238)#7 | 0.22%(+0.058)#2,618 |
| 8. | Geronimo | 0.25% | 0.040%(+0.211)#8 | 0.22%(+0.032)#2,812 |
| 9. | Wellston | 0.25% | 0.040%(+0.211)#9 | 0.22%(+0.032)#2,813 |
| 10. | Coweta | 0.19% | 0.040%(+0.151)#10 | 0.22%(-0.028)#3,265 |
| 11. | Vinita | 0.17% | 0.040%(+0.132)#11 | 0.22%(-0.047)#3,433 |
| 12. | Yukon | 0.15% | 0.040%(+0.108)#12 | 0.22%(-0.071)#3,643 |
| 13. | Lawton | 0.12% | 0.040%(+0.076)#13 | 0.22%(-0.104)#4,022 |
| 14. | Ponca City | 0.11% | 0.040%(+0.074)#14 | 0.22%(-0.105)#4,041 |
| 15. | Stillwater | 0.10% | 0.040%(+0.060)#15 | 0.22%(-0.119)#4,179 |
| 16. | Spiro | 0.095% | 0.040%(+0.055)#16 | 0.22%(-0.125)#4,246 |
| 17. | Bartlesville | 0.094% | 0.040%(+0.053)#17 | 0.22%(-0.126)#4,264 |
| 18. | Tulsa | 0.091% | 0.040%(+0.051)#18 | 0.22%(-0.129)#4,309 |
| 19. | Wagoner | 0.090% | 0.040%(+0.049)#19 | 0.22%(-0.130)#4,321 |
| 20. | Sapulpa | 0.086% | 0.040%(+0.046)#20 | 0.22%(-0.134)#4,359 |
| 21. | Choctaw | 0.082% | 0.040%(+0.042)#21 | 0.22%(-0.138)#4,415 |
| 22. | Oklahoma City | 0.070% | 0.040%(+0.029)#22 | 0.22%(-0.150)#4,570 |
| 23. | Edmond | 0.066% | 0.040%(+0.025)#23 | 0.22%(-0.154)#4,618 |
| 24. | Del City | 0.065% | 0.040%(+0.024)#24 | 0.22%(-0.155)#4,627 |
| 25. | Owasso | 0.055% | 0.040%(+0.015)#25 | 0.22%(-0.165)#4,741 |
| 26. | Jenks | 0.054% | 0.040%(+0.014)#26 | 0.22%(-0.166)#4,757 |
| 27. | Broken Arrow | 0.042% | 0.040%(+0.002)#27 | 0.22%(-0.178)#4,899 |
| 28. | Norman | 0.032% | 0.040%(-0.008)#28 | 0.22%(-0.188)#5,012 |
| 29. | Miami | 0.031% | 0.040%(-0.010)#29 | 0.22%(-0.189)#5,027 |
| 30. | Hinton | 0.021% | 0.040%(-0.020)#30 | 0.22%(-0.199)#5,153 |
| 31. | Grove | 0.014% | 0.040%(-0.026)#31 | 0.22%(-0.206)#5,224 |
| 32. | Moore | 0.0016% | 0.040%(-0.039)#32 | 0.22%(-0.218)#5,299 |
Common Questions
What are the Top 10 Cities with the Highest Percentage of Immigrants from Southern Europe in Oklahoma?
Top 10 Cities with the Highest Percentage of Immigrants from Southern Europe in Oklahoma are:
#1
2.19%
#2
2.08%
#3
1.79%
#4
0.63%
#5
0.49%
#6
0.41%
#7
0.28%
#8
0.25%
#9
0.25%
#10
0.19%
What city has the Highest Percentage of Immigrants from Southern Europe in Oklahoma?
Teresita has the Highest Percentage of Immigrants from Southern Europe in Oklahoma with 2.19%.
What is the Percentage of Immigrants from Southern Europe in the State of Oklahoma?
Percentage of Immigrants from Southern Europe in Oklahoma is 0.040%.
What is the Percentage of Immigrants from Southern Europe in the United States?
Percentage of Immigrants from Southern Europe in the United States is 0.22%.