Cities with the Highest Percentage of Immigrants from Southern Europe in Missouri
RELATED REPORTS & OPTIONS
Southern Europe
Missouri
Compare Cities
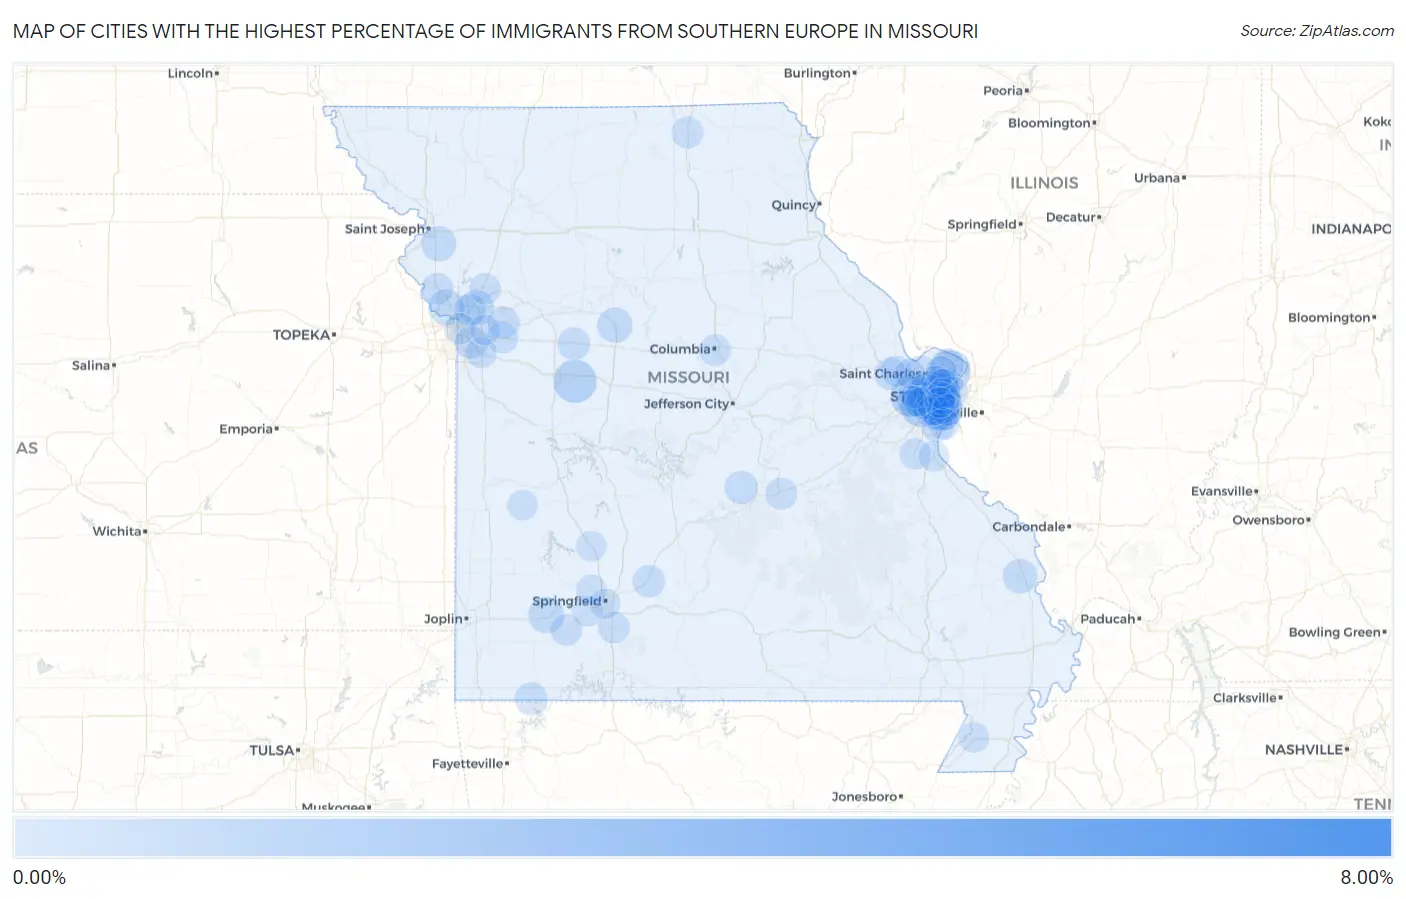
Map of Cities with the Highest Percentage of Immigrants from Southern Europe in Missouri
0.00%
8.00%
Cities with the Highest Percentage of Immigrants from Southern Europe in Missouri
| City | Southern Europe | vs State | vs National | |
| 1. | Connelsville | 6.82% | 0.051%(+6.77)#1 | 0.22%(+6.60)#45 |
| 2. | Crystal Lake Park | 1.52% | 0.051%(+1.47)#2 | 0.22%(+1.30)#425 |
| 3. | Twin Oaks | 1.13% | 0.051%(+1.08)#3 | 0.22%(+0.911)#657 |
| 4. | Clarkson Valley | 1.07% | 0.051%(+1.02)#4 | 0.22%(+0.854)#709 |
| 5. | Whiteman Afb | 1.04% | 0.051%(+0.993)#5 | 0.22%(+0.824)#736 |
| 6. | Black Jack | 0.92% | 0.051%(+0.868)#6 | 0.22%(+0.700)#864 |
| 7. | Des Peres | 0.73% | 0.051%(+0.682)#7 | 0.22%(+0.513)#1,109 |
| 8. | Green Park | 0.71% | 0.051%(+0.656)#8 | 0.22%(+0.487)#1,172 |
| 9. | Shrewsbury | 0.68% | 0.051%(+0.626)#9 | 0.22%(+0.457)#1,234 |
| 10. | Crestwood | 0.56% | 0.051%(+0.509)#10 | 0.22%(+0.340)#1,515 |
| 11. | Town And Country | 0.49% | 0.051%(+0.441)#11 | 0.22%(+0.272)#1,694 |
| 12. | Lakeshire | 0.49% | 0.051%(+0.441)#12 | 0.22%(+0.272)#1,695 |
| 13. | Mount Vernon | 0.49% | 0.051%(+0.436)#13 | 0.22%(+0.268)#1,715 |
| 14. | Weatherby Lake | 0.45% | 0.051%(+0.403)#14 | 0.22%(+0.234)#1,823 |
| 15. | Marshall | 0.42% | 0.051%(+0.365)#15 | 0.22%(+0.196)#1,956 |
| 16. | Liberty | 0.40% | 0.051%(+0.351)#16 | 0.22%(+0.183)#2,005 |
| 17. | Agency | 0.40% | 0.051%(+0.345)#17 | 0.22%(+0.176)#2,023 |
| 18. | Concord | 0.39% | 0.051%(+0.336)#18 | 0.22%(+0.167)#2,064 |
| 19. | Jackson | 0.35% | 0.051%(+0.299)#19 | 0.22%(+0.131)#2,248 |
| 20. | University City | 0.28% | 0.051%(+0.224)#20 | 0.22%(+0.055)#2,634 |
| 21. | Manchester | 0.27% | 0.051%(+0.223)#21 | 0.22%(+0.054)#2,645 |
| 22. | Dixon | 0.26% | 0.051%(+0.208)#22 | 0.22%(+0.039)#2,760 |
| 23. | Huntleigh | 0.23% | 0.051%(+0.181)#23 | 0.22%(+0.013)#2,940 |
| 24. | Normandy | 0.23% | 0.051%(+0.181)#24 | 0.22%(+0.012)#2,941 |
| 25. | Seligman | 0.22% | 0.051%(+0.169)#25 | 0.22%(+0.001)#3,015 |
| 26. | Raytown | 0.21% | 0.051%(+0.164)#26 | 0.22%(-0.005)#3,060 |
| 27. | Kirkwood | 0.21% | 0.051%(+0.164)#27 | 0.22%(-0.005)#3,061 |
| 28. | Old Jamestown | 0.21% | 0.051%(+0.160)#28 | 0.22%(-0.009)#3,088 |
| 29. | Concordia | 0.21% | 0.051%(+0.158)#29 | 0.22%(-0.011)#3,111 |
| 30. | Charlack | 0.21% | 0.051%(+0.156)#30 | 0.22%(-0.013)#3,135 |
| 31. | Creve Coeur | 0.20% | 0.051%(+0.152)#31 | 0.22%(-0.017)#3,164 |
| 32. | Fenton | 0.20% | 0.051%(+0.144)#32 | 0.22%(-0.025)#3,235 |
| 33. | Mehlville | 0.19% | 0.051%(+0.138)#33 | 0.22%(-0.031)#3,290 |
| 34. | Marshfield | 0.19% | 0.051%(+0.135)#34 | 0.22%(-0.033)#3,311 |
| 35. | Pleasant Valley | 0.18% | 0.051%(+0.131)#35 | 0.22%(-0.038)#3,354 |
| 36. | Affton | 0.18% | 0.051%(+0.124)#36 | 0.22%(-0.044)#3,417 |
| 37. | Buckner | 0.17% | 0.051%(+0.119)#37 | 0.22%(-0.050)#3,458 |
| 38. | Lake St Louis | 0.16% | 0.051%(+0.113)#38 | 0.22%(-0.056)#3,515 |
| 39. | Bel Nor | 0.15% | 0.051%(+0.097)#39 | 0.22%(-0.072)#3,649 |
| 40. | Platte City | 0.15% | 0.051%(+0.095)#40 | 0.22%(-0.074)#3,667 |
| 41. | Rolla | 0.14% | 0.051%(+0.094)#41 | 0.22%(-0.075)#3,691 |
| 42. | Arnold | 0.14% | 0.051%(+0.093)#42 | 0.22%(-0.076)#3,697 |
| 43. | Queen City | 0.14% | 0.051%(+0.090)#43 | 0.22%(-0.079)#3,718 |
| 44. | Brentwood | 0.13% | 0.051%(+0.083)#44 | 0.22%(-0.085)#3,801 |
| 45. | Maplewood | 0.13% | 0.051%(+0.083)#45 | 0.22%(-0.086)#3,805 |
| 46. | Grain Valley | 0.13% | 0.051%(+0.083)#46 | 0.22%(-0.086)#3,808 |
| 47. | St Louis | 0.13% | 0.051%(+0.079)#47 | 0.22%(-0.090)#3,839 |
| 48. | Ozark | 0.13% | 0.051%(+0.075)#48 | 0.22%(-0.094)#3,888 |
| 49. | Columbia | 0.12% | 0.051%(+0.068)#49 | 0.22%(-0.101)#3,984 |
| 50. | Marionville | 0.12% | 0.051%(+0.066)#50 | 0.22%(-0.102)#4,008 |
| 51. | Kearney | 0.11% | 0.051%(+0.063)#51 | 0.22%(-0.106)#4,044 |
| 52. | Lemay | 0.099% | 0.051%(+0.047)#52 | 0.22%(-0.121)#4,205 |
| 53. | Chesterfield | 0.097% | 0.051%(+0.045)#53 | 0.22%(-0.123)#4,231 |
| 54. | Ellisville | 0.091% | 0.051%(+0.039)#54 | 0.22%(-0.129)#4,314 |
| 55. | Kansas City | 0.088% | 0.051%(+0.036)#55 | 0.22%(-0.132)#4,346 |
| 56. | Oakville | 0.088% | 0.051%(+0.036)#56 | 0.22%(-0.133)#4,347 |
| 57. | Hillsboro | 0.087% | 0.051%(+0.035)#57 | 0.22%(-0.134)#4,355 |
| 58. | St Charles | 0.083% | 0.051%(+0.032)#58 | 0.22%(-0.137)#4,395 |
| 59. | Sunset Hills | 0.077% | 0.051%(+0.025)#59 | 0.22%(-0.143)#4,484 |
| 60. | Lee S Summit | 0.071% | 0.051%(+0.019)#60 | 0.22%(-0.149)#4,562 |
| 61. | O Fallon | 0.069% | 0.051%(+0.017)#61 | 0.22%(-0.151)#4,584 |
| 62. | St Ann | 0.062% | 0.051%(+0.011)#62 | 0.22%(-0.158)#4,653 |
| 63. | Clayton | 0.058% | 0.051%(+0.007)#63 | 0.22%(-0.162)#4,709 |
| 64. | Festus | 0.055% | 0.051%(+0.003)#64 | 0.22%(-0.165)#4,746 |
| 65. | Republic | 0.048% | 0.051%(-0.004)#65 | 0.22%(-0.172)#4,828 |
| 66. | Ballwin | 0.039% | 0.051%(-0.013)#66 | 0.22%(-0.181)#4,934 |
| 67. | Kennett | 0.039% | 0.051%(-0.013)#67 | 0.22%(-0.182)#4,936 |
| 68. | Bolivar | 0.037% | 0.051%(-0.014)#68 | 0.22%(-0.183)#4,954 |
| 69. | Independence | 0.036% | 0.051%(-0.015)#69 | 0.22%(-0.184)#4,966 |
| 70. | Willard | 0.032% | 0.051%(-0.020)#70 | 0.22%(-0.189)#5,019 |
| 71. | El Dorado Springs | 0.028% | 0.051%(-0.023)#71 | 0.22%(-0.192)#5,063 |
| 72. | Florissant | 0.025% | 0.051%(-0.026)#72 | 0.22%(-0.195)#5,097 |
| 73. | Springfield | 0.023% | 0.051%(-0.029)#73 | 0.22%(-0.198)#5,137 |
| 74. | Webster Groves | 0.021% | 0.051%(-0.030)#74 | 0.22%(-0.199)#5,148 |
| 75. | St Peters | 0.014% | 0.051%(-0.037)#75 | 0.22%(-0.206)#5,228 |
Common Questions
What are the Top 10 Cities with the Highest Percentage of Immigrants from Southern Europe in Missouri?
Top 10 Cities with the Highest Percentage of Immigrants from Southern Europe in Missouri are:
#1
1.52%
#2
1.13%
#3
1.07%
#4
1.04%
#5
0.92%
#6
0.73%
#7
0.71%
#8
0.68%
#9
0.56%
#10
0.49%
What city has the Highest Percentage of Immigrants from Southern Europe in Missouri?
Crystal Lake Park has the Highest Percentage of Immigrants from Southern Europe in Missouri with 1.52%.
What is the Percentage of Immigrants from Southern Europe in the State of Missouri?
Percentage of Immigrants from Southern Europe in Missouri is 0.051%.
What is the Percentage of Immigrants from Southern Europe in the United States?
Percentage of Immigrants from Southern Europe in the United States is 0.22%.