Cities with the Highest Percentage of Immigrants from Southern Europe in New York
RELATED REPORTS & OPTIONS
Southern Europe
New York
Compare Cities
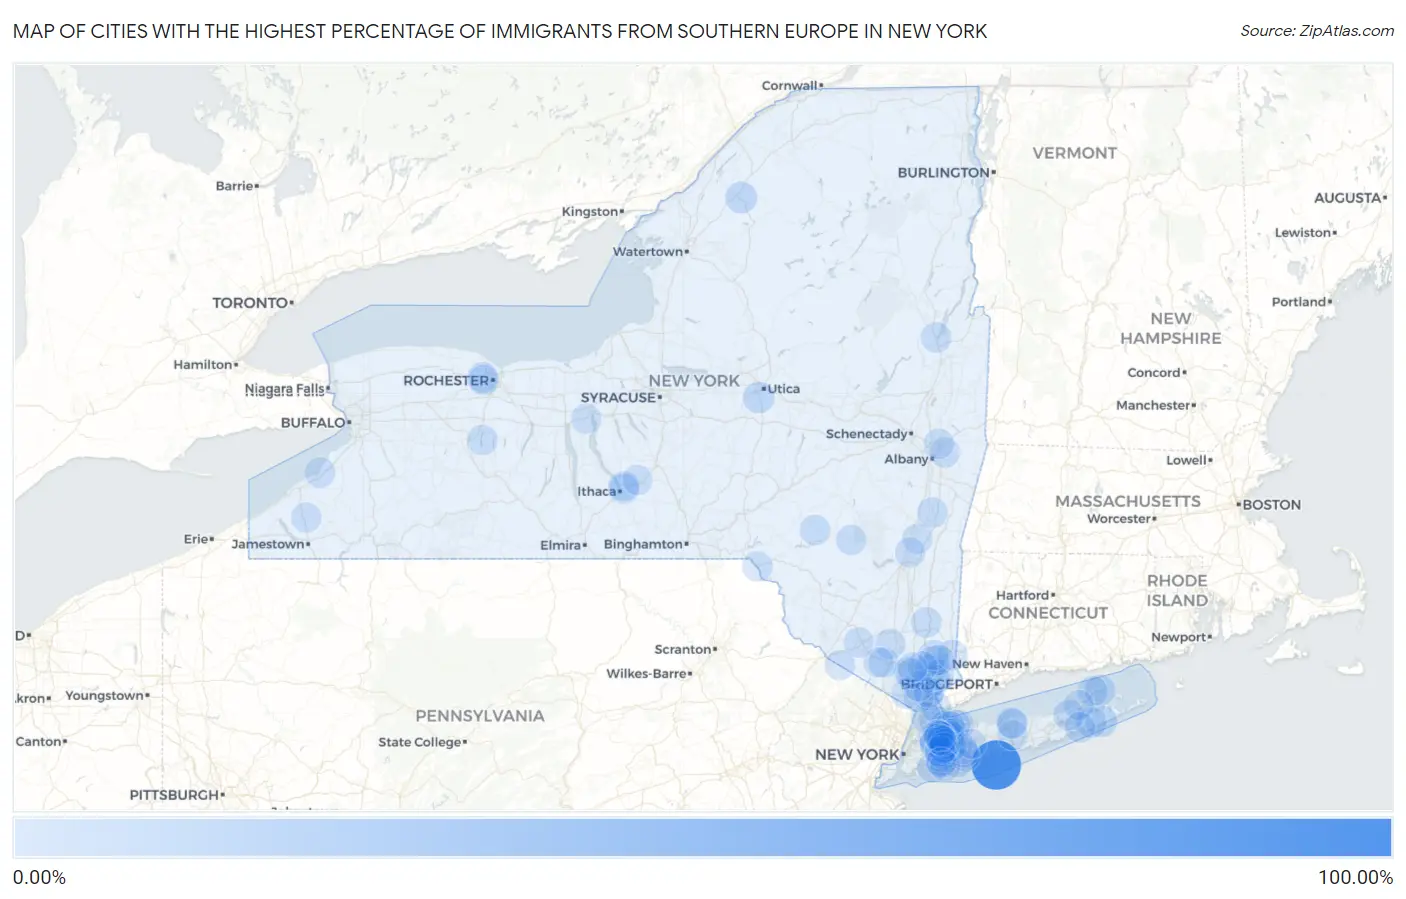
Map of Cities with the Highest Percentage of Immigrants from Southern Europe in New York
0.00%
100.00%
Cities with the Highest Percentage of Immigrants from Southern Europe in New York
| City | Southern Europe | vs State | vs National | |
| 1. | Saltaire | 100.00% | 0.69%(+99.3)#1 | 0.22%(+99.8)#1 |
| 2. | Mountain Dale | 9.23% | 0.69%(+8.55)#2 | 0.22%(+9.01)#26 |
| 3. | Greenvale | 8.93% | 0.69%(+8.25)#3 | 0.22%(+8.71)#28 |
| 4. | Sagaponack | 8.72% | 0.69%(+8.04)#4 | 0.22%(+8.50)#30 |
| 5. | Hailesboro | 8.29% | 0.69%(+7.61)#5 | 0.22%(+8.07)#31 |
| 6. | Washington Mills | 7.91% | 0.69%(+7.22)#6 | 0.22%(+7.69)#33 |
| 7. | North Lynbrook | 7.23% | 0.69%(+6.55)#7 | 0.22%(+7.01)#41 |
| 8. | Mamaroneck | 5.98% | 0.69%(+5.30)#8 | 0.22%(+5.76)#59 |
| 9. | Mineola | 5.39% | 0.69%(+4.70)#9 | 0.22%(+5.17)#66 |
| 10. | Plandome Heights | 5.12% | 0.69%(+4.43)#10 | 0.22%(+4.90)#70 |
| 11. | Wurtsboro Hills | 5.08% | 0.69%(+4.40)#11 | 0.22%(+4.86)#72 |
| 12. | Glen Cove | 4.97% | 0.69%(+4.29)#12 | 0.22%(+4.75)#73 |
| 13. | Laurel | 4.90% | 0.69%(+4.21)#13 | 0.22%(+4.68)#75 |
| 14. | Eldred | 4.71% | 0.69%(+4.03)#14 | 0.22%(+4.49)#80 |
| 15. | Orient | 4.51% | 0.69%(+3.82)#15 | 0.22%(+4.29)#84 |
| 16. | Water Mill | 4.29% | 0.69%(+3.60)#16 | 0.22%(+4.07)#86 |
| 17. | East Marion | 4.09% | 0.69%(+3.41)#17 | 0.22%(+3.87)#91 |
| 18. | Carmel | 3.71% | 0.69%(+3.02)#18 | 0.22%(+3.49)#101 |
| 19. | Franklin Square | 3.70% | 0.69%(+3.01)#19 | 0.22%(+3.48)#103 |
| 20. | Yorktown Heights | 3.59% | 0.69%(+2.90)#20 | 0.22%(+3.37)#107 |
| 21. | Shenorock | 3.51% | 0.69%(+2.82)#21 | 0.22%(+3.28)#111 |
| 22. | North Gates | 3.44% | 0.69%(+2.76)#22 | 0.22%(+3.22)#116 |
| 23. | Albertson | 3.36% | 0.69%(+2.67)#23 | 0.22%(+3.14)#121 |
| 24. | Centre Island | 3.31% | 0.69%(+2.63)#24 | 0.22%(+3.09)#122 |
| 25. | Carle Place | 3.29% | 0.69%(+2.61)#25 | 0.22%(+3.07)#123 |
| 26. | Lake George | 3.29% | 0.69%(+2.60)#26 | 0.22%(+3.07)#124 |
| 27. | Mount Kisco | 3.28% | 0.69%(+2.59)#27 | 0.22%(+3.06)#125 |
| 28. | University Gardens | 3.26% | 0.69%(+2.57)#28 | 0.22%(+3.04)#129 |
| 29. | Upper Brookville | 3.24% | 0.69%(+2.56)#29 | 0.22%(+3.02)#130 |
| 30. | Bayville | 3.22% | 0.69%(+2.54)#30 | 0.22%(+3.00)#132 |
| 31. | North Massapequa | 3.21% | 0.69%(+2.52)#31 | 0.22%(+2.99)#133 |
| 32. | Hawthorne | 3.20% | 0.69%(+2.51)#32 | 0.22%(+2.98)#135 |
| 33. | Hopewell Junction | 3.16% | 0.69%(+2.47)#33 | 0.22%(+2.94)#138 |
| 34. | Glen Head | 3.15% | 0.69%(+2.46)#34 | 0.22%(+2.93)#139 |
| 35. | Verplanck | 3.14% | 0.69%(+2.46)#35 | 0.22%(+2.92)#140 |
| 36. | Port Jefferson Station | 3.11% | 0.69%(+2.42)#36 | 0.22%(+2.89)#143 |
| 37. | Gates | 3.07% | 0.69%(+2.39)#37 | 0.22%(+2.85)#148 |
| 38. | Kings Point | 3.06% | 0.69%(+2.37)#38 | 0.22%(+2.84)#149 |
| 39. | Pine Hill | 3.06% | 0.69%(+2.37)#39 | 0.22%(+2.84)#151 |
| 40. | Stottville | 2.95% | 0.69%(+2.27)#40 | 0.22%(+2.73)#160 |
| 41. | Bedford Hills | 2.91% | 0.69%(+2.22)#41 | 0.22%(+2.69)#162 |
| 42. | Peach Lake | 2.89% | 0.69%(+2.21)#42 | 0.22%(+2.67)#164 |
| 43. | Eastchester | 2.86% | 0.69%(+2.18)#43 | 0.22%(+2.64)#165 |
| 44. | Herricks | 2.79% | 0.69%(+2.11)#44 | 0.22%(+2.57)#173 |
| 45. | Plainedge | 2.73% | 0.69%(+2.05)#45 | 0.22%(+2.51)#179 |
| 46. | Garden City South | 2.67% | 0.69%(+1.99)#46 | 0.22%(+2.45)#184 |
| 47. | Harrison | 2.67% | 0.69%(+1.98)#47 | 0.22%(+2.45)#186 |
| 48. | Andes | 2.61% | 0.69%(+1.92)#48 | 0.22%(+2.39)#195 |
| 49. | Inwood | 2.59% | 0.69%(+1.90)#49 | 0.22%(+2.37)#197 |
| 50. | Sunset Bay | 2.46% | 0.69%(+1.77)#50 | 0.22%(+2.24)#212 |
| 51. | Stewart Manor | 2.45% | 0.69%(+1.77)#51 | 0.22%(+2.23)#215 |
| 52. | Baxter Estates | 2.44% | 0.69%(+1.75)#52 | 0.22%(+2.22)#217 |
| 53. | Bellmore | 2.38% | 0.69%(+1.69)#53 | 0.22%(+2.16)#223 |
| 54. | Farmingville | 2.36% | 0.69%(+1.67)#54 | 0.22%(+2.14)#225 |
| 55. | Old Brookville | 2.34% | 0.69%(+1.66)#55 | 0.22%(+2.12)#229 |
| 56. | Mahopac | 2.34% | 0.69%(+1.65)#56 | 0.22%(+2.12)#230 |
| 57. | Westbury | 2.32% | 0.69%(+1.64)#57 | 0.22%(+2.10)#231 |
| 58. | Port Washington North | 2.30% | 0.69%(+1.62)#58 | 0.22%(+2.08)#235 |
| 59. | Bethpage | 2.30% | 0.69%(+1.62)#59 | 0.22%(+2.08)#236 |
| 60. | Garden City Park | 2.30% | 0.69%(+1.62)#60 | 0.22%(+2.08)#237 |
| 61. | Beaver Dam Lake | 2.25% | 0.69%(+1.56)#61 | 0.22%(+2.03)#246 |
| 62. | Forest Home | 2.17% | 0.69%(+1.48)#62 | 0.22%(+1.95)#257 |
| 63. | Northeast Ithaca | 2.13% | 0.69%(+1.45)#63 | 0.22%(+1.91)#263 |
| 64. | Plandome Manor | 2.11% | 0.69%(+1.42)#64 | 0.22%(+1.89)#268 |
| 65. | Conesus Lake | 2.08% | 0.69%(+1.39)#65 | 0.22%(+1.86)#273 |
| 66. | Monroe | 2.03% | 0.69%(+1.34)#66 | 0.22%(+1.81)#278 |
| 67. | Sleepy Hollow | 2.02% | 0.69%(+1.33)#67 | 0.22%(+1.80)#281 |
| 68. | Heritage Hills | 2.01% | 0.69%(+1.33)#68 | 0.22%(+1.79)#282 |
| 69. | Great Neck Plaza | 1.98% | 0.69%(+1.29)#69 | 0.22%(+1.75)#286 |
| 70. | Terryville | 1.97% | 0.69%(+1.29)#70 | 0.22%(+1.75)#287 |
| 71. | Mechanicstown | 1.97% | 0.69%(+1.29)#71 | 0.22%(+1.75)#288 |
| 72. | Lattingtown | 1.96% | 0.69%(+1.28)#72 | 0.22%(+1.74)#292 |
| 73. | Freeville | 1.92% | 0.69%(+1.24)#73 | 0.22%(+1.70)#299 |
| 74. | Bardonia | 1.91% | 0.69%(+1.23)#74 | 0.22%(+1.69)#302 |
| 75. | Thornwood | 1.91% | 0.69%(+1.23)#75 | 0.22%(+1.69)#303 |
| 76. | Wynantskill | 1.90% | 0.69%(+1.21)#76 | 0.22%(+1.68)#306 |
| 77. | Peconic | 1.89% | 0.69%(+1.21)#77 | 0.22%(+1.67)#310 |
| 78. | Manorhaven | 1.89% | 0.69%(+1.20)#78 | 0.22%(+1.67)#311 |
| 79. | Germantown | 1.87% | 0.69%(+1.19)#79 | 0.22%(+1.65)#317 |
| 80. | Sinclairville | 1.85% | 0.69%(+1.16)#80 | 0.22%(+1.63)#321 |
| 81. | New Hyde Park | 1.84% | 0.69%(+1.15)#81 | 0.22%(+1.62)#323 |
| 82. | Seneca Falls | 1.83% | 0.69%(+1.14)#82 | 0.22%(+1.61)#326 |
| 83. | Hancock | 1.82% | 0.69%(+1.14)#83 | 0.22%(+1.60)#328 |
| 84. | Roslyn Heights | 1.81% | 0.69%(+1.12)#84 | 0.22%(+1.59)#333 |
| 85. | Unionville | 1.79% | 0.69%(+1.11)#85 | 0.22%(+1.57)#339 |
| 86. | Glasco | 1.78% | 0.69%(+1.09)#86 | 0.22%(+1.56)#342 |
| 87. | Shinnecock Hills | 1.78% | 0.69%(+1.09)#87 | 0.22%(+1.56)#343 |
| 88. | Ossining | 1.78% | 0.69%(+1.09)#88 | 0.22%(+1.56)#344 |
| 89. | Williston Park | 1.74% | 0.69%(+1.05)#89 | 0.22%(+1.52)#357 |
| 90. | Roslyn Estates | 1.70% | 0.69%(+1.02)#90 | 0.22%(+1.48)#366 |
| 91. | Oceanside | 1.70% | 0.69%(+1.01)#91 | 0.22%(+1.48)#368 |
| 92. | Port Washington | 1.70% | 0.69%(+1.01)#92 | 0.22%(+1.48)#369 |
| 93. | Montrose | 1.69% | 0.69%(+1.00)#93 | 0.22%(+1.47)#371 |
| 94. | Crompond | 1.63% | 0.69%(+0.943)#94 | 0.22%(+1.41)#389 |
| 95. | Green Island | 1.62% | 0.69%(+0.932)#95 | 0.22%(+1.40)#390 |
| 96. | Melville | 1.59% | 0.69%(+0.907)#96 | 0.22%(+1.37)#400 |
| 97. | Flower Hill | 1.59% | 0.69%(+0.902)#97 | 0.22%(+1.37)#404 |
| 98. | Lynbrook | 1.58% | 0.69%(+0.896)#98 | 0.22%(+1.36)#405 |
| 99. | Peekskill | 1.57% | 0.69%(+0.885)#99 | 0.22%(+1.35)#408 |
| 100. | Walton Park | 1.57% | 0.69%(+0.885)#100 | 0.22%(+1.35)#409 |
Common Questions
What are the Top 10 Cities with the Highest Percentage of Immigrants from Southern Europe in New York?
Top 10 Cities with the Highest Percentage of Immigrants from Southern Europe in New York are:
#1
100.00%
#2
8.93%
#3
8.72%
#4
8.29%
#5
7.91%
#6
7.23%
#7
5.98%
#8
5.39%
#9
5.12%
#10
4.97%
What city has the Highest Percentage of Immigrants from Southern Europe in New York?
Saltaire has the Highest Percentage of Immigrants from Southern Europe in New York with 100.00%.
What is the Percentage of Immigrants from Southern Europe in the State of New York?
Percentage of Immigrants from Southern Europe in New York is 0.69%.
What is the Percentage of Immigrants from Southern Europe in the United States?
Percentage of Immigrants from Southern Europe in the United States is 0.22%.