Cities with the Highest Percentage of Immigrants from Southern Europe in South Carolina
RELATED REPORTS & OPTIONS
Southern Europe
South Carolina
Compare Cities
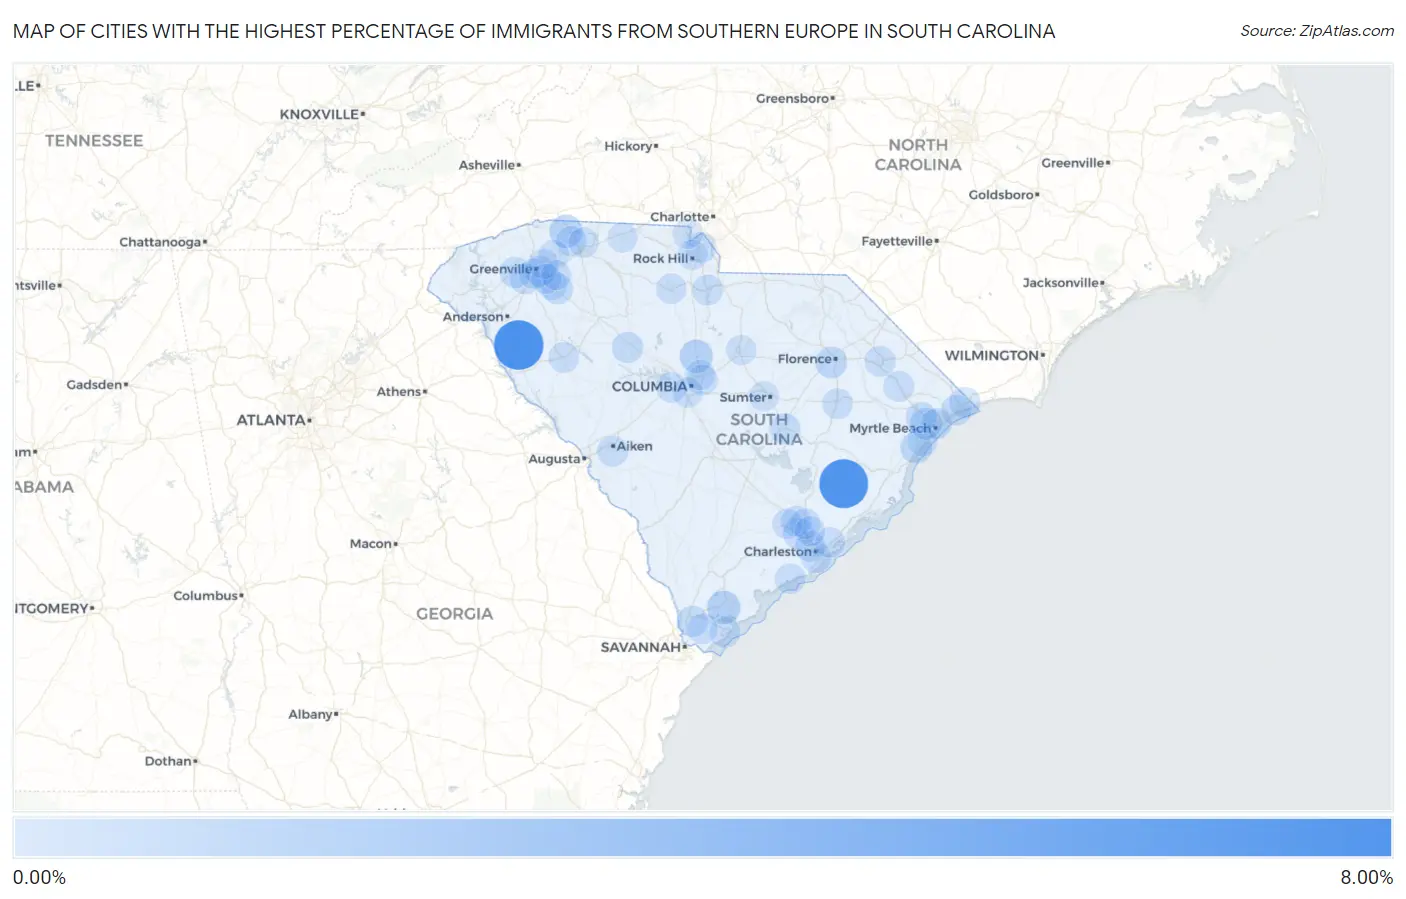
Map of Cities with the Highest Percentage of Immigrants from Southern Europe in South Carolina
0.00%
8.00%
Cities with the Highest Percentage of Immigrants from Southern Europe in South Carolina
| City | Southern Europe | vs State | vs National | |
| 1. | Antreville | 6.64% | 0.089%(+6.55)#1 | 0.22%(+6.42)#49 |
| 2. | Jamestown | 6.41% | 0.089%(+6.32)#2 | 0.22%(+6.19)#53 |
| 3. | Baxter | 1.43% | 0.089%(+1.34)#3 | 0.22%(+1.21)#461 |
| 4. | Shell Point | 1.09% | 0.089%(+0.997)#4 | 0.22%(+0.866)#695 |
| 5. | Blythewood | 1.04% | 0.089%(+0.954)#5 | 0.22%(+0.823)#739 |
| 6. | Campobello | 1.04% | 0.089%(+0.950)#6 | 0.22%(+0.819)#742 |
| 7. | Hilltop | 0.92% | 0.089%(+0.833)#7 | 0.22%(+0.702)#860 |
| 8. | Carolina Forest | 0.81% | 0.089%(+0.725)#8 | 0.22%(+0.594)#983 |
| 9. | Murrells Inlet | 0.57% | 0.089%(+0.484)#9 | 0.22%(+0.353)#1,469 |
| 10. | Forestbrook | 0.57% | 0.089%(+0.477)#10 | 0.22%(+0.346)#1,497 |
| 11. | Florence | 0.53% | 0.089%(+0.437)#11 | 0.22%(+0.306)#1,602 |
| 12. | East Camden | 0.36% | 0.089%(+0.274)#12 | 0.22%(+0.143)#2,173 |
| 13. | North Charleston | 0.34% | 0.089%(+0.252)#13 | 0.22%(+0.121)#2,289 |
| 14. | Fountain Inn | 0.33% | 0.089%(+0.239)#14 | 0.22%(+0.108)#2,363 |
| 15. | Newberry | 0.32% | 0.089%(+0.229)#15 | 0.22%(+0.098)#2,410 |
| 16. | Red Hill | 0.31% | 0.089%(+0.219)#16 | 0.22%(+0.088)#2,455 |
| 17. | Myrtle Beach | 0.31% | 0.089%(+0.219)#17 | 0.22%(+0.088)#2,456 |
| 18. | Easley | 0.29% | 0.089%(+0.200)#18 | 0.22%(+0.070)#2,552 |
| 19. | Hardeeville | 0.29% | 0.089%(+0.197)#19 | 0.22%(+0.066)#2,573 |
| 20. | Manning | 0.28% | 0.089%(+0.196)#20 | 0.22%(+0.065)#2,579 |
| 21. | Aiken | 0.27% | 0.089%(+0.183)#21 | 0.22%(+0.052)#2,673 |
| 22. | Powdersville | 0.27% | 0.089%(+0.182)#22 | 0.22%(+0.052)#2,674 |
| 23. | Marion | 0.23% | 0.089%(+0.145)#23 | 0.22%(+0.014)#2,923 |
| 24. | Little River | 0.22% | 0.089%(+0.135)#24 | 0.22%(+0.004)#2,999 |
| 25. | Aynor | 0.20% | 0.089%(+0.113)#25 | 0.22%(-0.018)#3,176 |
| 26. | North Myrtle Beach | 0.19% | 0.089%(+0.096)#26 | 0.22%(-0.034)#3,324 |
| 27. | Lake City | 0.18% | 0.089%(+0.092)#27 | 0.22%(-0.039)#3,365 |
| 28. | Charleston | 0.18% | 0.089%(+0.088)#28 | 0.22%(-0.043)#3,406 |
| 29. | Fort Lawn | 0.17% | 0.089%(+0.085)#29 | 0.22%(-0.046)#3,425 |
| 30. | Columbia | 0.15% | 0.089%(+0.056)#30 | 0.22%(-0.075)#3,679 |
| 31. | Seabrook Island | 0.15% | 0.089%(+0.056)#31 | 0.22%(-0.075)#3,681 |
| 32. | James Island | 0.15% | 0.089%(+0.056)#32 | 0.22%(-0.075)#3,683 |
| 33. | Greenwood | 0.14% | 0.089%(+0.048)#33 | 0.22%(-0.082)#3,763 |
| 34. | Inman | 0.13% | 0.089%(+0.045)#34 | 0.22%(-0.086)#3,807 |
| 35. | Fripp Island | 0.13% | 0.089%(+0.041)#35 | 0.22%(-0.090)#3,843 |
| 36. | Goose Creek | 0.12% | 0.089%(+0.035)#36 | 0.22%(-0.096)#3,905 |
| 37. | Greenville | 0.12% | 0.089%(+0.029)#37 | 0.22%(-0.101)#3,993 |
| 38. | Ladson | 0.12% | 0.089%(+0.028)#38 | 0.22%(-0.102)#4,007 |
| 39. | Chester | 0.11% | 0.089%(+0.025)#39 | 0.22%(-0.106)#4,047 |
| 40. | Hilton Head Island | 0.11% | 0.089%(+0.017)#40 | 0.22%(-0.114)#4,119 |
| 41. | Greer | 0.10% | 0.089%(+0.013)#41 | 0.22%(-0.117)#4,157 |
| 42. | Bluffton | 0.099% | 0.089%(+0.010)#42 | 0.22%(-0.121)#4,204 |
| 43. | Fort Mill | 0.096% | 0.089%(+0.007)#43 | 0.22%(-0.124)#4,239 |
| 44. | Summerville | 0.092% | 0.089%(+0.003)#44 | 0.22%(-0.128)#4,290 |
| 45. | Simpsonville | 0.091% | 0.089%(+0.002)#45 | 0.22%(-0.129)#4,307 |
| 46. | Dunean | 0.088% | 0.089%(-0.002)#46 | 0.22%(-0.133)#4,348 |
| 47. | Lexington | 0.080% | 0.089%(-0.009)#47 | 0.22%(-0.140)#4,436 |
| 48. | Mount Pleasant | 0.073% | 0.089%(-0.017)#48 | 0.22%(-0.147)#4,539 |
| 49. | Hanahan | 0.072% | 0.089%(-0.017)#49 | 0.22%(-0.148)#4,542 |
| 50. | Cayce | 0.058% | 0.089%(-0.031)#50 | 0.22%(-0.162)#4,708 |
| 51. | Dentsville | 0.055% | 0.089%(-0.034)#51 | 0.22%(-0.165)#4,744 |
| 52. | Garden City | 0.046% | 0.089%(-0.043)#52 | 0.22%(-0.174)#4,851 |
| 53. | Sumter | 0.044% | 0.089%(-0.045)#53 | 0.22%(-0.176)#4,876 |
| 54. | Rock Hill | 0.043% | 0.089%(-0.046)#54 | 0.22%(-0.177)#4,889 |
| 55. | Lake Wylie | 0.042% | 0.089%(-0.047)#55 | 0.22%(-0.178)#4,902 |
| 56. | Boiling Springs | 0.036% | 0.089%(-0.053)#56 | 0.22%(-0.184)#4,971 |
| 57. | Wade Hampton | 0.029% | 0.089%(-0.061)#57 | 0.22%(-0.192)#5,061 |
| 58. | Mauldin | 0.028% | 0.089%(-0.061)#58 | 0.22%(-0.192)#5,070 |
| 59. | Five Forks | 0.016% | 0.089%(-0.073)#59 | 0.22%(-0.204)#5,208 |
| 60. | Camden | 0.013% | 0.089%(-0.076)#60 | 0.22%(-0.207)#5,234 |
| 61. | Gaffney | 0.0079% | 0.089%(-0.081)#61 | 0.22%(-0.212)#5,274 |
Common Questions
What are the Top 10 Cities with the Highest Percentage of Immigrants from Southern Europe in South Carolina?
Top 10 Cities with the Highest Percentage of Immigrants from Southern Europe in South Carolina are:
#1
6.64%
#2
6.41%
#3
1.09%
#4
1.04%
#5
1.04%
#6
0.57%
#7
0.57%
#8
0.53%
#9
0.34%
#10
0.33%
What city has the Highest Percentage of Immigrants from Southern Europe in South Carolina?
Antreville has the Highest Percentage of Immigrants from Southern Europe in South Carolina with 6.64%.
What is the Percentage of Immigrants from Southern Europe in the State of South Carolina?
Percentage of Immigrants from Southern Europe in South Carolina is 0.089%.
What is the Percentage of Immigrants from Southern Europe in the United States?
Percentage of Immigrants from Southern Europe in the United States is 0.22%.