Cities with the Most Immigrants from Oceania in Oklahoma
RELATED REPORTS & OPTIONS
Oceania
Oklahoma
Compare Cities
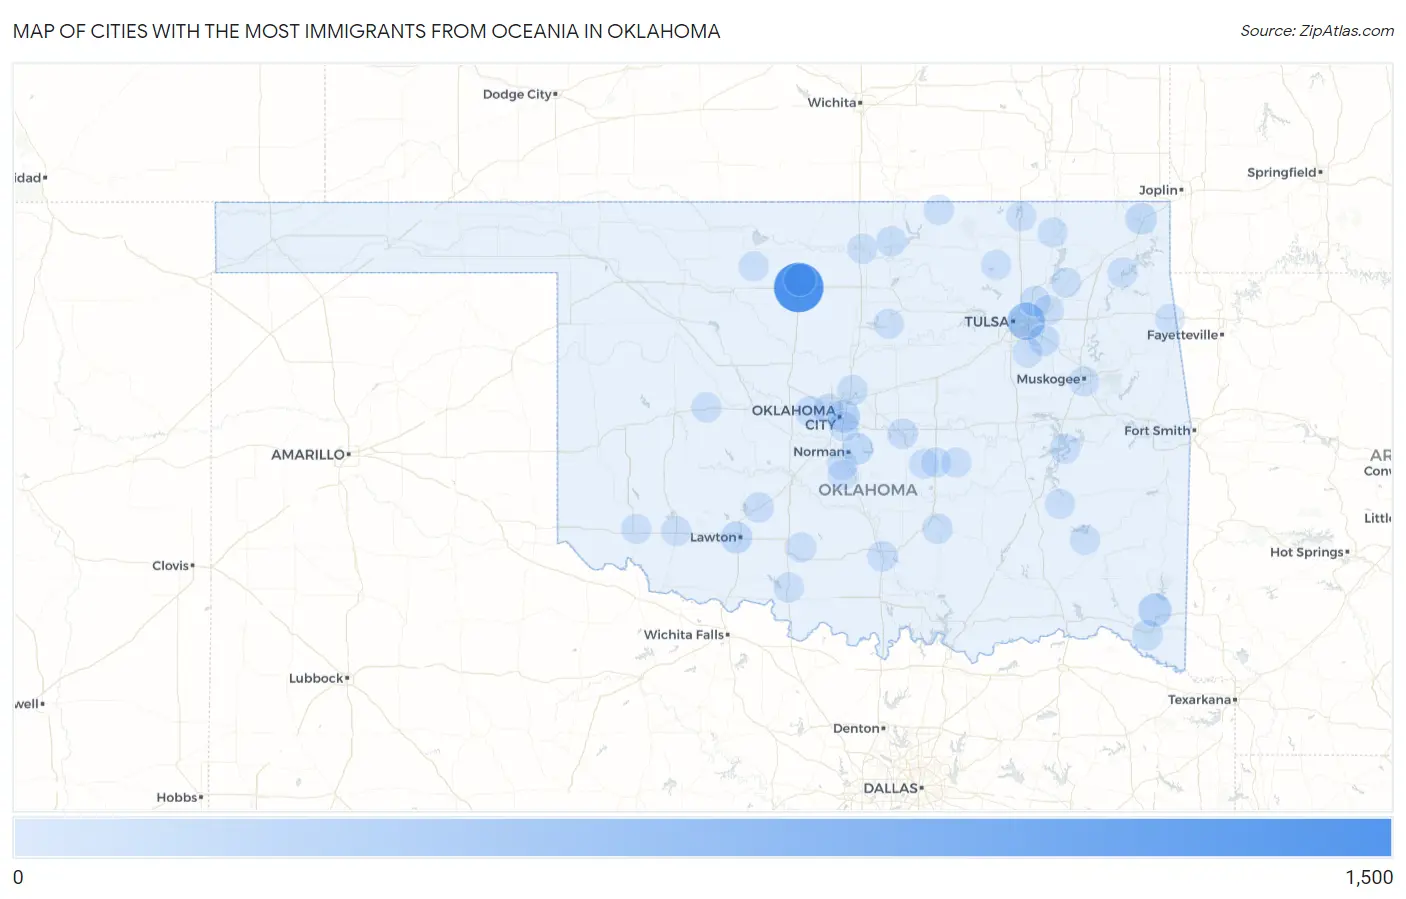
Map of Cities with the Most Immigrants from Oceania in Oklahoma
0
1,500
Cities with the Most Immigrants from Oceania in Oklahoma
| City | Oceania | vs State | vs National | |
| 1. | Enid | 1,321 | 3,409(38.75%)#1 | 293,459(0.45%)#24 |
| 2. | Tulsa | 472 | 3,409(13.85%)#2 | 293,459(0.16%)#79 |
| 3. | Broken Bow | 197 | 3,409(5.78%)#3 | 293,459(0.07%)#247 |
| 4. | Oklahoma City | 160 | 3,409(4.69%)#4 | 293,459(0.05%)#312 |
| 5. | North Enid | 125 | 3,409(3.67%)#5 | 293,459(0.04%)#398 |
| 6. | Lawton | 107 | 3,409(3.14%)#6 | 293,459(0.04%)#447 |
| 7. | Miami | 91 | 3,409(2.67%)#7 | 293,459(0.03%)#524 |
| 8. | Norman | 88 | 3,409(2.58%)#8 | 293,459(0.03%)#542 |
| 9. | Broken Arrow | 70 | 3,409(2.05%)#9 | 293,459(0.02%)#629 |
| 10. | Owasso | 47 | 3,409(1.38%)#10 | 293,459(0.02%)#859 |
| 11. | Davis | 32 | 3,409(0.94%)#11 | 293,459(0.01%)#1,147 |
| 12. | Idabel | 31 | 3,409(0.91%)#12 | 293,459(0.01%)#1,166 |
| 13. | Shawnee | 30 | 3,409(0.88%)#13 | 293,459(0.01%)#1,180 |
| 14. | Edmond | 29 | 3,409(0.85%)#14 | 293,459(0.01%)#1,203 |
| 15. | Ponca City | 17 | 3,409(0.50%)#15 | 293,459(0.01%)#1,680 |
| 16. | Ada | 15 | 3,409(0.44%)#16 | 293,459(0.01%)#1,803 |
| 17. | Yukon | 14 | 3,409(0.41%)#17 | 293,459(0.00%)#1,867 |
| 18. | Warr Acres | 13 | 3,409(0.38%)#18 | 293,459(0.00%)#1,958 |
| 19. | Fletcher | 12 | 3,409(0.35%)#19 | 293,459(0.00%)#2,083 |
| 20. | Bixby | 11 | 3,409(0.32%)#20 | 293,459(0.00%)#2,113 |
| 21. | Goldsby | 11 | 3,409(0.32%)#21 | 293,459(0.00%)#2,168 |
| 22. | Longtown | 10 | 3,409(0.29%)#22 | 293,459(0.00%)#2,251 |
| 23. | Maud | 10 | 3,409(0.29%)#23 | 293,459(0.00%)#2,264 |
| 24. | Verdigris | 9 | 3,409(0.26%)#24 | 293,459(0.00%)#2,337 |
| 25. | Duncan | 8 | 3,409(0.23%)#25 | 293,459(0.00%)#2,402 |
| 26. | Altus | 8 | 3,409(0.23%)#26 | 293,459(0.00%)#2,406 |
| 27. | Haileyville | 6 | 3,409(0.18%)#27 | 293,459(0.00%)#2,697 |
| 28. | Stillwater | 5 | 3,409(0.15%)#28 | 293,459(0.00%)#2,714 |
| 29. | Muskogee | 5 | 3,409(0.15%)#29 | 293,459(0.00%)#2,721 |
| 30. | Helena | 5 | 3,409(0.15%)#30 | 293,459(0.00%)#2,785 |
| 31. | Clayton | 5 | 3,409(0.15%)#31 | 293,459(0.00%)#2,798 |
| 32. | Snyder | 4 | 3,409(0.12%)#32 | 293,459(0.00%)#2,878 |
| 33. | Foyil | 4 | 3,409(0.12%)#33 | 293,459(0.00%)#2,902 |
| 34. | Weatherford | 3 | 3,409(0.09%)#34 | 293,459(0.00%)#2,926 |
| 35. | Barnsdall | 3 | 3,409(0.09%)#35 | 293,459(0.00%)#2,977 |
| 36. | Copan | 3 | 3,409(0.09%)#36 | 293,459(0.00%)#2,981 |
| 37. | Washington | 3 | 3,409(0.09%)#37 | 293,459(0.00%)#2,990 |
| 38. | Delaware | 3 | 3,409(0.09%)#38 | 293,459(0.00%)#3,008 |
| 39. | Wewoka | 2 | 3,409(0.06%)#39 | 293,459(0.00%)#3,039 |
| 40. | Tonkawa | 2 | 3,409(0.06%)#40 | 293,459(0.00%)#3,041 |
| 41. | West Siloam Springs | 2 | 3,409(0.06%)#41 | 293,459(0.00%)#3,061 |
| 42. | Valley Brook | 2 | 3,409(0.06%)#42 | 293,459(0.00%)#3,077 |
| 43. | Grand Lake Towne | 2 | 3,409(0.06%)#43 | 293,459(0.00%)#3,115 |
| 44. | Bowlegs | 1 | 3,409(0.03%)#44 | 293,459(0.00%)#3,184 |
| 45. | Addington | 1 | 3,409(0.03%)#45 | 293,459(0.00%)#3,203 |
| 46. | Grainola | 1 | 3,409(0.03%)#46 | 293,459(0.00%)#3,204 |
Common Questions
What are the Top 10 Cities with the Most Immigrants from Oceania in Oklahoma?
Top 10 Cities with the Most Immigrants from Oceania in Oklahoma are:
#1
1,321
#2
472
#3
197
#4
160
#5
125
#6
107
#7
91
#8
88
#9
70
#10
47
What city has the Most Immigrants from Oceania in Oklahoma?
Enid has the Most Immigrants from Oceania in Oklahoma with 1,321.
What is the Total Immigrants from Oceania in the State of Oklahoma?
Total Immigrants from Oceania in Oklahoma is 3,409.
What is the Total Immigrants from Oceania in the United States?
Total Immigrants from Oceania in the United States is 293,459.