Cities with the Most Immigrants from Oceania in Iowa
RELATED REPORTS & OPTIONS
Oceania
Iowa
Compare Cities
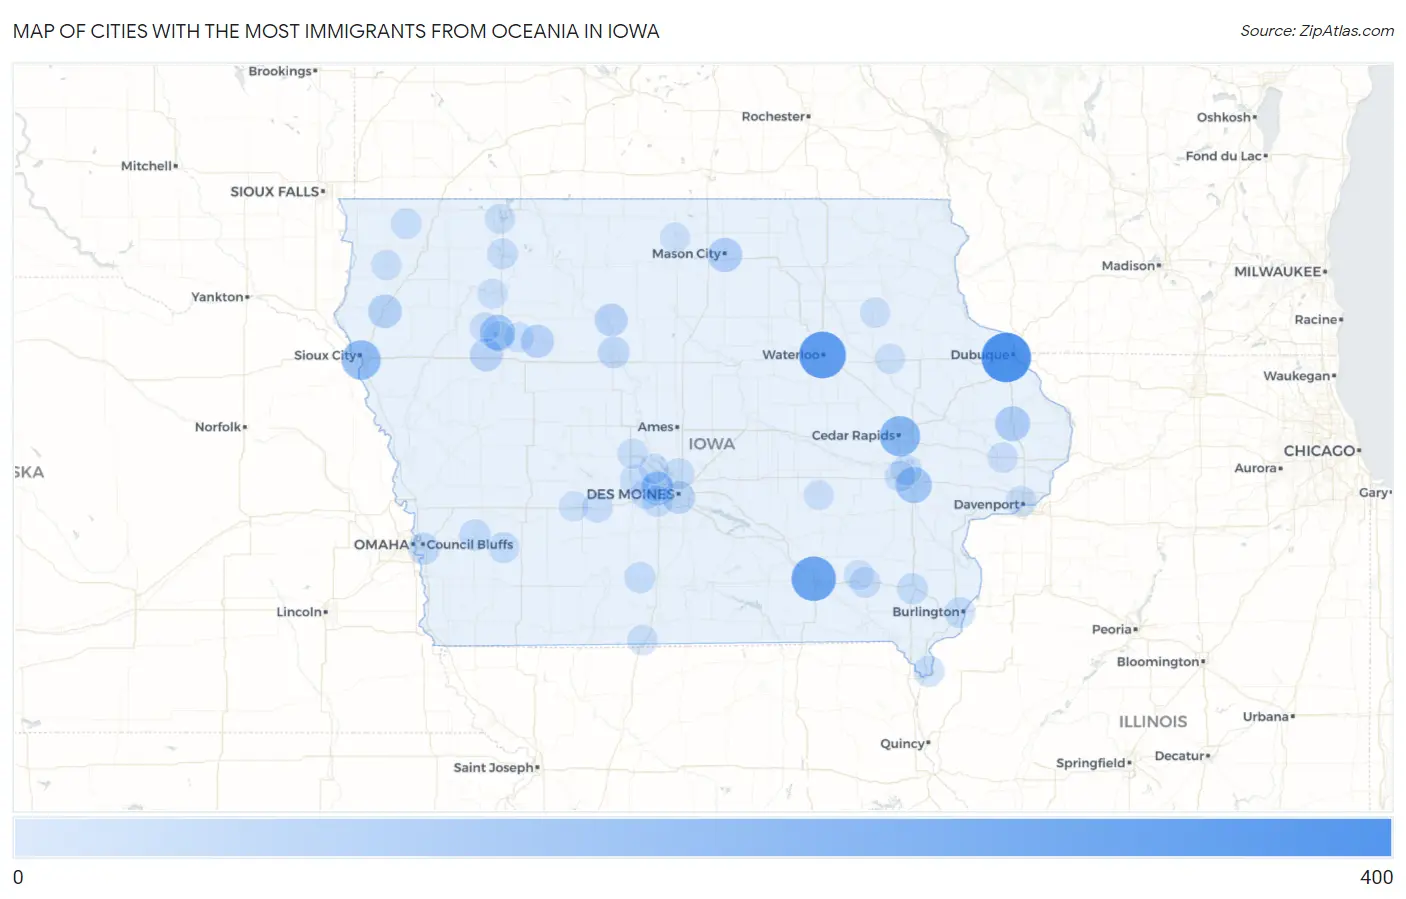
Map of Cities with the Most Immigrants from Oceania in Iowa
0
400
Cities with the Most Immigrants from Oceania in Iowa
| City | Oceania | vs State | vs National | |
| 1. | Dubuque | 394 | 2,576(15.30%)#1 | 293,459(0.13%)#102 |
| 2. | Waterloo | 337 | 2,576(13.08%)#2 | 293,459(0.11%)#133 |
| 3. | Ottumwa | 289 | 2,576(11.22%)#3 | 293,459(0.10%)#166 |
| 4. | Cedar Rapids | 202 | 2,576(7.84%)#4 | 293,459(0.07%)#240 |
| 5. | Sioux City | 180 | 2,576(6.99%)#5 | 293,459(0.06%)#273 |
| 6. | Iowa City | 116 | 2,576(4.50%)#6 | 293,459(0.04%)#419 |
| 7. | Storm Lake | 100 | 2,576(3.88%)#7 | 293,459(0.03%)#481 |
| 8. | Maquoketa | 92 | 2,576(3.57%)#8 | 293,459(0.03%)#519 |
| 9. | Mason City | 81 | 2,576(3.14%)#9 | 293,459(0.03%)#576 |
| 10. | Le Mars | 66 | 2,576(2.56%)#10 | 293,459(0.02%)#665 |
| 11. | Clive | 64 | 2,576(2.48%)#11 | 293,459(0.02%)#690 |
| 12. | Fonda | 56 | 2,576(2.17%)#12 | 293,459(0.02%)#768 |
| 13. | Dakota City | 51 | 2,576(1.98%)#13 | 293,459(0.02%)#820 |
| 14. | Schaller | 51 | 2,576(1.98%)#14 | 293,459(0.02%)#821 |
| 15. | Des Moines | 48 | 2,576(1.86%)#15 | 293,459(0.02%)#845 |
| 16. | Council Bluffs | 34 | 2,576(1.32%)#16 | 293,459(0.01%)#1,077 |
| 17. | Fort Dodge | 32 | 2,576(1.24%)#17 | 293,459(0.01%)#1,137 |
| 18. | Oakland | 25 | 2,576(0.97%)#18 | 293,459(0.01%)#1,347 |
| 19. | Griswold | 20 | 2,576(0.78%)#19 | 293,459(0.01%)#1,556 |
| 20. | West Des Moines | 19 | 2,576(0.74%)#20 | 293,459(0.01%)#1,560 |
| 21. | Burlington | 19 | 2,576(0.74%)#21 | 293,459(0.01%)#1,575 |
| 22. | Keokuk | 19 | 2,576(0.74%)#22 | 293,459(0.01%)#1,584 |
| 23. | Murray | 19 | 2,576(0.74%)#23 | 293,459(0.01%)#1,608 |
| 24. | Mount Pleasant | 18 | 2,576(0.70%)#24 | 293,459(0.01%)#1,645 |
| 25. | Waukee | 17 | 2,576(0.66%)#25 | 293,459(0.01%)#1,679 |
| 26. | North Liberty | 16 | 2,576(0.62%)#26 | 293,459(0.01%)#1,742 |
| 27. | Tiffin | 16 | 2,576(0.62%)#27 | 293,459(0.01%)#1,763 |
| 28. | Ankeny | 15 | 2,576(0.58%)#28 | 293,459(0.01%)#1,780 |
| 29. | Davenport | 13 | 2,576(0.50%)#29 | 293,459(0.00%)#1,922 |
| 30. | George | 13 | 2,576(0.50%)#30 | 293,459(0.00%)#1,997 |
| 31. | Fairfield | 12 | 2,576(0.47%)#31 | 293,459(0.00%)#2,045 |
| 32. | Urbandale | 10 | 2,576(0.39%)#32 | 293,459(0.00%)#2,189 |
| 33. | Spencer | 10 | 2,576(0.39%)#33 | 293,459(0.00%)#2,220 |
| 34. | Lakeside | 10 | 2,576(0.39%)#34 | 293,459(0.00%)#2,266 |
| 35. | Stuart | 7 | 2,576(0.27%)#35 | 293,459(0.00%)#2,566 |
| 36. | Dallas Center | 6 | 2,576(0.23%)#36 | 293,459(0.00%)#2,681 |
| 37. | Calamus | 5 | 2,576(0.19%)#37 | 293,459(0.00%)#2,804 |
| 38. | Sioux Center | 4 | 2,576(0.16%)#38 | 293,459(0.00%)#2,847 |
| 39. | Lamoni | 4 | 2,576(0.16%)#39 | 293,459(0.00%)#2,862 |
| 40. | Alta | 4 | 2,576(0.16%)#40 | 293,459(0.00%)#2,866 |
| 41. | Granger | 4 | 2,576(0.16%)#41 | 293,459(0.00%)#2,869 |
| 42. | Bouton | 4 | 2,576(0.16%)#42 | 293,459(0.00%)#2,914 |
| 43. | Maynard | 3 | 2,576(0.12%)#43 | 293,459(0.00%)#3,001 |
| 44. | Forest City | 2 | 2,576(0.08%)#44 | 293,459(0.00%)#3,037 |
| 45. | Newell | 2 | 2,576(0.08%)#45 | 293,459(0.00%)#3,074 |
| 46. | Wahpeton | 2 | 2,576(0.08%)#46 | 293,459(0.00%)#3,105 |
| 47. | Winthrop | 1 | 2,576(0.04%)#47 | 293,459(0.00%)#3,160 |
| 48. | Casey | 1 | 2,576(0.04%)#48 | 293,459(0.00%)#3,183 |
| 49. | Deep River | 1 | 2,576(0.04%)#49 | 293,459(0.00%)#3,189 |
| 50. | Maharishi Vedic City | 1 | 2,576(0.04%)#50 | 293,459(0.00%)#3,191 |
| 51. | Linn Grove | 1 | 2,576(0.04%)#51 | 293,459(0.00%)#3,201 |
Common Questions
What are the Top 10 Cities with the Most Immigrants from Oceania in Iowa?
Top 10 Cities with the Most Immigrants from Oceania in Iowa are:
#1
394
#2
337
#3
289
#4
202
#5
180
#6
116
#7
100
#8
92
#9
81
#10
66
What city has the Most Immigrants from Oceania in Iowa?
Dubuque has the Most Immigrants from Oceania in Iowa with 394.
What is the Total Immigrants from Oceania in the State of Iowa?
Total Immigrants from Oceania in Iowa is 2,576.
What is the Total Immigrants from Oceania in the United States?
Total Immigrants from Oceania in the United States is 293,459.