Cities with the Most Immigrants from Oceania in Minnesota
RELATED REPORTS & OPTIONS
Oceania
Minnesota
Compare Cities
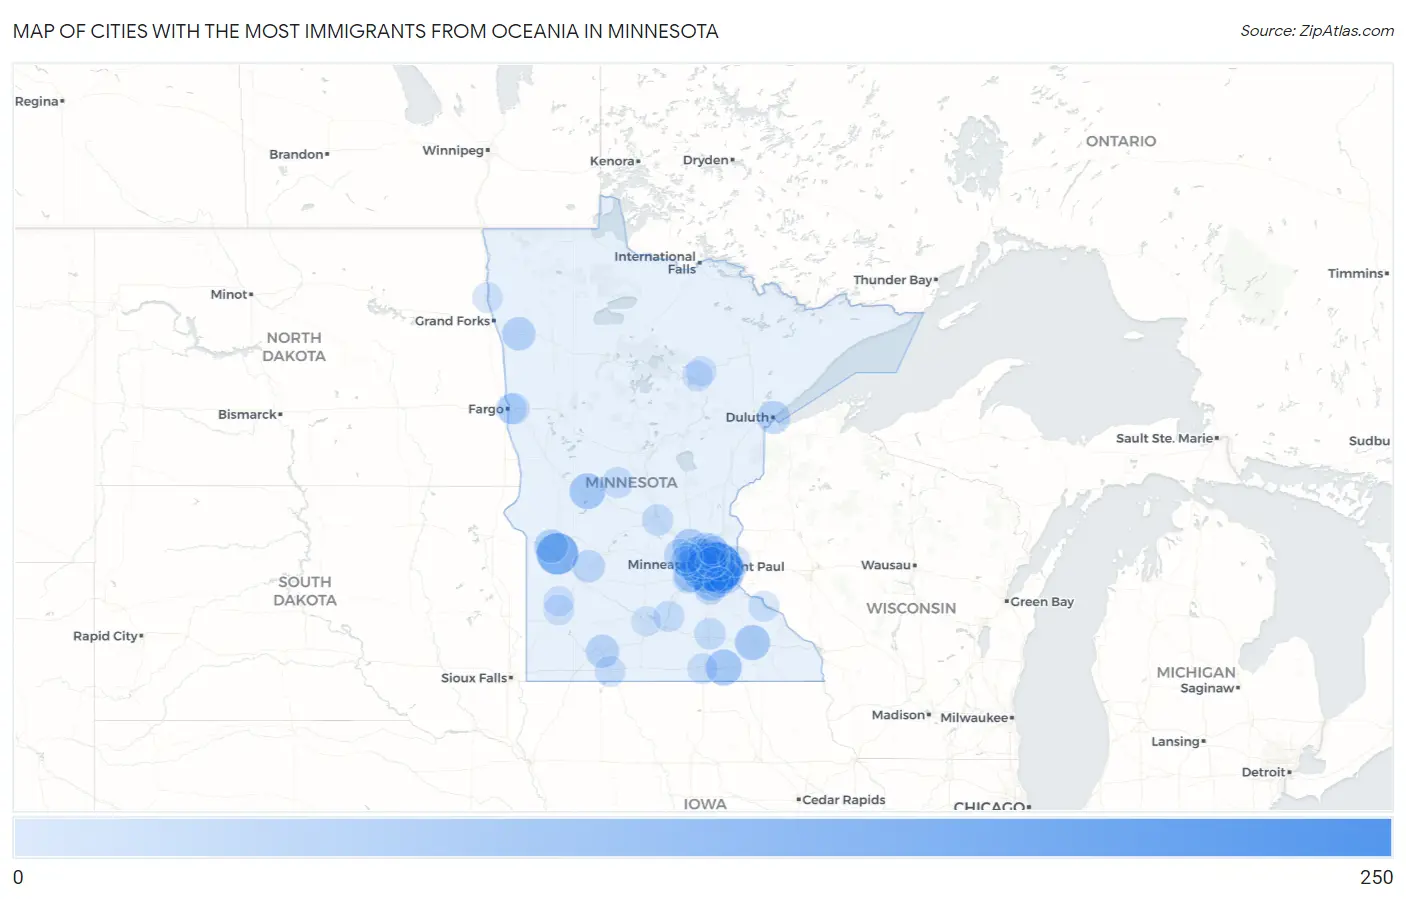
Map of Cities with the Most Immigrants from Oceania in Minnesota
0
250
Cities with the Most Immigrants from Oceania in Minnesota
| City | Oceania | vs State | vs National | |
| 1. | St Paul | 221 | 1,927(11.47%)#1 | 293,459(0.08%)#220 |
| 2. | Minneapolis | 147 | 1,927(7.63%)#2 | 293,459(0.05%)#339 |
| 3. | Milan | 128 | 1,927(6.64%)#3 | 293,459(0.04%)#390 |
| 4. | Edina | 115 | 1,927(5.97%)#4 | 293,459(0.04%)#421 |
| 5. | Apple Valley | 66 | 1,927(3.43%)#5 | 293,459(0.02%)#664 |
| 6. | Austin | 64 | 1,927(3.32%)#6 | 293,459(0.02%)#687 |
| 7. | Alexandria | 62 | 1,927(3.22%)#7 | 293,459(0.02%)#705 |
| 8. | Inver Grove Heights | 58 | 1,927(3.01%)#8 | 293,459(0.02%)#747 |
| 9. | Rochester | 54 | 1,927(2.80%)#9 | 293,459(0.02%)#780 |
| 10. | Woodbury | 53 | 1,927(2.75%)#10 | 293,459(0.02%)#791 |
| 11. | Rogers | 52 | 1,927(2.70%)#11 | 293,459(0.02%)#810 |
| 12. | Maple Grove | 41 | 1,927(2.13%)#12 | 293,459(0.01%)#949 |
| 13. | Chanhassen | 41 | 1,927(2.13%)#13 | 293,459(0.01%)#953 |
| 14. | Bloomington | 39 | 1,927(2.02%)#14 | 293,459(0.01%)#978 |
| 15. | Appleton | 39 | 1,927(2.02%)#15 | 293,459(0.01%)#998 |
| 16. | Crookston | 35 | 1,927(1.82%)#16 | 293,459(0.01%)#1,069 |
| 17. | Windom | 34 | 1,927(1.76%)#17 | 293,459(0.01%)#1,094 |
| 18. | Duluth | 32 | 1,927(1.66%)#18 | 293,459(0.01%)#1,126 |
| 19. | Plymouth | 32 | 1,927(1.66%)#19 | 293,459(0.01%)#1,127 |
| 20. | Cottage Grove | 28 | 1,927(1.45%)#20 | 293,459(0.01%)#1,236 |
| 21. | Minnetonka | 25 | 1,927(1.30%)#21 | 293,459(0.01%)#1,314 |
| 22. | Clara City | 25 | 1,927(1.30%)#22 | 293,459(0.01%)#1,348 |
| 23. | New Hope | 24 | 1,927(1.25%)#23 | 293,459(0.01%)#1,361 |
| 24. | Coon Rapids | 23 | 1,927(1.19%)#24 | 293,459(0.01%)#1,392 |
| 25. | St Paul Park | 23 | 1,927(1.19%)#25 | 293,459(0.01%)#1,415 |
| 26. | Rockford | 21 | 1,927(1.09%)#26 | 293,459(0.01%)#1,493 |
| 27. | Lakeville | 20 | 1,927(1.04%)#27 | 293,459(0.01%)#1,517 |
| 28. | Chaska | 20 | 1,927(1.04%)#28 | 293,459(0.01%)#1,529 |
| 29. | Dilworth | 17 | 1,927(0.88%)#29 | 293,459(0.01%)#1,701 |
| 30. | Vadnais Heights | 15 | 1,927(0.78%)#30 | 293,459(0.01%)#1,812 |
| 31. | St Cloud | 14 | 1,927(0.73%)#31 | 293,459(0.00%)#1,855 |
| 32. | Owatonna | 14 | 1,927(0.73%)#32 | 293,459(0.00%)#1,866 |
| 33. | Falcon Heights | 14 | 1,927(0.73%)#33 | 293,459(0.00%)#1,897 |
| 34. | Orono | 12 | 1,927(0.62%)#34 | 293,459(0.00%)#2,048 |
| 35. | St. John's University | 12 | 1,927(0.62%)#35 | 293,459(0.00%)#2,079 |
| 36. | Eagan | 11 | 1,927(0.57%)#36 | 293,459(0.00%)#2,094 |
| 37. | Roseville | 11 | 1,927(0.57%)#37 | 293,459(0.00%)#2,104 |
| 38. | Maplewood | 10 | 1,927(0.52%)#38 | 293,459(0.00%)#2,191 |
| 39. | St Peter | 10 | 1,927(0.52%)#39 | 293,459(0.00%)#2,219 |
| 40. | Long Prairie | 10 | 1,927(0.52%)#40 | 293,459(0.00%)#2,245 |
| 41. | Bayport | 9 | 1,927(0.47%)#41 | 293,459(0.00%)#2,345 |
| 42. | St Louis Park | 8 | 1,927(0.42%)#42 | 293,459(0.00%)#2,384 |
| 43. | Jackson | 8 | 1,927(0.42%)#43 | 293,459(0.00%)#2,445 |
| 44. | Brooklyn Park | 7 | 1,927(0.36%)#44 | 293,459(0.00%)#2,478 |
| 45. | Golden Valley | 7 | 1,927(0.36%)#45 | 293,459(0.00%)#2,505 |
| 46. | Arden Hills | 7 | 1,927(0.36%)#46 | 293,459(0.00%)#2,526 |
| 47. | Lake City | 7 | 1,927(0.36%)#47 | 293,459(0.00%)#2,543 |
| 48. | Lauderdale | 7 | 1,927(0.36%)#48 | 293,459(0.00%)#2,556 |
| 49. | Blaine | 6 | 1,927(0.31%)#49 | 293,459(0.00%)#2,594 |
| 50. | Albert Lea | 6 | 1,927(0.31%)#50 | 293,459(0.00%)#2,613 |
| 51. | Lexington | 6 | 1,927(0.31%)#51 | 293,459(0.00%)#2,674 |
| 52. | Crown College | 6 | 1,927(0.31%)#52 | 293,459(0.00%)#2,703 |
| 53. | Moorhead | 5 | 1,927(0.26%)#53 | 293,459(0.00%)#2,716 |
| 54. | Rosemount | 5 | 1,927(0.26%)#54 | 293,459(0.00%)#2,723 |
| 55. | Oslo | 4 | 1,927(0.21%)#55 | 293,459(0.00%)#2,909 |
| 56. | Coleraine | 3 | 1,927(0.16%)#56 | 293,459(0.00%)#2,957 |
| 57. | Maple Plain | 3 | 1,927(0.16%)#57 | 293,459(0.00%)#2,960 |
| 58. | Loretto | 3 | 1,927(0.16%)#58 | 293,459(0.00%)#2,986 |
| 59. | Taconite | 3 | 1,927(0.16%)#59 | 293,459(0.00%)#2,994 |
| 60. | Lynd | 3 | 1,927(0.16%)#60 | 293,459(0.00%)#2,998 |
| 61. | Ghent | 3 | 1,927(0.16%)#61 | 293,459(0.00%)#3,003 |
| 62. | Courtland | 1 | 1,927(0.05%)#62 | 293,459(0.00%)#3,164 |
Common Questions
What are the Top 10 Cities with the Most Immigrants from Oceania in Minnesota?
Top 10 Cities with the Most Immigrants from Oceania in Minnesota are:
#1
221
#2
147
#3
128
#4
115
#5
66
#6
64
#7
62
#8
58
#9
54
#10
53
What city has the Most Immigrants from Oceania in Minnesota?
St Paul has the Most Immigrants from Oceania in Minnesota with 221.
What is the Total Immigrants from Oceania in the State of Minnesota?
Total Immigrants from Oceania in Minnesota is 1,927.
What is the Total Immigrants from Oceania in the United States?
Total Immigrants from Oceania in the United States is 293,459.