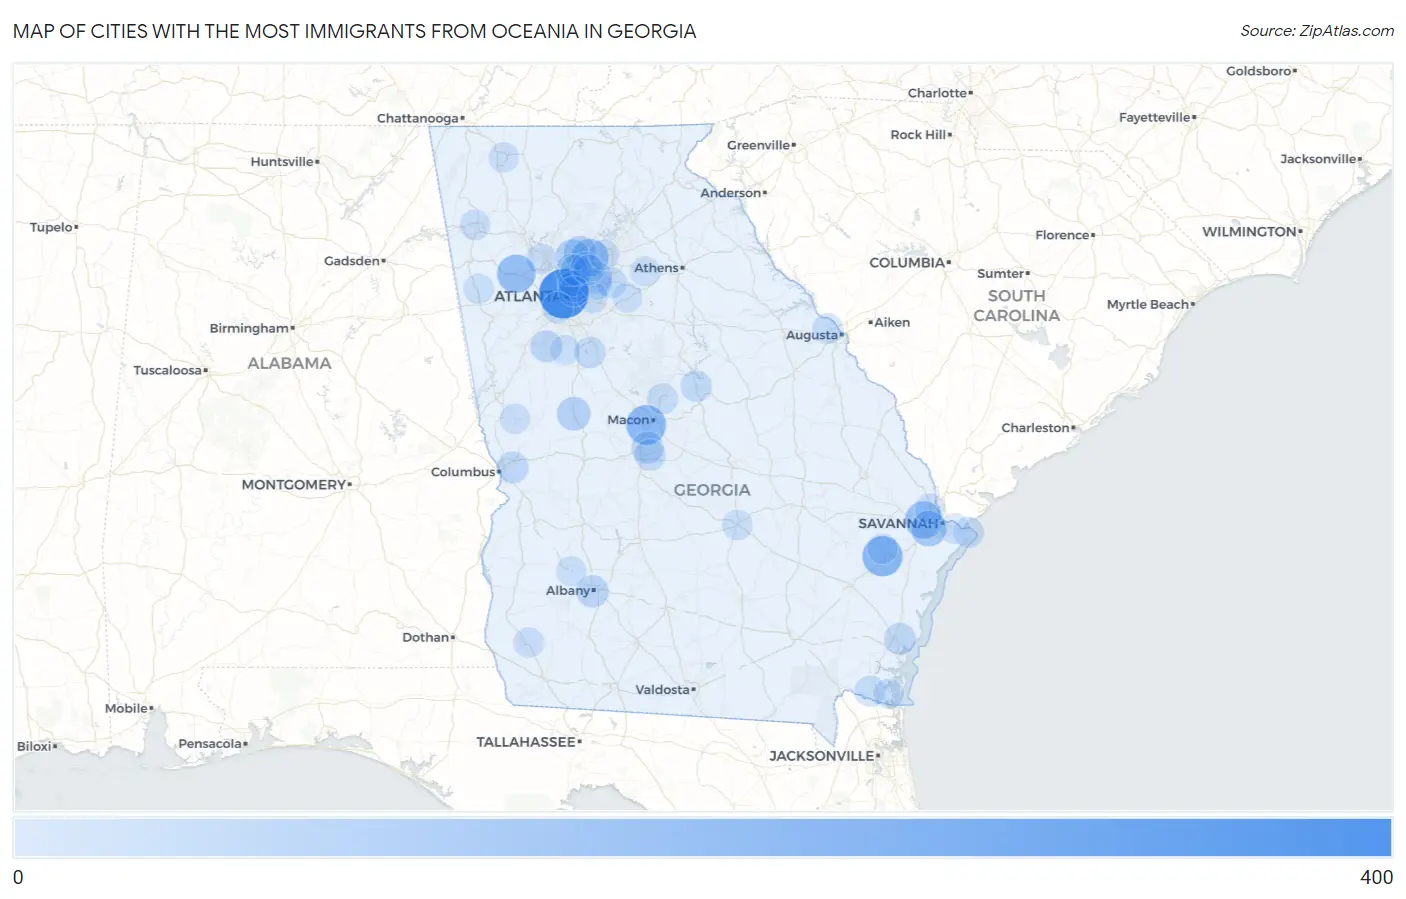
Cities with the Most Immigrants from Oceania in Georgia
RELATED REPORTS & OPTIONS
Oceania
Georgia
Compare Cities
Map of Cities with the Most Immigrants from Oceania in Georgia
0
400
Cities with the Most Immigrants from Oceania in Georgia
| City | Oceania | vs State | vs National | |
| 1. | Atlanta | 383 | 3,894(9.84%)#1 | 293,459(0.13%)#110 |
| 2. | Hinesville | 195 | 3,894(5.01%)#2 | 293,459(0.07%)#251 |
| 3. | Macon Bibb County | 184 | 3,894(4.73%)#3 | 293,459(0.06%)#266 |
| 4. | Dallas | 159 | 3,894(4.08%)#4 | 293,459(0.05%)#315 |
| 5. | Pooler | 138 | 3,894(3.54%)#5 | 293,459(0.05%)#361 |
| 6. | Johns Creek | 132 | 3,894(3.39%)#6 | 293,459(0.04%)#378 |
| 7. | Augusta-Richmond County Consolidated Government (Balance) | 107 | 3,894(2.75%)#7 | 293,459(0.04%)#446 |
| 8. | Savannah | 101 | 3,894(2.59%)#8 | 293,459(0.03%)#472 |
| 9. | Roswell | 71 | 3,894(1.82%)#9 | 293,459(0.02%)#625 |
| 10. | Thomaston | 65 | 3,894(1.67%)#10 | 293,459(0.02%)#674 |
| 11. | Alpharetta | 58 | 3,894(1.49%)#11 | 293,459(0.02%)#744 |
| 12. | Albany | 43 | 3,894(1.10%)#12 | 293,459(0.01%)#910 |
| 13. | Centerville | 40 | 3,894(1.03%)#13 | 293,459(0.01%)#971 |
| 14. | Brookhaven | 38 | 3,894(0.98%)#14 | 293,459(0.01%)#1,003 |
| 15. | Sandy Springs | 36 | 3,894(0.92%)#15 | 293,459(0.01%)#1,037 |
| 16. | Peachtree City | 36 | 3,894(0.92%)#16 | 293,459(0.01%)#1,039 |
| 17. | Columbus | 35 | 3,894(0.90%)#17 | 293,459(0.01%)#1,055 |
| 18. | Lilburn | 34 | 3,894(0.87%)#18 | 293,459(0.01%)#1,088 |
| 19. | Country Club Estates | 32 | 3,894(0.82%)#19 | 293,459(0.01%)#1,143 |
| 20. | North Druid Hills | 27 | 3,894(0.69%)#20 | 293,459(0.01%)#1,270 |
| 21. | Warner Robins | 24 | 3,894(0.62%)#21 | 293,459(0.01%)#1,351 |
| 22. | Mountain Park | 24 | 3,894(0.62%)#22 | 293,459(0.01%)#1,366 |
| 23. | Milledgeville | 23 | 3,894(0.59%)#23 | 293,459(0.01%)#1,403 |
| 24. | Heron Bay | 23 | 3,894(0.59%)#24 | 293,459(0.01%)#1,418 |
| 25. | Dunwoody | 22 | 3,894(0.56%)#25 | 293,459(0.01%)#1,429 |
| 26. | East Point | 19 | 3,894(0.49%)#26 | 293,459(0.01%)#1,569 |
| 27. | Snellville | 16 | 3,894(0.41%)#27 | 293,459(0.01%)#1,739 |
| 28. | Kingsland | 16 | 3,894(0.41%)#28 | 293,459(0.01%)#1,745 |
| 29. | Martinez | 15 | 3,894(0.39%)#29 | 293,459(0.01%)#1,789 |
| 30. | Peachtree Corners | 14 | 3,894(0.36%)#30 | 293,459(0.00%)#1,858 |
| 31. | Gray | 14 | 3,894(0.36%)#31 | 293,459(0.00%)#1,903 |
| 32. | Tybee Island | 13 | 3,894(0.33%)#32 | 293,459(0.00%)#1,988 |
| 33. | Redan | 11 | 3,894(0.28%)#33 | 293,459(0.00%)#2,109 |
| 34. | Athens-Clarke County Unified Government (Balance) | 10 | 3,894(0.26%)#34 | 293,459(0.00%)#2,178 |
| 35. | Rome | 9 | 3,894(0.23%)#35 | 293,459(0.00%)#2,280 |
| 36. | Mcrae Helena | 9 | 3,894(0.23%)#36 | 293,459(0.00%)#2,331 |
| 37. | Norcross | 8 | 3,894(0.21%)#37 | 293,459(0.00%)#2,411 |
| 38. | Kennesaw | 7 | 3,894(0.18%)#38 | 293,459(0.00%)#2,498 |
| 39. | Druid Hills | 7 | 3,894(0.18%)#39 | 293,459(0.00%)#2,532 |
| 40. | Dalton | 6 | 3,894(0.15%)#40 | 293,459(0.00%)#2,601 |
| 41. | Suwanee | 6 | 3,894(0.15%)#41 | 293,459(0.00%)#2,610 |
| 42. | Port Wentworth | 6 | 3,894(0.15%)#42 | 293,459(0.00%)#2,631 |
| 43. | Cusseta Chattahoochee County Unified Government | 6 | 3,894(0.15%)#43 | 293,459(0.00%)#2,636 |
| 44. | Kings Bay Base | 6 | 3,894(0.15%)#44 | 293,459(0.00%)#2,673 |
| 45. | Colquitt | 6 | 3,894(0.15%)#45 | 293,459(0.00%)#2,677 |
| 46. | Fort Stewart | 5 | 3,894(0.13%)#46 | 293,459(0.00%)#2,738 |
| 47. | Buchanan | 5 | 3,894(0.13%)#47 | 293,459(0.00%)#2,788 |
| 48. | Pine Mountain | 4 | 3,894(0.10%)#48 | 293,459(0.00%)#2,875 |
| 49. | Bethlehem | 3 | 3,894(0.08%)#49 | 293,459(0.00%)#2,997 |
| 50. | Sasser | 3 | 3,894(0.08%)#50 | 293,459(0.00%)#3,007 |
| 51. | Walnut Grove | 2 | 3,894(0.05%)#51 | 293,459(0.00%)#3,057 |
| 52. | Talahi Island | 2 | 3,894(0.05%)#52 | 293,459(0.00%)#3,065 |
| 53. | Woolsey | 1 | 3,894(0.03%)#53 | 293,459(0.00%)#3,194 |
Common Questions
What are the Top 10 Cities with the Most Immigrants from Oceania in Georgia?
Top 10 Cities with the Most Immigrants from Oceania in Georgia are:
#1
383
#2
195
#3
184
#4
159
#5
138
#6
132
#7
101
#8
71
#9
65
#10
58
What city has the Most Immigrants from Oceania in Georgia?
Atlanta has the Most Immigrants from Oceania in Georgia with 383.
What is the Total Immigrants from Oceania in the State of Georgia?
Total Immigrants from Oceania in Georgia is 3,894.
What is the Total Immigrants from Oceania in the United States?
Total Immigrants from Oceania in the United States is 293,459.