Cities with the Most Immigrants from Oceania in North Carolina
RELATED REPORTS & OPTIONS
Oceania
North Carolina
Compare Cities
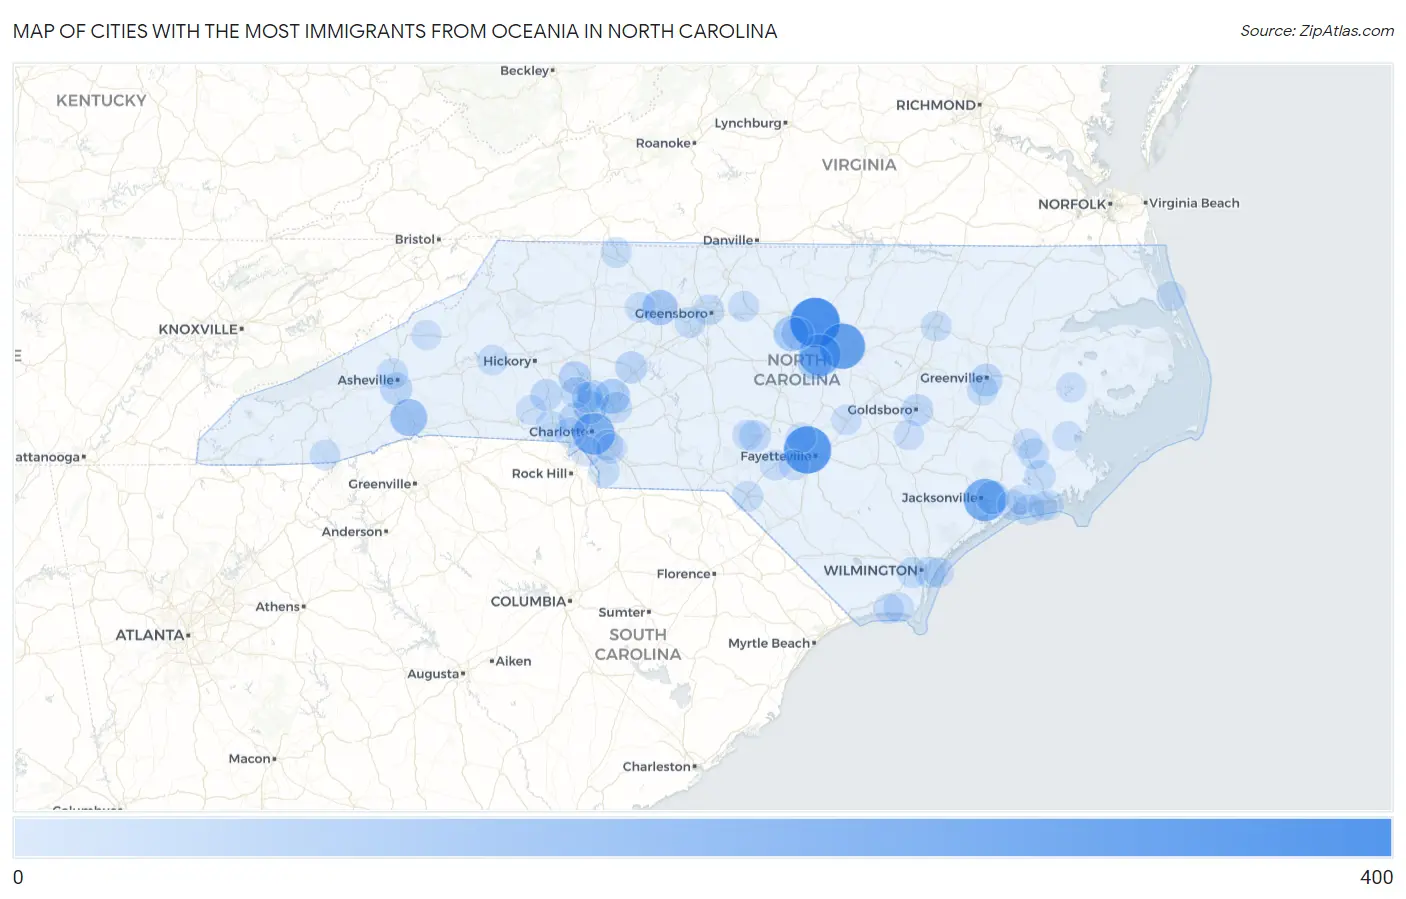
Map of Cities with the Most Immigrants from Oceania in North Carolina
0
400
Cities with the Most Immigrants from Oceania in North Carolina
| City | Oceania | vs State | vs National | |
| 1. | Durham | 308 | 3,499(8.80%)#1 | 293,459(0.10%)#152 |
| 2. | Fayetteville | 273 | 3,499(7.80%)#2 | 293,459(0.09%)#178 |
| 3. | Raleigh | 239 | 3,499(6.83%)#3 | 293,459(0.08%)#209 |
| 4. | Jacksonville | 193 | 3,499(5.52%)#4 | 293,459(0.07%)#255 |
| 5. | Charlotte | 182 | 3,499(5.20%)#5 | 293,459(0.06%)#268 |
| 6. | Cary | 182 | 3,499(5.20%)#6 | 293,459(0.06%)#269 |
| 7. | Hendersonville | 106 | 3,499(3.03%)#7 | 293,459(0.04%)#452 |
| 8. | Winston Salem | 81 | 3,499(2.31%)#8 | 293,459(0.03%)#574 |
| 9. | Carrboro | 77 | 3,499(2.20%)#9 | 293,459(0.03%)#599 |
| 10. | Kannapolis | 72 | 3,499(2.06%)#10 | 293,459(0.02%)#617 |
| 11. | Apex | 65 | 3,499(1.86%)#11 | 293,459(0.02%)#671 |
| 12. | Piney Green | 53 | 3,499(1.51%)#12 | 293,459(0.02%)#798 |
| 13. | Spout Springs | 51 | 3,499(1.46%)#13 | 293,459(0.02%)#816 |
| 14. | Huntersville | 46 | 3,499(1.31%)#14 | 293,459(0.02%)#868 |
| 15. | Lake Norman Of Catawba | 41 | 3,499(1.17%)#15 | 293,459(0.01%)#955 |
| 16. | Chapel Hill | 39 | 3,499(1.11%)#16 | 293,459(0.01%)#980 |
| 17. | Greenville | 37 | 3,499(1.06%)#17 | 293,459(0.01%)#1,020 |
| 18. | Asheville | 34 | 3,499(0.97%)#18 | 293,459(0.01%)#1,074 |
| 19. | Davidson | 34 | 3,499(0.97%)#19 | 293,459(0.01%)#1,087 |
| 20. | Salisbury | 32 | 3,499(0.91%)#20 | 293,459(0.01%)#1,133 |
| 21. | Mount Holly | 30 | 3,499(0.86%)#21 | 293,459(0.01%)#1,185 |
| 22. | Lincolnton | 28 | 3,499(0.80%)#22 | 293,459(0.01%)#1,246 |
| 23. | Goldsboro | 27 | 3,499(0.77%)#23 | 293,459(0.01%)#1,263 |
| 24. | Southern Pines | 25 | 3,499(0.71%)#24 | 293,459(0.01%)#1,328 |
| 25. | Concord | 23 | 3,499(0.66%)#25 | 293,459(0.01%)#1,389 |
| 26. | Gastonia | 20 | 3,499(0.57%)#26 | 293,459(0.01%)#1,514 |
| 27. | Havelock | 19 | 3,499(0.54%)#27 | 293,459(0.01%)#1,578 |
| 28. | Westport | 19 | 3,499(0.54%)#28 | 293,459(0.01%)#1,598 |
| 29. | Wilmington | 17 | 3,499(0.49%)#29 | 293,459(0.01%)#1,666 |
| 30. | Cornelius | 17 | 3,499(0.49%)#30 | 293,459(0.01%)#1,676 |
| 31. | Waxhaw | 17 | 3,499(0.49%)#31 | 293,459(0.01%)#1,682 |
| 32. | Winterville | 15 | 3,499(0.43%)#32 | 293,459(0.01%)#1,817 |
| 33. | Woodfin | 15 | 3,499(0.43%)#33 | 293,459(0.01%)#1,825 |
| 34. | Greensboro | 14 | 3,499(0.40%)#34 | 293,459(0.00%)#1,851 |
| 35. | High Point | 14 | 3,499(0.40%)#35 | 293,459(0.00%)#1,852 |
| 36. | Emerald Isle | 13 | 3,499(0.37%)#36 | 293,459(0.00%)#1,983 |
| 37. | Belville | 13 | 3,499(0.37%)#37 | 293,459(0.00%)#1,987 |
| 38. | Fairfield Harbour | 13 | 3,499(0.37%)#38 | 293,459(0.00%)#1,991 |
| 39. | Briar Chapel | 12 | 3,499(0.34%)#39 | 293,459(0.00%)#2,057 |
| 40. | Swansboro | 12 | 3,499(0.34%)#40 | 293,459(0.00%)#2,062 |
| 41. | Toast | 12 | 3,499(0.34%)#41 | 293,459(0.00%)#2,082 |
| 42. | Laurinburg | 11 | 3,499(0.31%)#42 | 293,459(0.00%)#2,133 |
| 43. | Raeford | 11 | 3,499(0.31%)#43 | 293,459(0.00%)#2,161 |
| 44. | Matthews | 10 | 3,499(0.29%)#44 | 293,459(0.00%)#2,198 |
| 45. | Highlands | 10 | 3,499(0.29%)#45 | 293,459(0.00%)#2,262 |
| 46. | Rocky Mount | 9 | 3,499(0.26%)#46 | 293,459(0.00%)#2,274 |
| 47. | Morganton | 9 | 3,499(0.26%)#47 | 293,459(0.00%)#2,300 |
| 48. | Elon | 9 | 3,499(0.26%)#48 | 293,459(0.00%)#2,317 |
| 49. | Pinehurst | 8 | 3,499(0.23%)#49 | 293,459(0.00%)#2,409 |
| 50. | Lewisville | 8 | 3,499(0.23%)#50 | 293,459(0.00%)#2,417 |
| 51. | Pineville | 8 | 3,499(0.23%)#51 | 293,459(0.00%)#2,423 |
| 52. | Rockfish | 8 | 3,499(0.23%)#52 | 293,459(0.00%)#2,444 |
| 53. | Stallings | 6 | 3,499(0.17%)#53 | 293,459(0.00%)#2,617 |
| 54. | Dunn | 6 | 3,499(0.17%)#54 | 293,459(0.00%)#2,644 |
| 55. | Mount Olive | 6 | 3,499(0.17%)#55 | 293,459(0.00%)#2,655 |
| 56. | Spring Lake | 5 | 3,499(0.14%)#56 | 293,459(0.00%)#2,733 |
| 57. | Oak Island | 5 | 3,499(0.14%)#57 | 293,459(0.00%)#2,740 |
| 58. | Varnamtown | 5 | 3,499(0.14%)#58 | 293,459(0.00%)#2,793 |
| 59. | Bridgeton | 5 | 3,499(0.14%)#59 | 293,459(0.00%)#2,802 |
| 60. | Wrightsville Beach | 4 | 3,499(0.11%)#60 | 293,459(0.00%)#2,858 |
| 61. | Belmont | 3 | 3,499(0.09%)#61 | 293,459(0.00%)#2,922 |
| 62. | Anderson Creek | 2 | 3,499(0.06%)#62 | 293,459(0.00%)#3,028 |
| 63. | Cherryville | 2 | 3,499(0.06%)#63 | 293,459(0.00%)#3,035 |
| 64. | Burnsville | 2 | 3,499(0.06%)#64 | 293,459(0.00%)#3,046 |
| 65. | Belhaven | 2 | 3,499(0.06%)#65 | 293,459(0.00%)#3,060 |
| 66. | Pine Knoll Shores | 2 | 3,499(0.06%)#66 | 293,459(0.00%)#3,062 |
| 67. | Duck | 2 | 3,499(0.06%)#67 | 293,459(0.00%)#3,087 |
| 68. | Peletier | 1 | 3,499(0.03%)#68 | 293,459(0.00%)#3,166 |
| 69. | Indian Beach | 1 | 3,499(0.03%)#69 | 293,459(0.00%)#3,195 |
| 70. | Vandemere | 1 | 3,499(0.03%)#70 | 293,459(0.00%)#3,197 |
Common Questions
What are the Top 10 Cities with the Most Immigrants from Oceania in North Carolina?
Top 10 Cities with the Most Immigrants from Oceania in North Carolina are:
#1
308
#2
273
#3
239
#4
193
#5
182
#6
182
#7
106
#8
81
#9
77
#10
72
What city has the Most Immigrants from Oceania in North Carolina?
Durham has the Most Immigrants from Oceania in North Carolina with 308.
What is the Total Immigrants from Oceania in the State of North Carolina?
Total Immigrants from Oceania in North Carolina is 3,499.
What is the Total Immigrants from Oceania in the United States?
Total Immigrants from Oceania in the United States is 293,459.