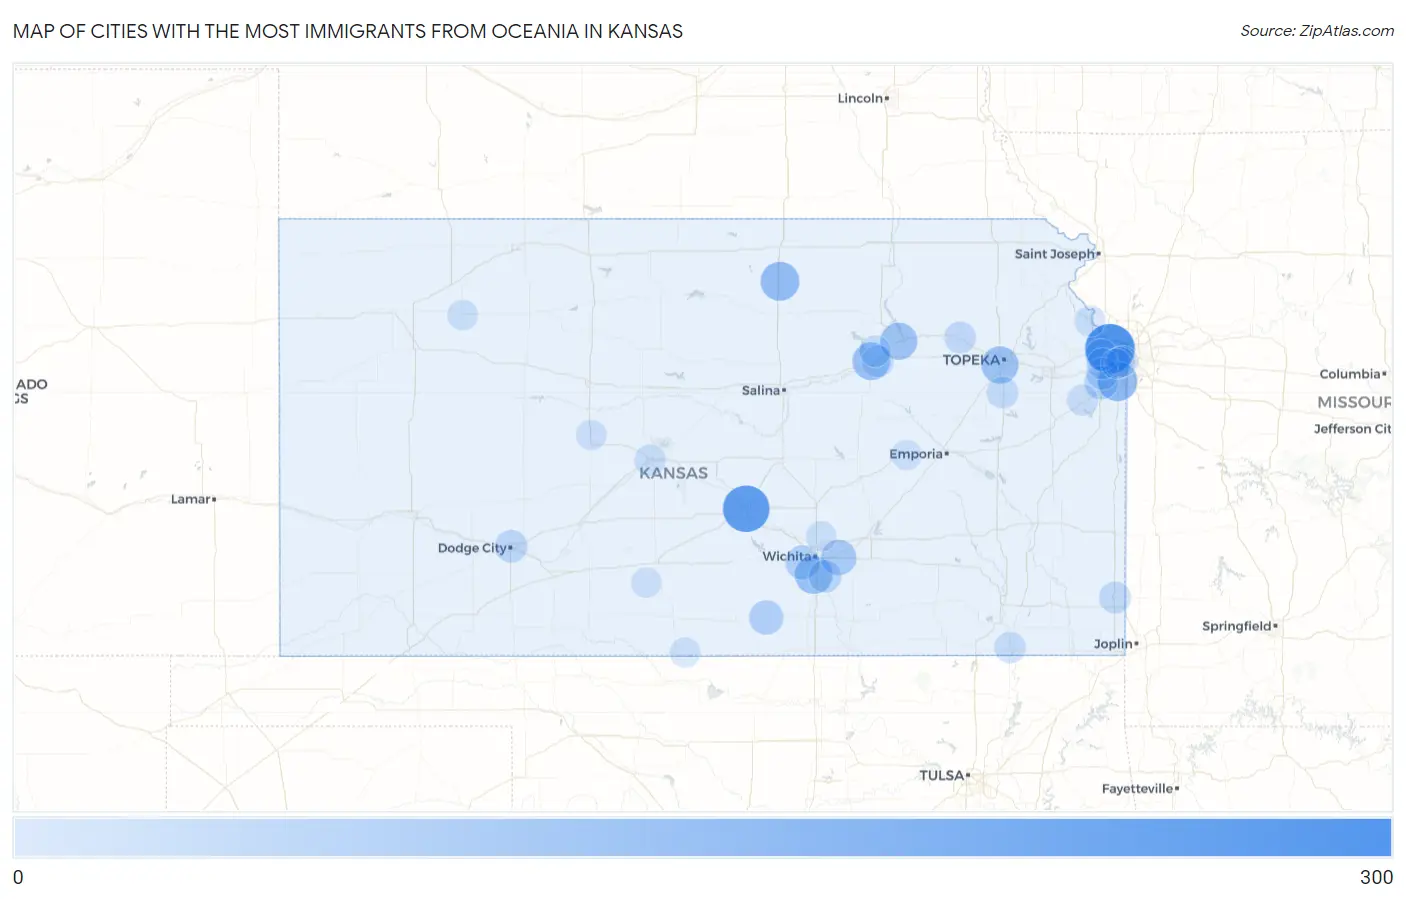
Cities with the Most Immigrants from Oceania in Kansas
RELATED REPORTS & OPTIONS
Oceania
Kansas
Compare Cities
Map of Cities with the Most Immigrants from Oceania in Kansas
0
300
Cities with the Most Immigrants from Oceania in Kansas
| City | Oceania | vs State | vs National | |
| 1. | Kansas City | 269 | 1,811(14.85%)#1 | 293,459(0.09%)#180 |
| 2. | South Hutchinson | 227 | 1,811(12.53%)#2 | 293,459(0.08%)#216 |
| 3. | Overland Park | 129 | 1,811(7.12%)#3 | 293,459(0.04%)#387 |
| 4. | Concordia | 118 | 1,811(6.52%)#4 | 293,459(0.04%)#417 |
| 5. | Junction City | 104 | 1,811(5.74%)#5 | 293,459(0.04%)#460 |
| 6. | Haysville | 104 | 1,811(5.74%)#6 | 293,459(0.04%)#463 |
| 7. | Topeka | 96 | 1,811(5.30%)#7 | 293,459(0.03%)#497 |
| 8. | Manhattan | 95 | 1,811(5.25%)#8 | 293,459(0.03%)#502 |
| 9. | Andover | 72 | 1,811(3.98%)#9 | 293,459(0.02%)#622 |
| 10. | Wichita | 55 | 1,811(3.04%)#10 | 293,459(0.02%)#769 |
| 11. | Argonia | 55 | 1,811(3.04%)#11 | 293,459(0.02%)#778 |
| 12. | Olathe | 48 | 1,811(2.65%)#12 | 293,459(0.02%)#847 |
| 13. | Derby | 33 | 1,811(1.82%)#13 | 293,459(0.01%)#1,106 |
| 14. | Dodge City | 32 | 1,811(1.77%)#14 | 293,459(0.01%)#1,134 |
| 15. | Lenexa | 23 | 1,811(1.27%)#15 | 293,459(0.01%)#1,394 |
| 16. | Grandview Plaza | 23 | 1,811(1.27%)#16 | 293,459(0.01%)#1,422 |
| 17. | Pittsburg | 22 | 1,811(1.21%)#17 | 293,459(0.01%)#1,441 |
| 18. | Edwardsville | 21 | 1,811(1.16%)#18 | 293,459(0.01%)#1,492 |
| 19. | St Marys | 21 | 1,811(1.16%)#19 | 293,459(0.01%)#1,501 |
| 20. | Carbondale | 20 | 1,811(1.10%)#20 | 293,459(0.01%)#1,554 |
| 21. | Fort Riley | 18 | 1,811(0.99%)#21 | 293,459(0.01%)#1,648 |
| 22. | Coffeyville | 15 | 1,811(0.83%)#22 | 293,459(0.01%)#1,822 |
| 23. | Shawnee | 14 | 1,811(0.77%)#23 | 293,459(0.00%)#1,856 |
| 24. | Great Bend | 11 | 1,811(0.61%)#24 | 293,459(0.00%)#2,135 |
| 25. | Roeland Park | 10 | 1,811(0.55%)#25 | 293,459(0.00%)#2,234 |
| 26. | Edgerton | 10 | 1,811(0.55%)#26 | 293,459(0.00%)#2,259 |
| 27. | Leavenworth | 9 | 1,811(0.50%)#27 | 293,459(0.00%)#2,281 |
| 28. | Mission | 7 | 1,811(0.39%)#28 | 293,459(0.00%)#2,524 |
| 29. | La Crosse | 4 | 1,811(0.22%)#29 | 293,459(0.00%)#2,882 |
| 30. | Rock | 4 | 1,811(0.22%)#30 | 293,459(0.00%)#2,915 |
| 31. | Kechi | 3 | 1,811(0.17%)#31 | 293,459(0.00%)#2,946 |
| 32. | Hoxie | 3 | 1,811(0.17%)#32 | 293,459(0.00%)#2,971 |
| 33. | Kiowa | 2 | 1,811(0.11%)#33 | 293,459(0.00%)#3,079 |
| 34. | Strong City | 2 | 1,811(0.11%)#34 | 293,459(0.00%)#3,098 |
| 35. | Merriam | 1 | 1,811(0.06%)#35 | 293,459(0.00%)#3,138 |
| 36. | Coats | 1 | 1,811(0.06%)#36 | 293,459(0.00%)#3,199 |
Common Questions
What are the Top 10 Cities with the Most Immigrants from Oceania in Kansas?
Top 10 Cities with the Most Immigrants from Oceania in Kansas are:
#1
269
#2
227
#3
129
#4
118
#5
104
#6
104
#7
96
#8
95
#9
72
#10
55
What city has the Most Immigrants from Oceania in Kansas?
Kansas City has the Most Immigrants from Oceania in Kansas with 269.
What is the Total Immigrants from Oceania in the State of Kansas?
Total Immigrants from Oceania in Kansas is 1,811.
What is the Total Immigrants from Oceania in the United States?
Total Immigrants from Oceania in the United States is 293,459.