Cities with the Most Immigrants from Oceania in Wisconsin
RELATED REPORTS & OPTIONS
Oceania
Wisconsin
Compare Cities
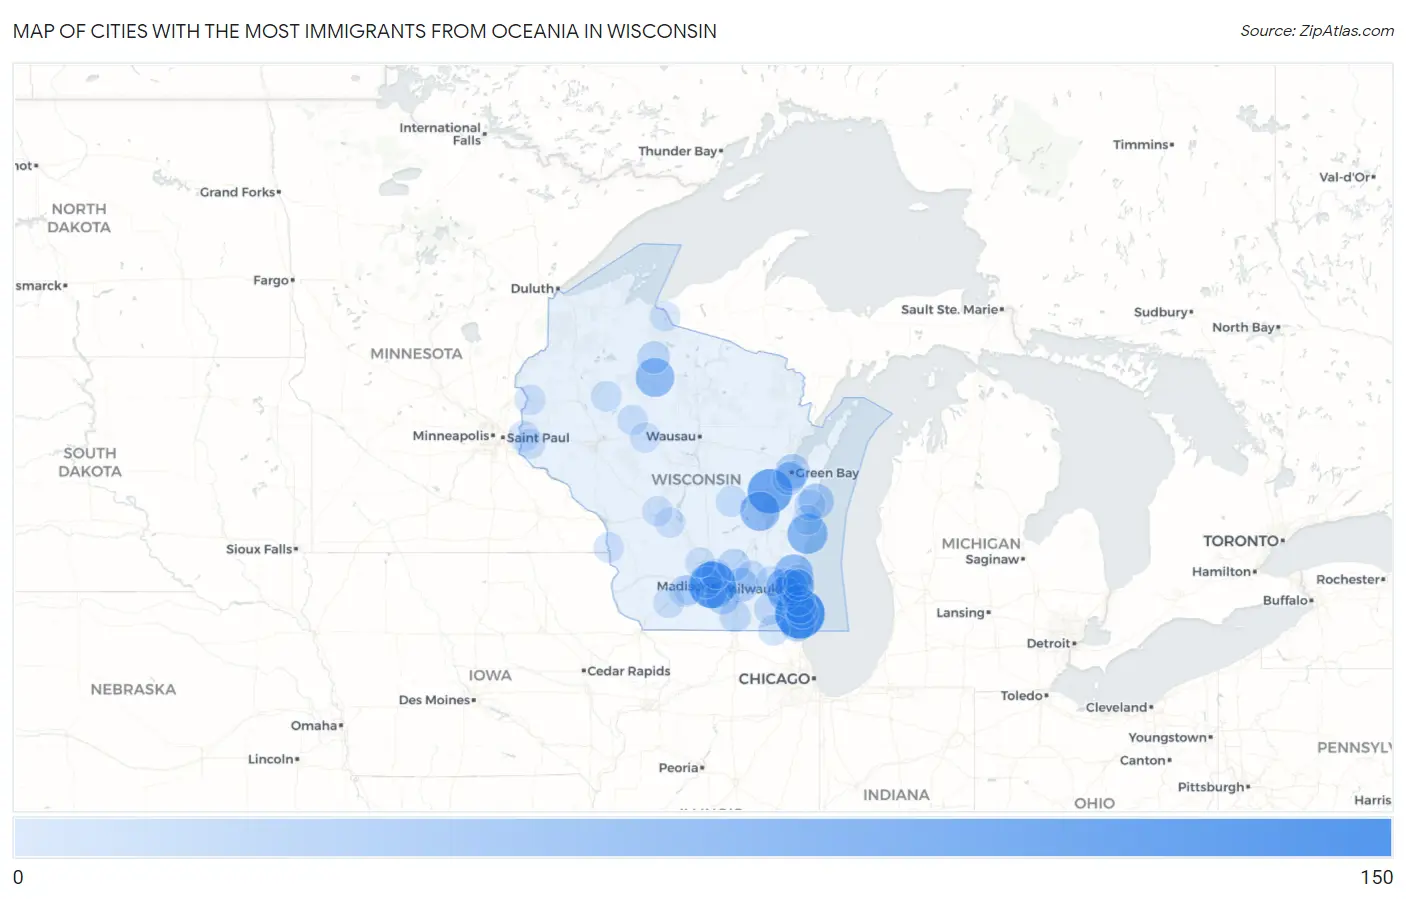
Map of Cities with the Most Immigrants from Oceania in Wisconsin
0
150
Cities with the Most Immigrants from Oceania in Wisconsin
| City | Oceania | vs State | vs National | |
| 1. | Mount Pleasant | 145 | 1,517(9.56%)#1 | 293,459(0.05%)#350 |
| 2. | Madison | 124 | 1,517(8.17%)#2 | 293,459(0.04%)#399 |
| 3. | Appleton | 107 | 1,517(7.05%)#3 | 293,459(0.04%)#448 |
| 4. | Sheboygan | 74 | 1,517(4.88%)#4 | 293,459(0.03%)#607 |
| 5. | Oshkosh | 67 | 1,517(4.42%)#5 | 293,459(0.02%)#650 |
| 6. | Mequon | 64 | 1,517(4.22%)#6 | 293,459(0.02%)#688 |
| 7. | Phillips | 63 | 1,517(4.15%)#7 | 293,459(0.02%)#699 |
| 8. | Brookfield | 60 | 1,517(3.96%)#8 | 293,459(0.02%)#717 |
| 9. | Milwaukee | 58 | 1,517(3.82%)#9 | 293,459(0.02%)#741 |
| 10. | Kenosha | 37 | 1,517(2.44%)#10 | 293,459(0.01%)#1,018 |
| 11. | Two Rivers | 37 | 1,517(2.44%)#11 | 293,459(0.01%)#1,029 |
| 12. | New Berlin | 32 | 1,517(2.11%)#12 | 293,459(0.01%)#1,132 |
| 13. | Green Bay | 30 | 1,517(1.98%)#13 | 293,459(0.01%)#1,175 |
| 14. | Lake Mills | 29 | 1,517(1.91%)#14 | 293,459(0.01%)#1,222 |
| 15. | Stoughton | 24 | 1,517(1.58%)#15 | 293,459(0.01%)#1,368 |
| 16. | Wauwatosa | 22 | 1,517(1.45%)#16 | 293,459(0.01%)#1,430 |
| 17. | De Pere | 21 | 1,517(1.38%)#17 | 293,459(0.01%)#1,469 |
| 18. | Park Falls | 18 | 1,517(1.19%)#18 | 293,459(0.01%)#1,659 |
| 19. | Racine | 16 | 1,517(1.05%)#19 | 293,459(0.01%)#1,720 |
| 20. | Waunakee | 16 | 1,517(1.05%)#20 | 293,459(0.01%)#1,748 |
| 21. | Columbus | 16 | 1,517(1.05%)#21 | 293,459(0.01%)#1,761 |
| 22. | Caledonia | 15 | 1,517(0.99%)#22 | 293,459(0.01%)#1,794 |
| 23. | East Troy | 13 | 1,517(0.86%)#23 | 293,459(0.00%)#1,977 |
| 24. | Janesville | 11 | 1,517(0.73%)#24 | 293,459(0.00%)#2,095 |
| 25. | Fitchburg | 11 | 1,517(0.73%)#25 | 293,459(0.00%)#2,110 |
| 26. | Oak Creek | 10 | 1,517(0.66%)#26 | 293,459(0.00%)#2,194 |
| 27. | Middleton | 10 | 1,517(0.66%)#27 | 293,459(0.00%)#2,208 |
| 28. | Manitowoc | 9 | 1,517(0.59%)#28 | 293,459(0.00%)#2,283 |
| 29. | Watertown | 9 | 1,517(0.59%)#29 | 293,459(0.00%)#2,290 |
| 30. | Barneveld | 9 | 1,517(0.59%)#30 | 293,459(0.00%)#2,363 |
| 31. | Fox Point | 8 | 1,517(0.53%)#31 | 293,459(0.00%)#2,434 |
| 32. | Pine River | 8 | 1,517(0.53%)#32 | 293,459(0.00%)#2,473 |
| 33. | Genoa City | 7 | 1,517(0.46%)#33 | 293,459(0.00%)#2,549 |
| 34. | Hudson | 6 | 1,517(0.40%)#34 | 293,459(0.00%)#2,621 |
| 35. | Shorewood | 6 | 1,517(0.40%)#35 | 293,459(0.00%)#2,624 |
| 36. | Mineral Point | 6 | 1,517(0.40%)#36 | 293,459(0.00%)#2,670 |
| 37. | Raymond | 5 | 1,517(0.33%)#37 | 293,459(0.00%)#2,756 |
| 38. | Allouez | 4 | 1,517(0.26%)#38 | 293,459(0.00%)#2,839 |
| 39. | St Croix Falls | 4 | 1,517(0.26%)#39 | 293,459(0.00%)#2,863 |
| 40. | Bruce | 4 | 1,517(0.26%)#40 | 293,459(0.00%)#2,897 |
| 41. | Gilman | 4 | 1,517(0.26%)#41 | 293,459(0.00%)#2,906 |
| 42. | Deforest | 3 | 1,517(0.20%)#42 | 293,459(0.00%)#2,929 |
| 43. | Withee | 3 | 1,517(0.20%)#43 | 293,459(0.00%)#2,999 |
| 44. | River Falls | 2 | 1,517(0.13%)#44 | 293,459(0.00%)#3,027 |
| 45. | New Lisbon | 2 | 1,517(0.13%)#45 | 293,459(0.00%)#3,055 |
| 46. | Chenequa | 2 | 1,517(0.13%)#46 | 293,459(0.00%)#3,080 |
| 47. | Montreal | 2 | 1,517(0.13%)#47 | 293,459(0.00%)#3,083 |
| 48. | Mission | 2 | 1,517(0.13%)#48 | 293,459(0.00%)#3,108 |
| 49. | Genoa | 2 | 1,517(0.13%)#49 | 293,459(0.00%)#3,114 |
| 50. | Wyeville | 2 | 1,517(0.13%)#50 | 293,459(0.00%)#3,126 |
| 51. | Cleveland | 1 | 1,517(0.07%)#51 | 293,459(0.00%)#3,156 |
| 52. | Blue Mounds | 1 | 1,517(0.07%)#52 | 293,459(0.00%)#3,163 |
| 53. | Merrimac | 1 | 1,517(0.07%)#53 | 293,459(0.00%)#3,170 |
Common Questions
What are the Top 10 Cities with the Most Immigrants from Oceania in Wisconsin?
Top 10 Cities with the Most Immigrants from Oceania in Wisconsin are:
#1
145
#2
124
#3
107
#4
74
#5
67
#6
64
#7
63
#8
60
#9
58
#10
37
What city has the Most Immigrants from Oceania in Wisconsin?
Mount Pleasant has the Most Immigrants from Oceania in Wisconsin with 145.
What is the Total Immigrants from Oceania in the State of Wisconsin?
Total Immigrants from Oceania in Wisconsin is 1,517.
What is the Total Immigrants from Oceania in the United States?
Total Immigrants from Oceania in the United States is 293,459.