Cities with the Most Immigrants from Oceania in Michigan
RELATED REPORTS & OPTIONS
Oceania
Michigan
Compare Cities
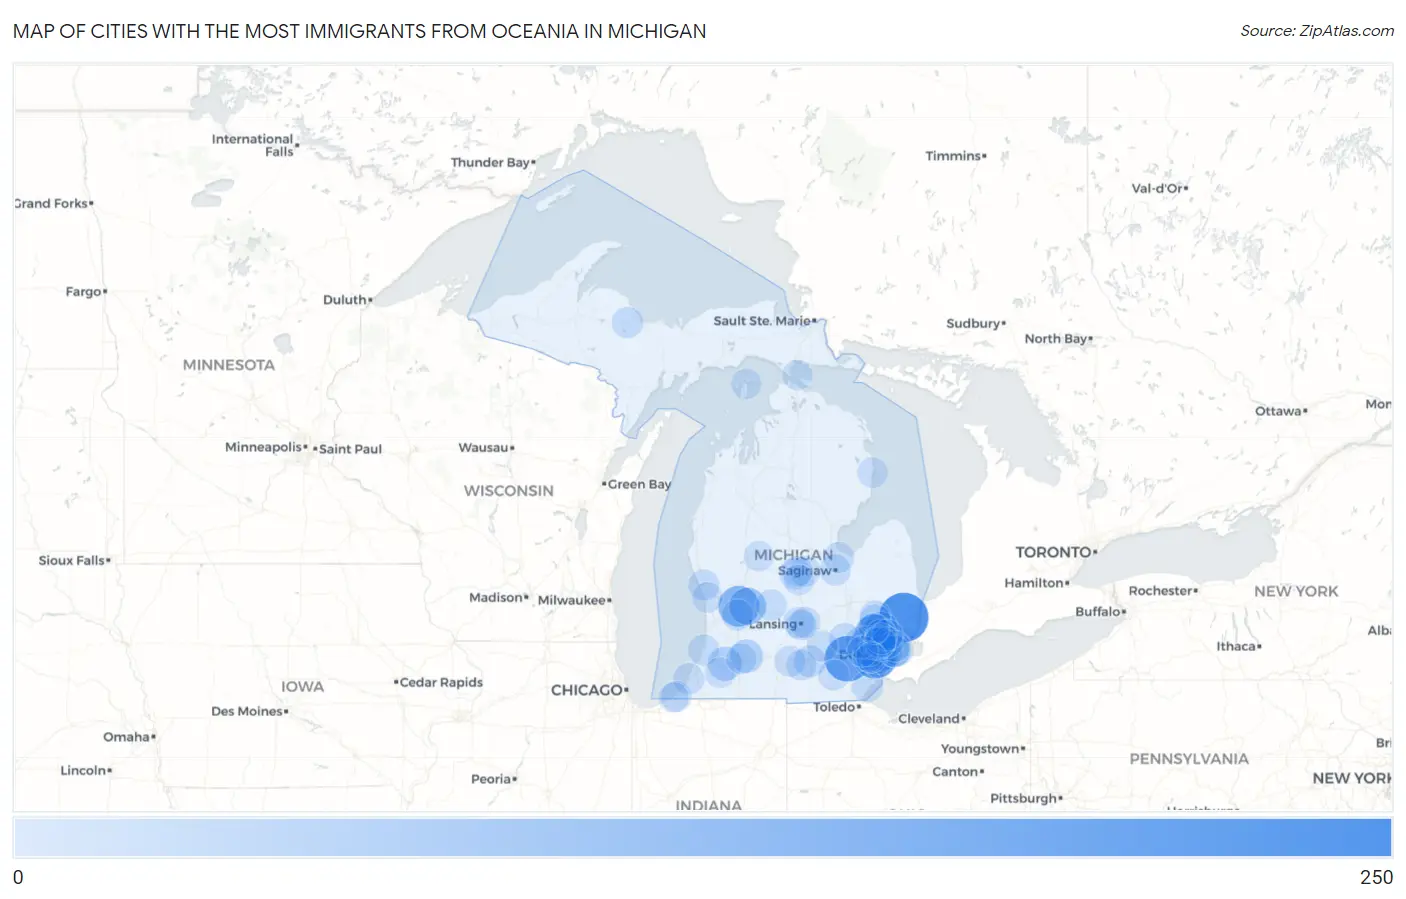
Map of Cities with the Most Immigrants from Oceania in Michigan
0
250
Cities with the Most Immigrants from Oceania in Michigan
| City | Oceania | vs State | vs National | |
| 1. | Richmond | 204 | 2,684(7.60%)#1 | 293,459(0.07%)#238 |
| 2. | Ann Arbor | 163 | 2,684(6.07%)#2 | 293,459(0.06%)#302 |
| 3. | Dearborn Heights | 146 | 2,684(5.44%)#3 | 293,459(0.05%)#346 |
| 4. | Bloomfield Hills | 113 | 2,684(4.21%)#4 | 293,459(0.04%)#426 |
| 5. | Grand Rapids | 110 | 2,684(4.10%)#5 | 293,459(0.04%)#433 |
| 6. | Birmingham | 91 | 2,684(3.39%)#6 | 293,459(0.03%)#522 |
| 7. | Forest Hills | 72 | 2,684(2.68%)#7 | 293,459(0.02%)#619 |
| 8. | Detroit | 62 | 2,684(2.31%)#8 | 293,459(0.02%)#700 |
| 9. | Dearborn | 53 | 2,684(1.97%)#9 | 293,459(0.02%)#790 |
| 10. | Paw Paw | 40 | 2,684(1.49%)#10 | 293,459(0.01%)#973 |
| 11. | Rochester Hills | 37 | 2,684(1.38%)#11 | 293,459(0.01%)#1,021 |
| 12. | Comstock Northwest | 36 | 2,684(1.34%)#12 | 293,459(0.01%)#1,050 |
| 13. | Farmington Hills | 30 | 2,684(1.12%)#13 | 293,459(0.01%)#1,176 |
| 14. | Lincoln Park | 29 | 2,684(1.08%)#14 | 293,459(0.01%)#1,207 |
| 15. | Livonia | 24 | 2,684(0.89%)#15 | 293,459(0.01%)#1,350 |
| 16. | Madison Heights | 23 | 2,684(0.86%)#16 | 293,459(0.01%)#1,399 |
| 17. | Ferndale | 21 | 2,684(0.78%)#17 | 293,459(0.01%)#1,474 |
| 18. | Pontiac | 20 | 2,684(0.75%)#18 | 293,459(0.01%)#1,519 |
| 19. | Novi | 19 | 2,684(0.71%)#19 | 293,459(0.01%)#1,562 |
| 20. | Southfield | 16 | 2,684(0.60%)#20 | 293,459(0.01%)#1,721 |
| 21. | Jackson | 16 | 2,684(0.60%)#21 | 293,459(0.01%)#1,730 |
| 22. | Grosse Pointe Farms | 14 | 2,684(0.52%)#22 | 293,459(0.00%)#1,886 |
| 23. | Monroe | 13 | 2,684(0.48%)#23 | 293,459(0.00%)#1,946 |
| 24. | Grosse Pointe Park | 13 | 2,684(0.48%)#24 | 293,459(0.00%)#1,957 |
| 25. | Brighton | 13 | 2,684(0.48%)#25 | 293,459(0.00%)#1,965 |
| 26. | Grosse Pointe | 13 | 2,684(0.48%)#26 | 293,459(0.00%)#1,971 |
| 27. | Cutlerville | 12 | 2,684(0.45%)#27 | 293,459(0.00%)#2,036 |
| 28. | Alma | 12 | 2,684(0.45%)#28 | 293,459(0.00%)#2,046 |
| 29. | Saginaw | 11 | 2,684(0.41%)#29 | 293,459(0.00%)#2,099 |
| 30. | Oak Park | 11 | 2,684(0.41%)#30 | 293,459(0.00%)#2,112 |
| 31. | South Haven | 11 | 2,684(0.41%)#31 | 293,459(0.00%)#2,165 |
| 32. | Oxford | 11 | 2,684(0.41%)#32 | 293,459(0.00%)#2,166 |
| 33. | Lake Orion | 11 | 2,684(0.41%)#33 | 293,459(0.00%)#2,167 |
| 34. | Troy | 10 | 2,684(0.37%)#34 | 293,459(0.00%)#2,182 |
| 35. | Royal Oak | 10 | 2,684(0.37%)#35 | 293,459(0.00%)#2,186 |
| 36. | Edgemont Park | 10 | 2,684(0.37%)#36 | 293,459(0.00%)#2,257 |
| 37. | Muskegon | 9 | 2,684(0.34%)#37 | 293,459(0.00%)#2,278 |
| 38. | Grosse Pointe Woods | 9 | 2,684(0.34%)#38 | 293,459(0.00%)#2,302 |
| 39. | Ionia | 9 | 2,684(0.34%)#39 | 293,459(0.00%)#2,308 |
| 40. | Negaunee | 9 | 2,684(0.34%)#40 | 293,459(0.00%)#2,340 |
| 41. | Warren | 8 | 2,684(0.30%)#41 | 293,459(0.00%)#2,378 |
| 42. | East Lansing | 8 | 2,684(0.30%)#42 | 293,459(0.00%)#2,386 |
| 43. | Bay City | 8 | 2,684(0.30%)#43 | 293,459(0.00%)#2,390 |
| 44. | Albion | 8 | 2,684(0.30%)#44 | 293,459(0.00%)#2,430 |
| 45. | Huntington Woods | 8 | 2,684(0.30%)#45 | 293,459(0.00%)#2,437 |
| 46. | Stockbridge | 8 | 2,684(0.30%)#46 | 293,459(0.00%)#2,457 |
| 47. | Stevensville | 8 | 2,684(0.30%)#47 | 293,459(0.00%)#2,460 |
| 48. | Sterling Heights | 7 | 2,684(0.26%)#48 | 293,459(0.00%)#2,475 |
| 49. | Lansing | 7 | 2,684(0.26%)#49 | 293,459(0.00%)#2,476 |
| 50. | Westland | 7 | 2,684(0.26%)#50 | 293,459(0.00%)#2,479 |
| 51. | Clawson | 6 | 2,684(0.22%)#51 | 293,459(0.00%)#2,630 |
| 52. | Plymouth | 6 | 2,684(0.22%)#52 | 293,459(0.00%)#2,638 |
| 53. | Clinton | 6 | 2,684(0.22%)#53 | 293,459(0.00%)#2,664 |
| 54. | Spring Arbor | 6 | 2,684(0.22%)#54 | 293,459(0.00%)#2,675 |
| 55. | Breckenridge | 6 | 2,684(0.22%)#55 | 293,459(0.00%)#2,686 |
| 56. | Auburn Hills | 5 | 2,684(0.19%)#56 | 293,459(0.00%)#2,727 |
| 57. | St Louis | 5 | 2,684(0.19%)#57 | 293,459(0.00%)#2,748 |
| 58. | Spring Lake | 5 | 2,684(0.19%)#58 | 293,459(0.00%)#2,772 |
| 59. | New Buffalo | 5 | 2,684(0.19%)#59 | 293,459(0.00%)#2,787 |
| 60. | Decatur | 3 | 2,684(0.11%)#60 | 293,459(0.00%)#2,955 |
| 61. | Mackinac Island | 3 | 2,684(0.11%)#61 | 293,459(0.00%)#2,984 |
| 62. | Kalamazoo | 2 | 2,684(0.07%)#62 | 293,459(0.00%)#3,016 |
| 63. | Inkster | 2 | 2,684(0.07%)#63 | 293,459(0.00%)#3,023 |
| 64. | Ithaca | 2 | 2,684(0.07%)#64 | 293,459(0.00%)#3,043 |
| 65. | Canadian Lakes | 2 | 2,684(0.07%)#65 | 293,459(0.00%)#3,045 |
| 66. | Harrisville | 2 | 2,684(0.07%)#66 | 293,459(0.00%)#3,097 |
| 67. | St James | 2 | 2,684(0.07%)#67 | 293,459(0.00%)#3,116 |
| 68. | Grand Beach | 1 | 2,684(0.04%)#68 | 293,459(0.00%)#3,182 |
Common Questions
What are the Top 10 Cities with the Most Immigrants from Oceania in Michigan?
Top 10 Cities with the Most Immigrants from Oceania in Michigan are:
#1
204
#2
163
#3
146
#4
113
#5
110
#6
91
#7
72
#8
62
#9
53
#10
40
What city has the Most Immigrants from Oceania in Michigan?
Richmond has the Most Immigrants from Oceania in Michigan with 204.
What is the Total Immigrants from Oceania in the State of Michigan?
Total Immigrants from Oceania in Michigan is 2,684.
What is the Total Immigrants from Oceania in the United States?
Total Immigrants from Oceania in the United States is 293,459.