Lake Catherine, IL
Lake Catherine Map
Lake Catherine Overview
1,311
TOTAL POPULATION
643
MALE POPULATION
668
FEMALE POPULATION
96.26
MALES / 100 FEMALES
103.89
FEMALES / 100 MALES
49.5
MEDIAN AGE
3.0
AVG FAMILY SIZE
2.2
AVG HOUSEHOLD SIZE
$50,649
PER CAPITA INCOME
$107,287
AVG FAMILY INCOME
$91,667
AVG HOUSEHOLD INCOME
61.4%
WAGE / INCOME GAP [ % ]
38.6¢/ $1
WAGE / INCOME GAP [ $ ]
0.43
INEQUALITY / GINI INDEX
771
LABOR FORCE [ PEOPLE ]
64.6%
PERCENT IN LABOR FORCE
10.0%
UNEMPLOYMENT RATE
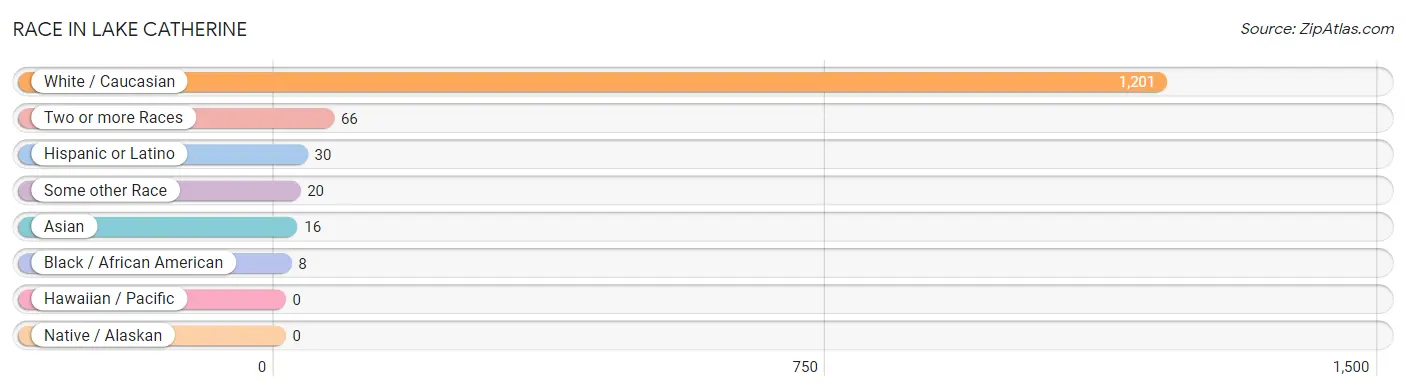
Race in Lake Catherine
The most populous races in Lake Catherine are White / Caucasian (1,201 | 91.6%), Two or more Races (66 | 5.0%), and Hispanic or Latino (30 | 2.3%).
| Race | # Population | % Population |
| Asian | 16 | 1.2% |
| Black / African American | 8 | 0.6% |
| Hawaiian / Pacific | 0 | 0.0% |
| Hispanic or Latino | 30 | 2.3% |
| Native / Alaskan | 0 | 0.0% |
| White / Caucasian | 1,201 | 91.6% |
| Two or more Races | 66 | 5.0% |
| Some other Race | 20 | 1.5% |
| Total | 1,311 | 100.0% |
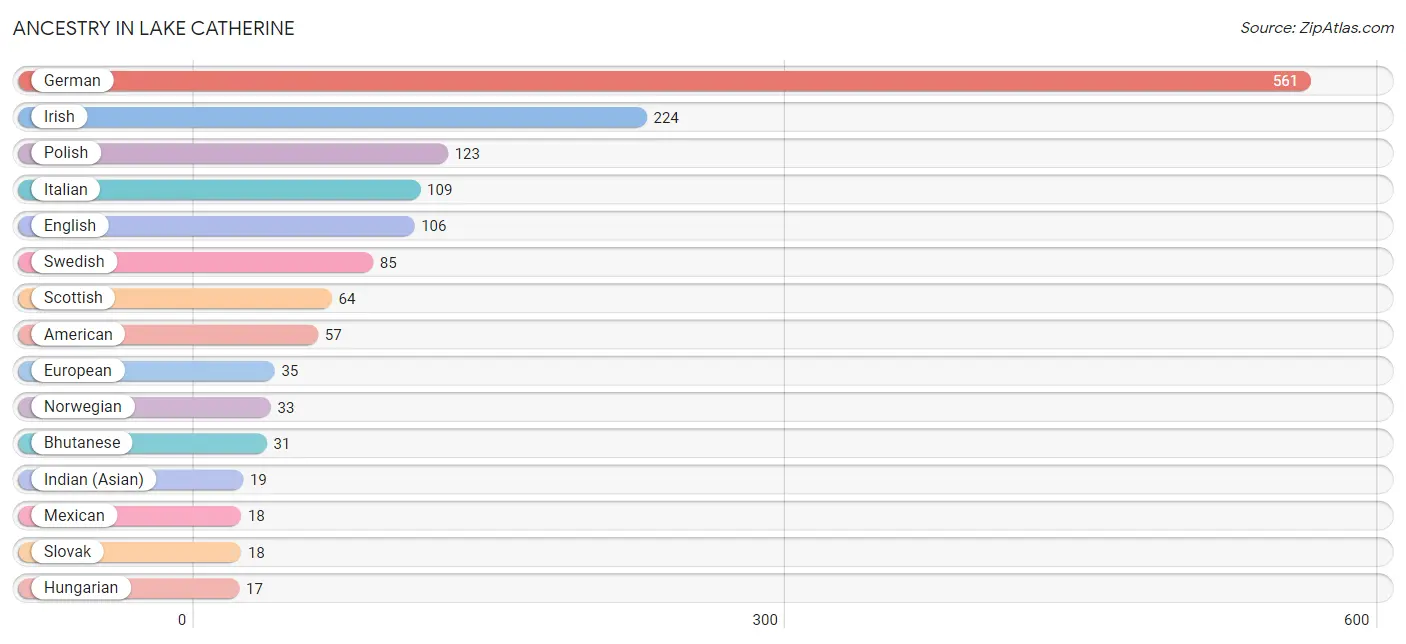
Ancestry in Lake Catherine
The most populous ancestries reported in Lake Catherine are German (561 | 42.8%), Irish (224 | 17.1%), Polish (123 | 9.4%), Italian (109 | 8.3%), and English (106 | 8.1%), together accounting for 85.7% of all Lake Catherine residents.
| Ancestry | # Population | % Population |
| American | 57 | 4.3% |
| Arab | 9 | 0.7% |
| Bhutanese | 31 | 2.4% |
| British | 8 | 0.6% |
| Danish | 13 | 1.0% |
| Ecuadorian | 12 | 0.9% |
| English | 106 | 8.1% |
| European | 35 | 2.7% |
| Finnish | 15 | 1.1% |
| French | 9 | 0.7% |
| French Canadian | 10 | 0.8% |
| German | 561 | 42.8% |
| Hungarian | 17 | 1.3% |
| Indian (Asian) | 19 | 1.5% |
| Irish | 224 | 17.1% |
| Italian | 109 | 8.3% |
| Lebanese | 9 | 0.7% |
| Mexican | 18 | 1.4% |
| Norwegian | 33 | 2.5% |
| Polish | 123 | 9.4% |
| Scotch-Irish | 9 | 0.7% |
| Scottish | 64 | 4.9% |
| Slovak | 18 | 1.4% |
| South American | 12 | 0.9% |
| Swedish | 85 | 6.5% |
| Welsh | 6 | 0.5% | View All 26 Rows |
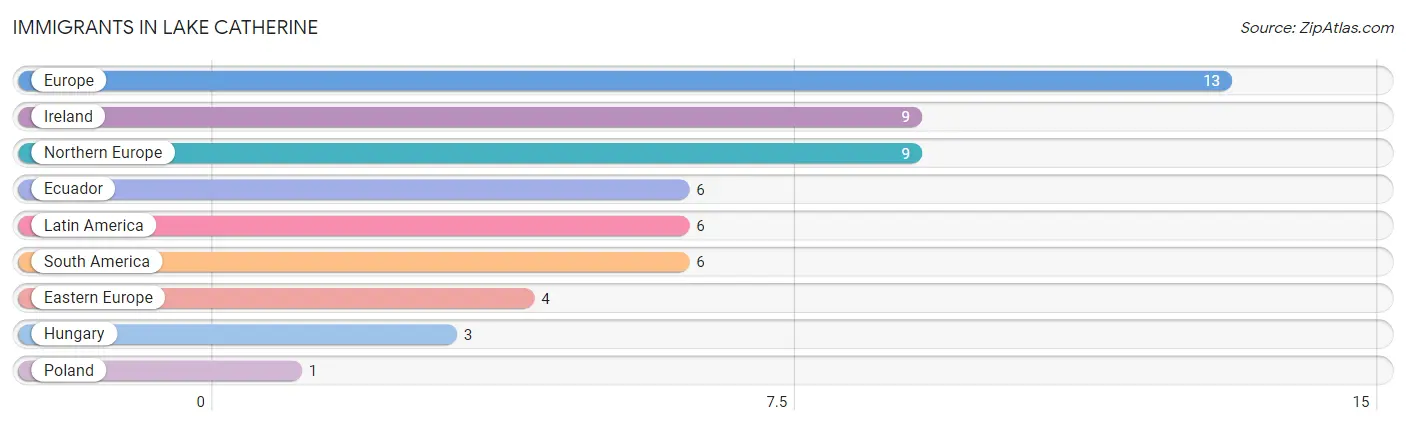
Immigrants in Lake Catherine
The most numerous immigrant groups reported in Lake Catherine came from Europe (13 | 1.0%), Ireland (9 | 0.7%), Northern Europe (9 | 0.7%), Ecuador (6 | 0.5%), and Latin America (6 | 0.5%), together accounting for 3.3% of all Lake Catherine residents.
| Immigration Origin | # Population | % Population |
| Eastern Europe | 4 | 0.3% |
| Ecuador | 6 | 0.5% |
| Europe | 13 | 1.0% |
| Hungary | 3 | 0.2% |
| Ireland | 9 | 0.7% |
| Latin America | 6 | 0.5% |
| Northern Europe | 9 | 0.7% |
| Poland | 1 | 0.1% |
| South America | 6 | 0.5% | View All 9 Rows |
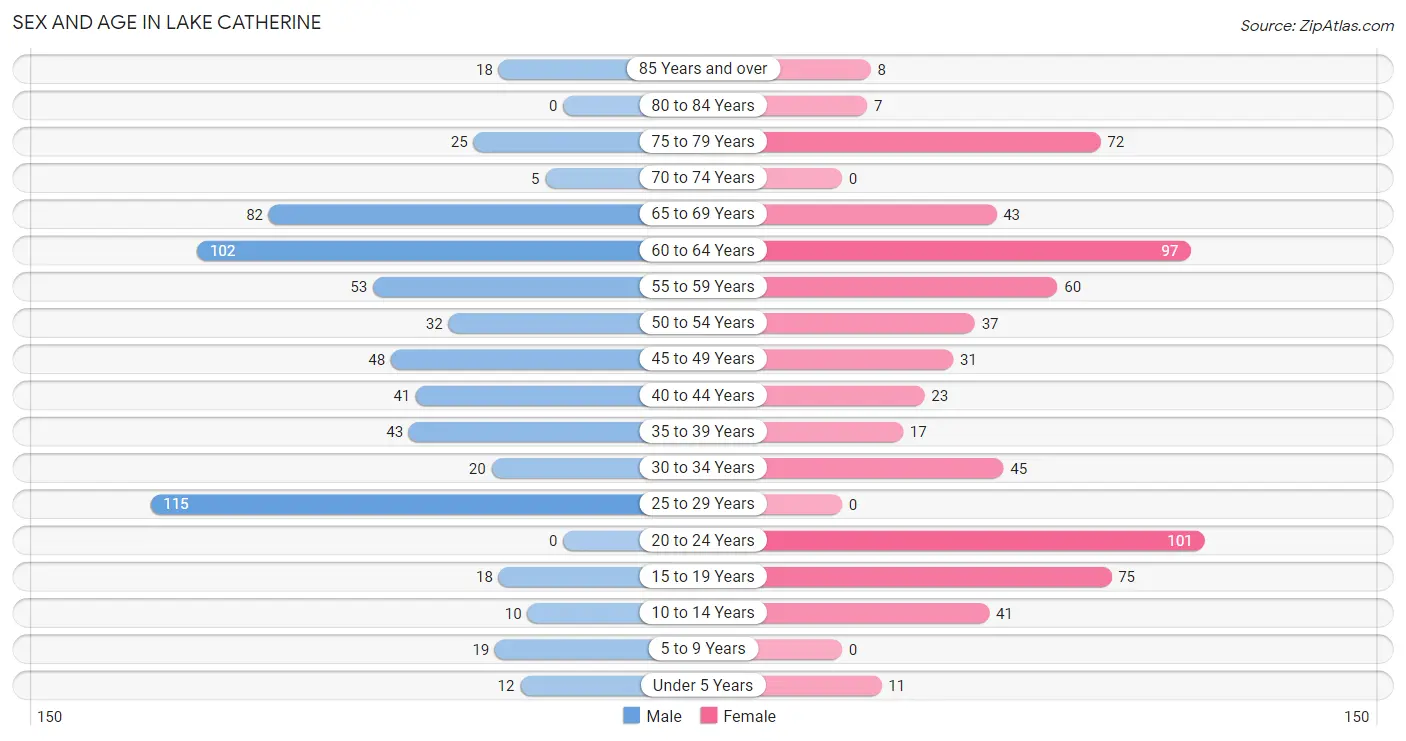
Sex and Age in Lake Catherine
Sex and Age in Lake Catherine
The most populous age groups in Lake Catherine are 25 to 29 Years (115 | 17.9%) for men and 20 to 24 Years (101 | 15.1%) for women.
| Age Bracket | Male | Female |
| Under 5 Years | 12 (1.9%) | 11 (1.7%) |
| 5 to 9 Years | 19 (2.9%) | 0 (0.0%) |
| 10 to 14 Years | 10 (1.6%) | 41 (6.1%) |
| 15 to 19 Years | 18 (2.8%) | 75 (11.2%) |
| 20 to 24 Years | 0 (0.0%) | 101 (15.1%) |
| 25 to 29 Years | 115 (17.9%) | 0 (0.0%) |
| 30 to 34 Years | 20 (3.1%) | 45 (6.7%) |
| 35 to 39 Years | 43 (6.7%) | 17 (2.5%) |
| 40 to 44 Years | 41 (6.4%) | 23 (3.4%) |
| 45 to 49 Years | 48 (7.5%) | 31 (4.6%) |
| 50 to 54 Years | 32 (5.0%) | 37 (5.5%) |
| 55 to 59 Years | 53 (8.2%) | 60 (9.0%) |
| 60 to 64 Years | 102 (15.9%) | 97 (14.5%) |
| 65 to 69 Years | 82 (12.8%) | 43 (6.4%) |
| 70 to 74 Years | 5 (0.8%) | 0 (0.0%) |
| 75 to 79 Years | 25 (3.9%) | 72 (10.8%) |
| 80 to 84 Years | 0 (0.0%) | 7 (1.1%) |
| 85 Years and over | 18 (2.8%) | 8 (1.2%) |
| Total | 643 (100.0%) | 668 (100.0%) |
Families and Households in Lake Catherine
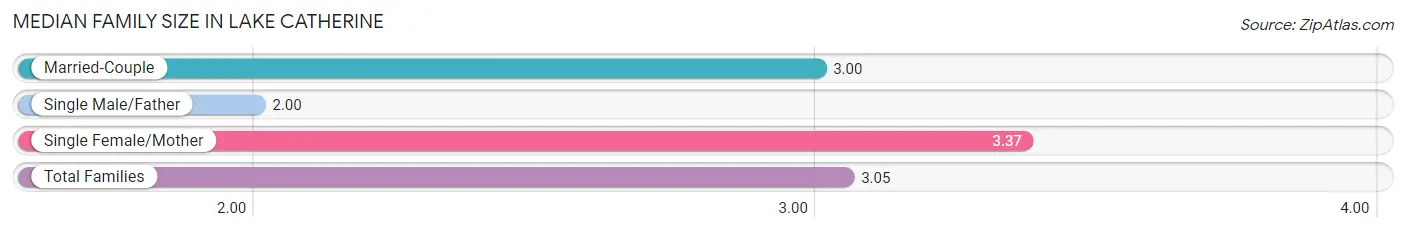
Median Family Size in Lake Catherine
The median family size in Lake Catherine is 3.05 persons per family, with single female/mother families (62 | 20.7%) accounting for the largest median family size of 3.37 persons per family. On the other hand, single male/father families (9 | 3.0%) represent the smallest median family size with 2.00 persons per family.
| Family Type | # Families | Family Size |
| Married-Couple | 229 (76.3%) | 3.00 |
| Single Male/Father | 9 (3.0%) | 2.00 |
| Single Female/Mother | 62 (20.7%) | 3.37 |
| Total Families | 300 (100.0%) | 3.05 |
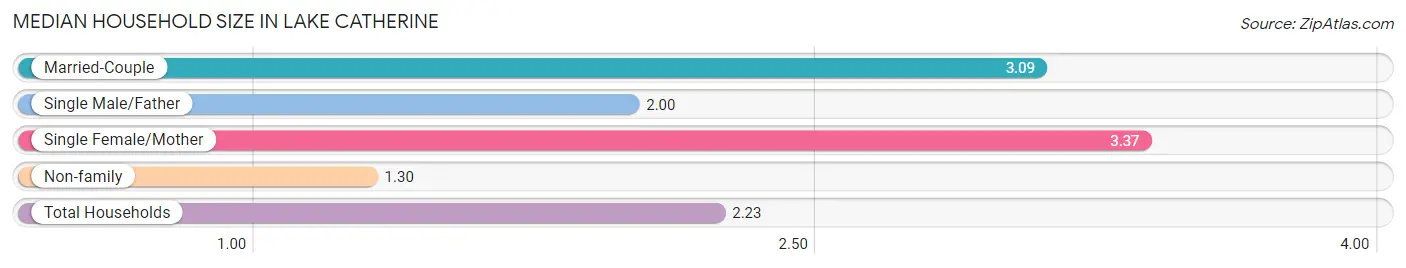
Median Household Size in Lake Catherine
The median household size in Lake Catherine is 2.23 persons per household, with single female/mother households (62 | 10.6%) accounting for the largest median household size of 3.37 persons per household. non-family households (286 | 48.8%) represent the smallest median household size with 1.30 persons per household.
| Household Type | # Households | Household Size |
| Married-Couple | 229 (39.1%) | 3.09 |
| Single Male/Father | 9 (1.5%) | 2.00 |
| Single Female/Mother | 62 (10.6%) | 3.37 |
| Non-family | 286 (48.8%) | 1.30 |
| Total Households | 586 (100.0%) | 2.23 |
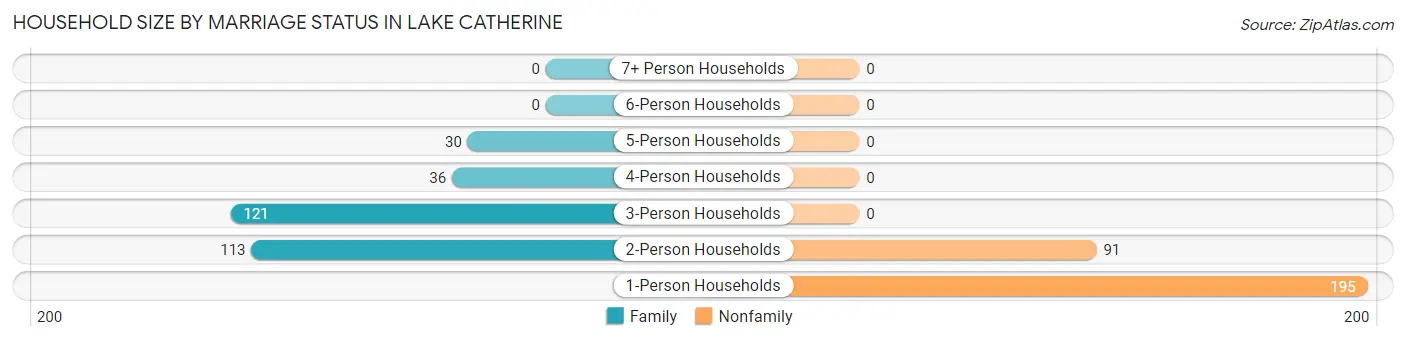
Household Size by Marriage Status in Lake Catherine
Out of a total of 586 households in Lake Catherine, 300 (51.2%) are family households, while 286 (48.8%) are nonfamily households. The most numerous type of family households are 3-person households, comprising 121, and the most common type of nonfamily households are 1-person households, comprising 195.
| Household Size | Family Households | Nonfamily Households |
| 1-Person Households | - | 195 (33.3%) |
| 2-Person Households | 113 (19.3%) | 91 (15.5%) |
| 3-Person Households | 121 (20.6%) | 0 (0.0%) |
| 4-Person Households | 36 (6.1%) | 0 (0.0%) |
| 5-Person Households | 30 (5.1%) | 0 (0.0%) |
| 6-Person Households | 0 (0.0%) | 0 (0.0%) |
| 7+ Person Households | 0 (0.0%) | 0 (0.0%) |
| Total | 300 (51.2%) | 286 (48.8%) |
Female Fertility in Lake Catherine
Fertility by Age in Lake Catherine
Average fertility rate in Lake Catherine is 122.0 births per 1,000 women. Women in the age bracket of 20 to 34 years have the highest fertility rate with 247.0 births per 1,000 women. Women in the age bracket of 20 to 34 years acount for 100.0% of all women with births.
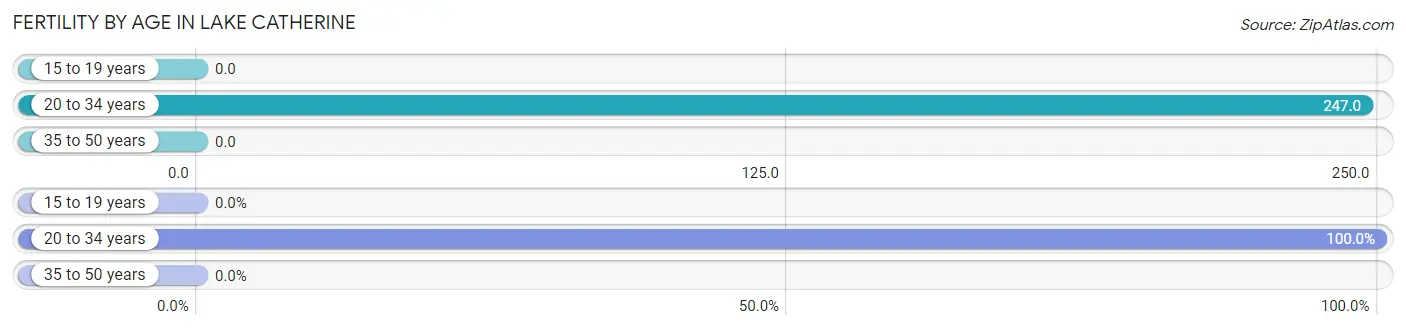
| Age Bracket | Women with Births | Births / 1,000 Women |
| 15 to 19 years | 0 (0.0%) | 0.0 |
| 20 to 34 years | 36 (100.0%) | 247.0 |
| 35 to 50 years | 0 (0.0%) | 0.0 |
| Total | 36 (100.0%) | 122.0 |
Fertility by Age by Marriage Status in Lake Catherine
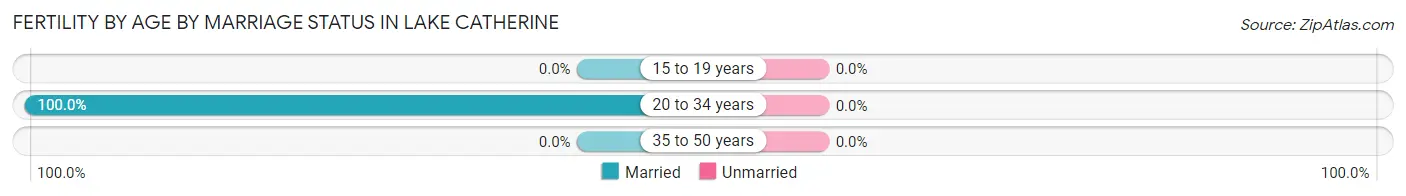
| Age Bracket | Married | Unmarried |
| 15 to 19 years | 0 (0.0%) | 0 (0.0%) |
| 20 to 34 years | 36 (100.0%) | 0 (0.0%) |
| 35 to 50 years | 0 (0.0%) | 0 (0.0%) |
| Total | 36 (100.0%) | 0 (0.0%) |
Fertility by Education in Lake Catherine
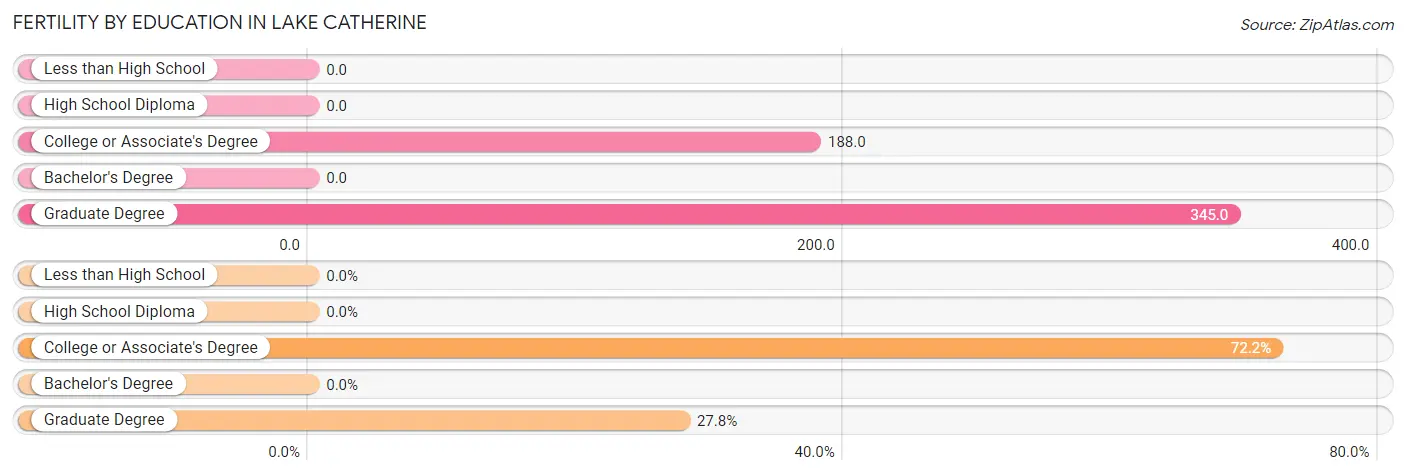
| Educational Attainment | Women with Births | Births / 1,000 Women |
| Less than High School | 0 (0.0%) | 0.0 |
| High School Diploma | 0 (0.0%) | 0.0 |
| College or Associate's Degree | 26 (72.2%) | 188.0 |
| Bachelor's Degree | 0 (0.0%) | 0.0 |
| Graduate Degree | 10 (27.8%) | 345.0 |
| Total | 36 (100.0%) | 122.0 |
Fertility by Education by Marriage Status in Lake Catherine
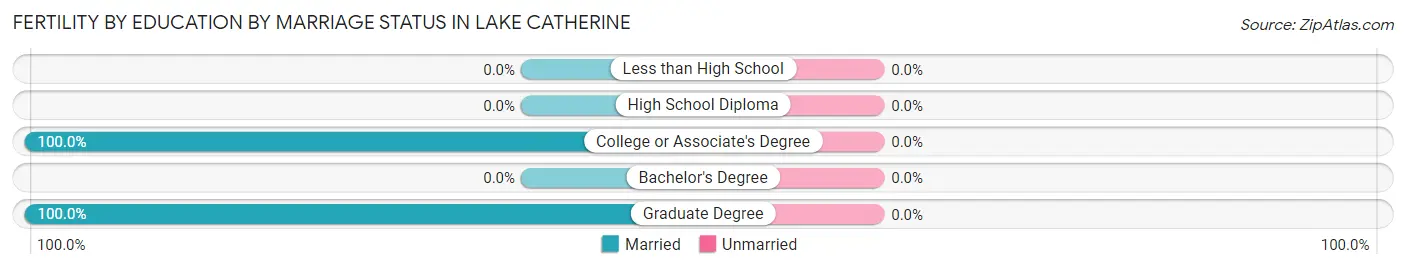
| Educational Attainment | Married | Unmarried |
| Less than High School | 0 (0.0%) | 0 (0.0%) |
| High School Diploma | 0 (0.0%) | 0 (0.0%) |
| College or Associate's Degree | 26 (100.0%) | 0 (0.0%) |
| Bachelor's Degree | 0 (0.0%) | 0 (0.0%) |
| Graduate Degree | 10 (100.0%) | 0 (0.0%) |
| Total | 36 (100.0%) | 0 (0.0%) |
Income in Lake Catherine
Income Overview in Lake Catherine
Per Capita Income in Lake Catherine is $50,649, while median incomes of families and households are $107,287 and $91,667 respectively.
| Characteristic | Number | Measure |
| Per Capita Income | 1,311 | $50,649 |
| Median Family Income | 300 | $107,287 |
| Mean Family Income | 300 | $130,587 |
| Median Household Income | 586 | $91,667 |
| Mean Household Income | 586 | $110,086 |
| Income Deficit | 300 | $0 |
| Wage / Income Gap (%) | 1,311 | 61.42% |
| Wage / Income Gap ($) | 1,311 | 38.58¢ per $1 |
| Gini / Inequality Index | 1,311 | 0.43 |
Earnings by Sex in Lake Catherine
Average Earnings in Lake Catherine are $40,000, $60,078 for men and $23,179 for women, a difference of 61.4%.
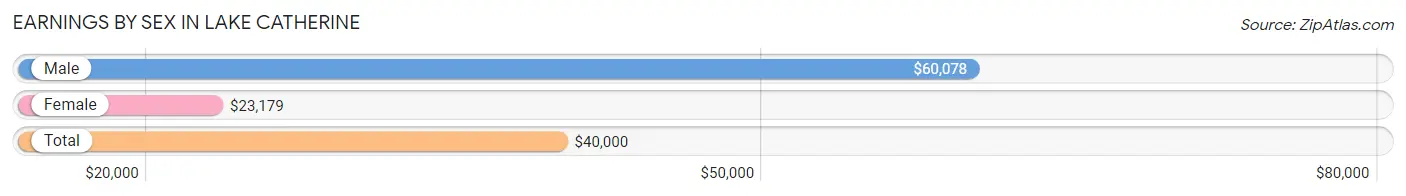
| Sex | Number | Average Earnings |
| Male | 411 (50.4%) | $60,078 |
| Female | 405 (49.6%) | $23,179 |
| Total | 816 (100.0%) | $40,000 |
Earnings by Sex by Income Bracket in Lake Catherine
The most common earnings brackets in Lake Catherine are $100,000+ for men (119 | 28.9%) and $10,000 to $12,499 for women (57 | 14.1%).
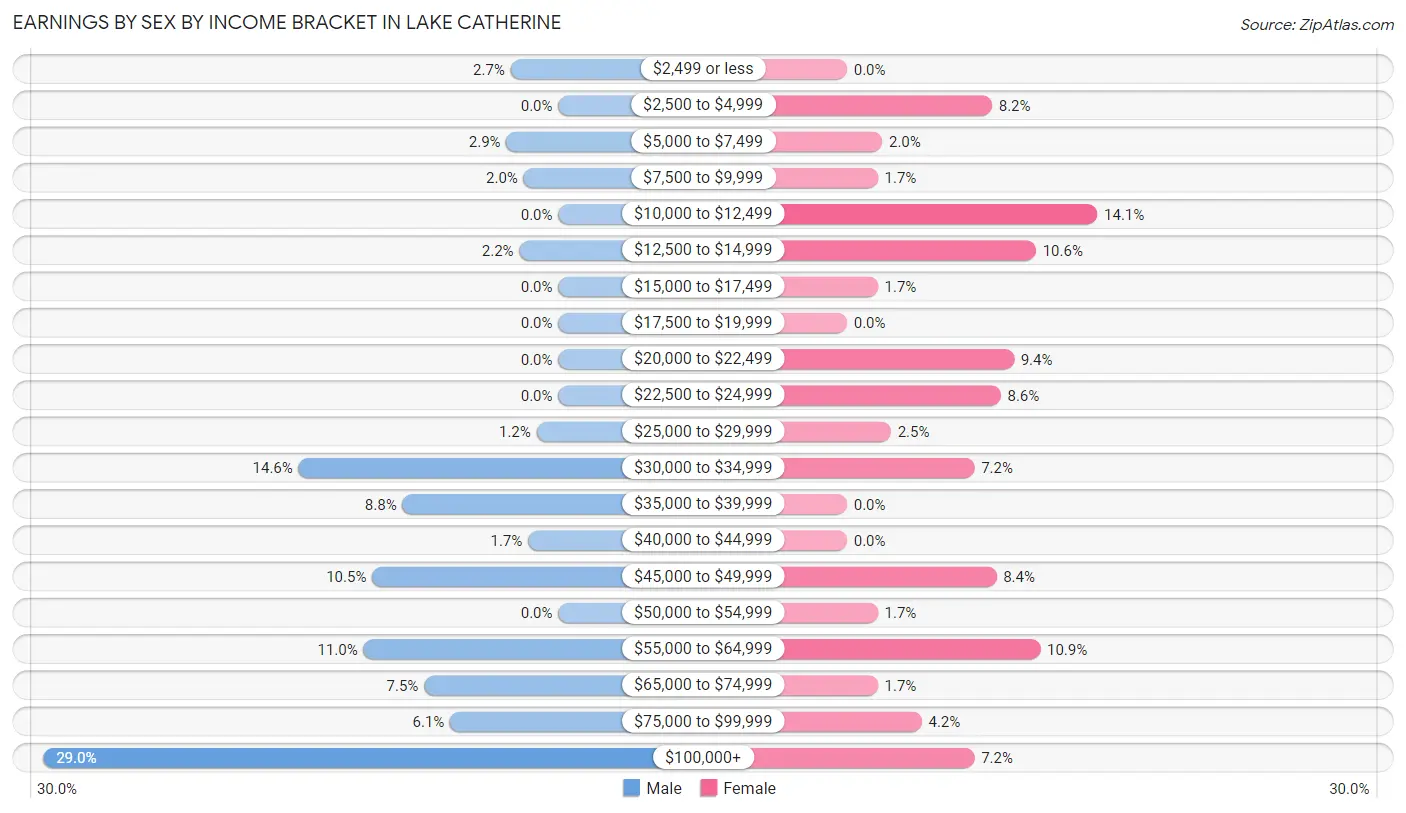
| Income | Male | Female |
| $2,499 or less | 11 (2.7%) | 0 (0.0%) |
| $2,500 to $4,999 | 0 (0.0%) | 33 (8.2%) |
| $5,000 to $7,499 | 12 (2.9%) | 8 (2.0%) |
| $7,500 to $9,999 | 8 (1.9%) | 7 (1.7%) |
| $10,000 to $12,499 | 0 (0.0%) | 57 (14.1%) |
| $12,500 to $14,999 | 9 (2.2%) | 43 (10.6%) |
| $15,000 to $17,499 | 0 (0.0%) | 7 (1.7%) |
| $17,500 to $19,999 | 0 (0.0%) | 0 (0.0%) |
| $20,000 to $22,499 | 0 (0.0%) | 38 (9.4%) |
| $22,500 to $24,999 | 0 (0.0%) | 35 (8.6%) |
| $25,000 to $29,999 | 5 (1.2%) | 10 (2.5%) |
| $30,000 to $34,999 | 60 (14.6%) | 29 (7.2%) |
| $35,000 to $39,999 | 36 (8.8%) | 0 (0.0%) |
| $40,000 to $44,999 | 7 (1.7%) | 0 (0.0%) |
| $45,000 to $49,999 | 43 (10.5%) | 34 (8.4%) |
| $50,000 to $54,999 | 0 (0.0%) | 7 (1.7%) |
| $55,000 to $64,999 | 45 (11.0%) | 44 (10.9%) |
| $65,000 to $74,999 | 31 (7.5%) | 7 (1.7%) |
| $75,000 to $99,999 | 25 (6.1%) | 17 (4.2%) |
| $100,000+ | 119 (28.9%) | 29 (7.2%) |
| Total | 411 (100.0%) | 405 (100.0%) |
Earnings by Sex by Educational Attainment in Lake Catherine
Average earnings in Lake Catherine are $60,078 for men and $34,095 for women, a difference of 43.2%. Men with an educational attainment of bachelor's degree enjoy the highest average annual earnings of $77,500, while those with college or associate's degree education earn the least with $41,607. Women with an educational attainment of graduate degree earn the most with the average annual earnings of $52,321, while those with college or associate's degree education have the smallest earnings of $23,594.
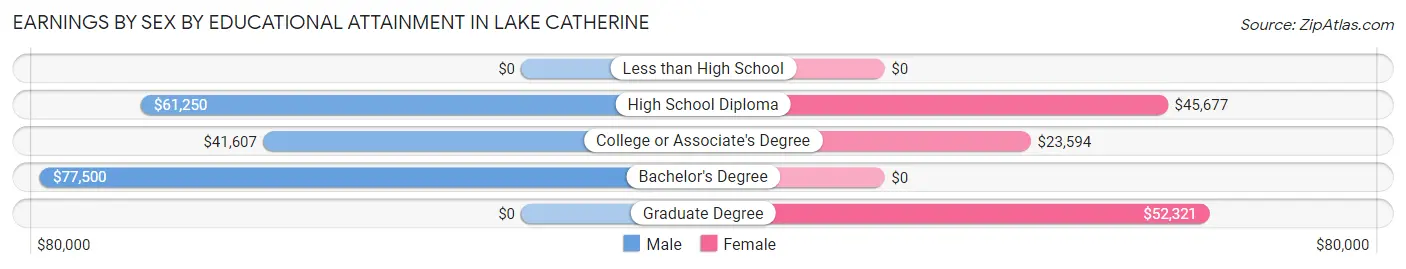
| Educational Attainment | Male Income | Female Income |
| Less than High School | - | - |
| High School Diploma | $61,250 | $45,677 |
| College or Associate's Degree | $41,607 | $23,594 |
| Bachelor's Degree | $77,500 | $0 |
| Graduate Degree | - | - |
| Total | $60,078 | $34,095 |
Family Income in Lake Catherine
Family Income Brackets in Lake Catherine
According to the Lake Catherine family income data, there are 110 families falling into the $100,000 to $149,999 income range, which is the most common income bracket and makes up 36.7% of all families.
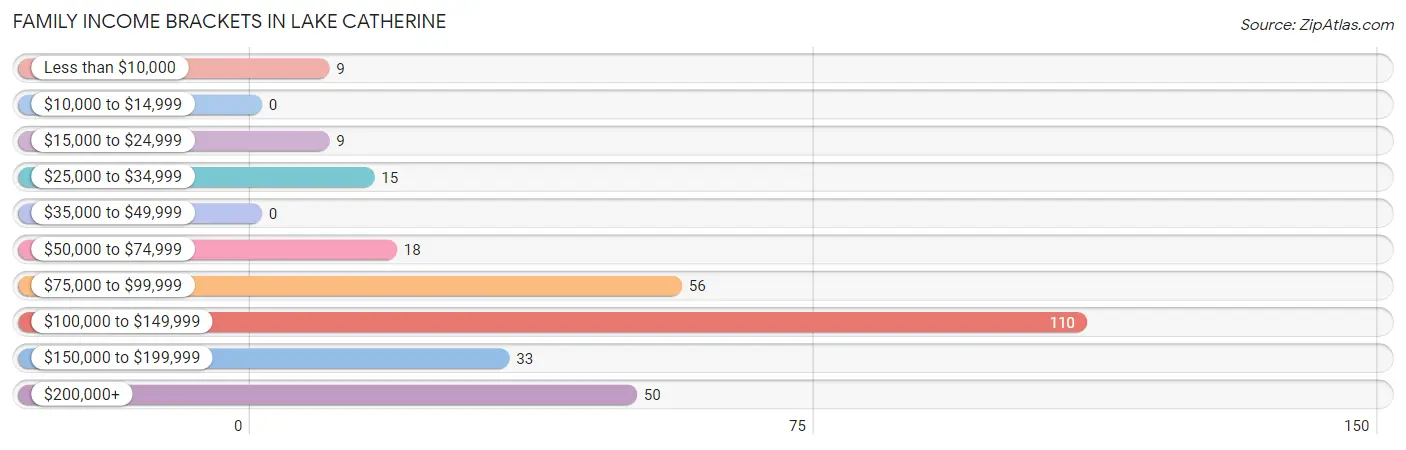
| Income Bracket | # Families | % Families |
| Less than $10,000 | 9 | 3.0% |
| $10,000 to $14,999 | 0 | 0.0% |
| $15,000 to $24,999 | 9 | 3.0% |
| $25,000 to $34,999 | 15 | 5.0% |
| $35,000 to $49,999 | 0 | 0.0% |
| $50,000 to $74,999 | 18 | 6.0% |
| $75,000 to $99,999 | 56 | 18.7% |
| $100,000 to $149,999 | 110 | 36.7% |
| $150,000 to $199,999 | 33 | 11.0% |
| $200,000+ | 50 | 16.7% |
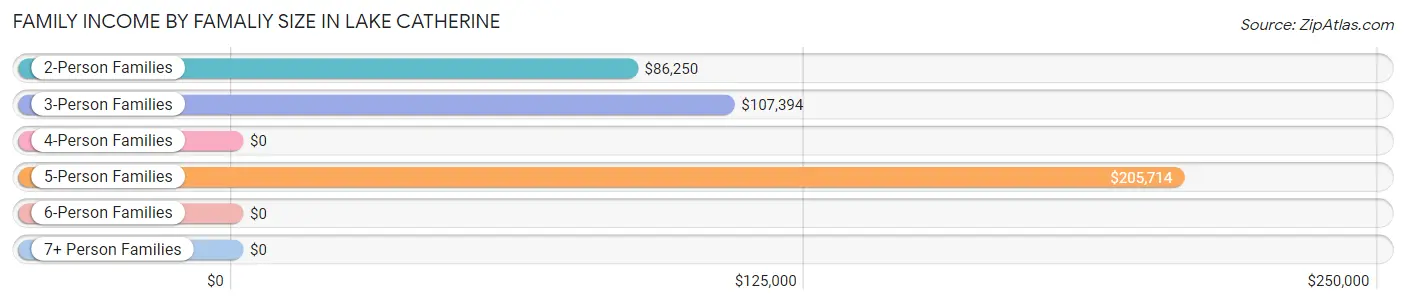
Family Income by Famaliy Size in Lake Catherine
5-person families (30 | 10.0%) account for the highest median family income in Lake Catherine with $205,714 per family, while 2-person families (122 | 40.7%) have the highest median income of $43,125 per family member.
| Income Bracket | # Families | Median Income |
| 2-Person Families | 122 (40.7%) | $86,250 |
| 3-Person Families | 130 (43.3%) | $107,394 |
| 4-Person Families | 18 (6.0%) | $0 |
| 5-Person Families | 30 (10.0%) | $205,714 |
| 6-Person Families | 0 (0.0%) | $0 |
| 7+ Person Families | 0 (0.0%) | $0 |
| Total | 300 (100.0%) | $107,287 |
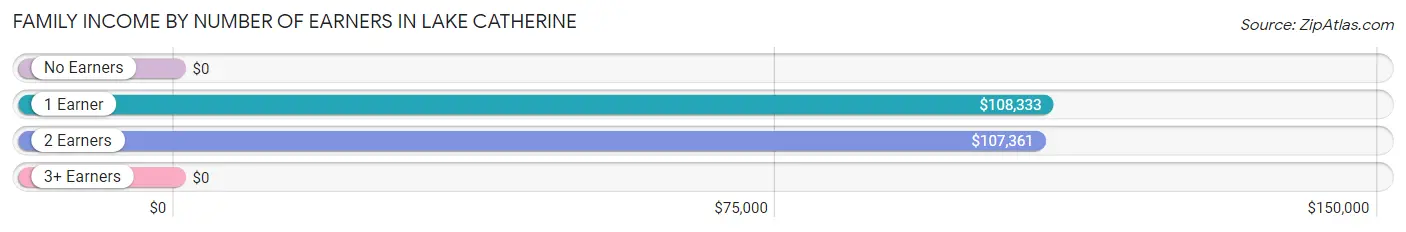
Family Income by Number of Earners in Lake Catherine
| Number of Earners | # Families | Median Income |
| No Earners | 26 (8.7%) | $0 |
| 1 Earner | 102 (34.0%) | $108,333 |
| 2 Earners | 98 (32.7%) | $107,361 |
| 3+ Earners | 74 (24.7%) | $0 |
| Total | 300 (100.0%) | $107,287 |
Household Income in Lake Catherine
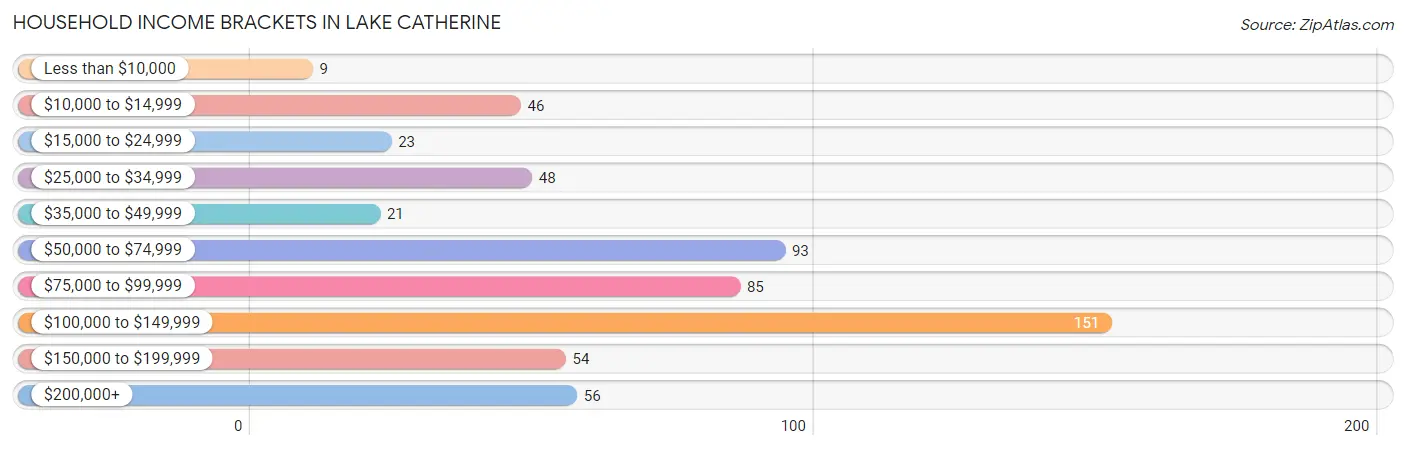
Household Income Brackets in Lake Catherine
With 151 households falling in the category, the $100,000 to $149,999 income range is the most frequent in Lake Catherine, accounting for 25.8% of all households. In contrast, only 9 households (1.5%) fall into the less than $10,000 income bracket, making it the least populous group.
| Income Bracket | # Households | % Households |
| Less than $10,000 | 9 | 1.5% |
| $10,000 to $14,999 | 46 | 7.8% |
| $15,000 to $24,999 | 23 | 3.9% |
| $25,000 to $34,999 | 48 | 8.2% |
| $35,000 to $49,999 | 21 | 3.6% |
| $50,000 to $74,999 | 93 | 15.9% |
| $75,000 to $99,999 | 85 | 14.5% |
| $100,000 to $149,999 | 151 | 25.8% |
| $150,000 to $199,999 | 54 | 9.2% |
| $200,000+ | 56 | 9.6% |
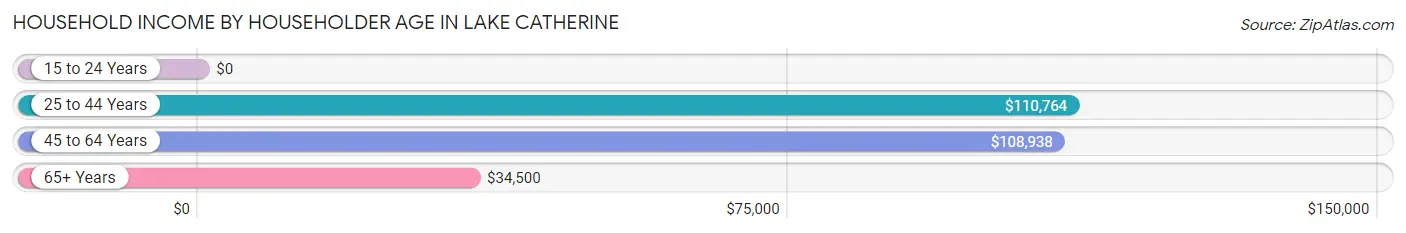
Household Income by Householder Age in Lake Catherine
The median household income in Lake Catherine is $91,667, with the highest median household income of $110,764 found in the 25 to 44 years age bracket for the primary householder. A total of 115 households (19.6%) fall into this category.
| Income Bracket | # Households | Median Income |
| 15 to 24 Years | 0 (0.0%) | $0 |
| 25 to 44 Years | 115 (19.6%) | $110,764 |
| 45 to 64 Years | 281 (47.9%) | $108,938 |
| 65+ Years | 190 (32.4%) | $34,500 |
| Total | 586 (100.0%) | $91,667 |
Poverty in Lake Catherine
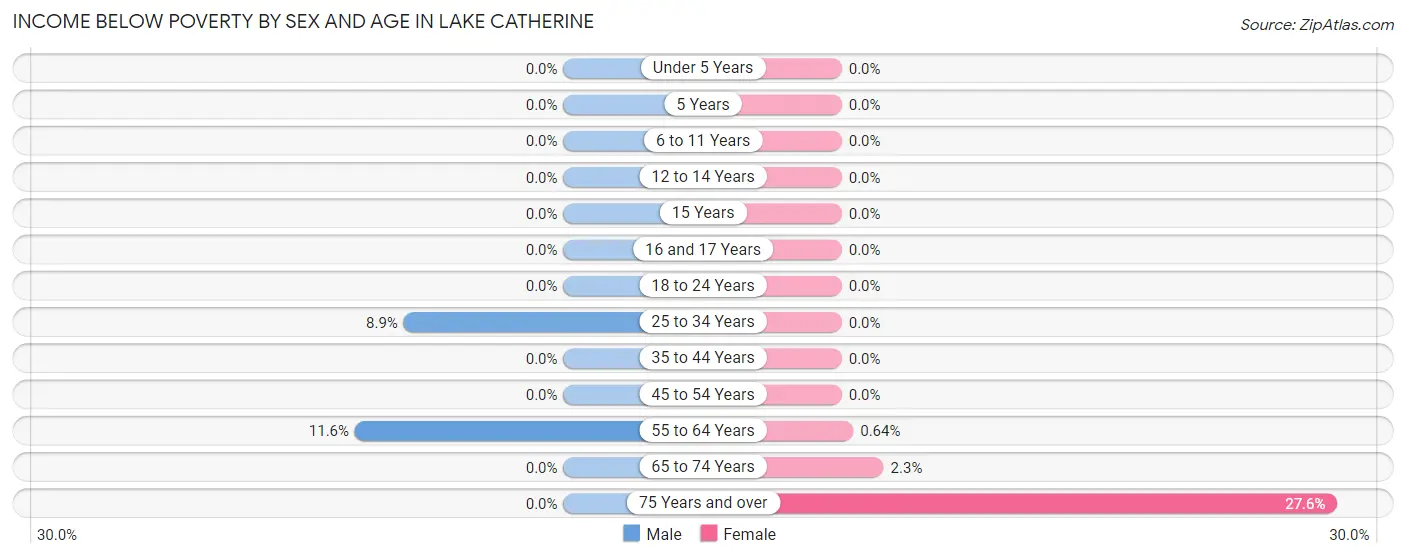
Income Below Poverty by Sex and Age in Lake Catherine
With 4.7% poverty level for males and 3.9% for females among the residents of Lake Catherine, 55 to 64 year old males and 75 year old and over females are the most vulnerable to poverty, with 18 males (11.6%) and 24 females (27.6%) in their respective age groups living below the poverty level.
| Age Bracket | Male | Female |
| Under 5 Years | 0 (0.0%) | 0 (0.0%) |
| 5 Years | 0 (0.0%) | 0 (0.0%) |
| 6 to 11 Years | 0 (0.0%) | 0 (0.0%) |
| 12 to 14 Years | 0 (0.0%) | 0 (0.0%) |
| 15 Years | 0 (0.0%) | 0 (0.0%) |
| 16 and 17 Years | 0 (0.0%) | 0 (0.0%) |
| 18 to 24 Years | 0 (0.0%) | 0 (0.0%) |
| 25 to 34 Years | 12 (8.9%) | 0 (0.0%) |
| 35 to 44 Years | 0 (0.0%) | 0 (0.0%) |
| 45 to 54 Years | 0 (0.0%) | 0 (0.0%) |
| 55 to 64 Years | 18 (11.6%) | 1 (0.6%) |
| 65 to 74 Years | 0 (0.0%) | 1 (2.3%) |
| 75 Years and over | 0 (0.0%) | 24 (27.6%) |
| Total | 30 (4.7%) | 26 (3.9%) |
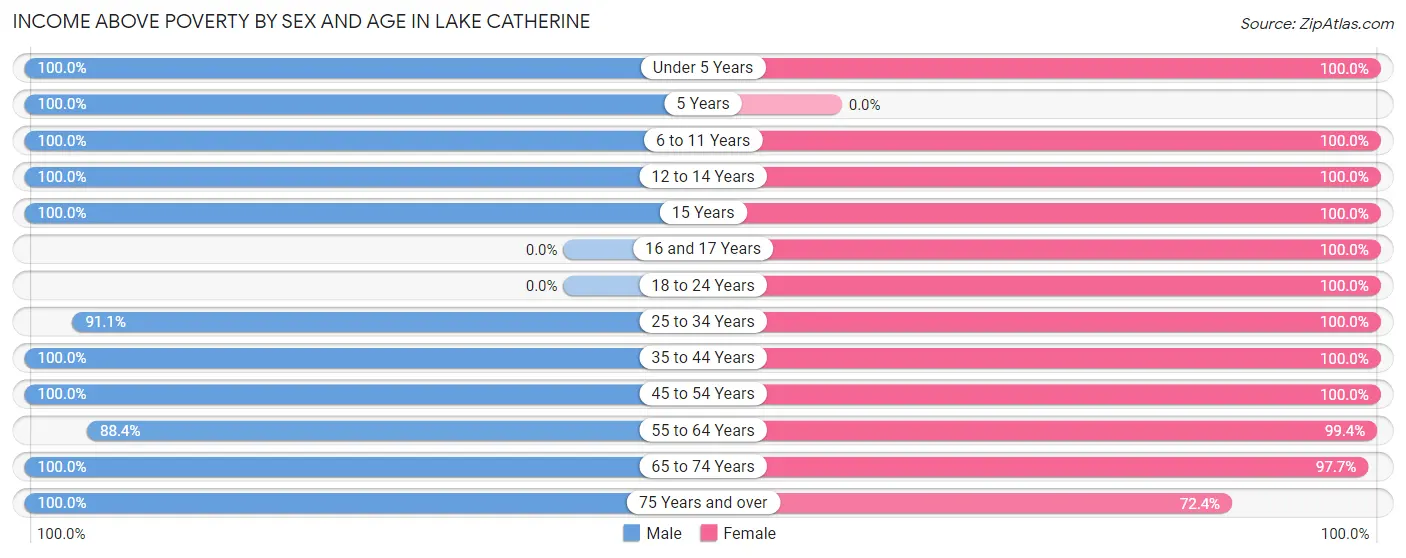
Income Above Poverty by Sex and Age in Lake Catherine
According to the poverty statistics in Lake Catherine, males aged under 5 years and females aged under 5 years are the age groups that are most secure financially, with 100.0% of males and 100.0% of females in these age groups living above the poverty line.
| Age Bracket | Male | Female |
| Under 5 Years | 12 (100.0%) | 11 (100.0%) |
| 5 Years | 10 (100.0%) | 0 (0.0%) |
| 6 to 11 Years | 12 (100.0%) | 20 (100.0%) |
| 12 to 14 Years | 7 (100.0%) | 21 (100.0%) |
| 15 Years | 18 (100.0%) | 6 (100.0%) |
| 16 and 17 Years | 0 (0.0%) | 36 (100.0%) |
| 18 to 24 Years | 0 (0.0%) | 134 (100.0%) |
| 25 to 34 Years | 123 (91.1%) | 45 (100.0%) |
| 35 to 44 Years | 84 (100.0%) | 40 (100.0%) |
| 45 to 54 Years | 80 (100.0%) | 68 (100.0%) |
| 55 to 64 Years | 137 (88.4%) | 156 (99.4%) |
| 65 to 74 Years | 87 (100.0%) | 42 (97.7%) |
| 75 Years and over | 43 (100.0%) | 63 (72.4%) |
| Total | 613 (95.3%) | 642 (96.1%) |
Income Below Poverty Among Married-Couple Families in Lake Catherine
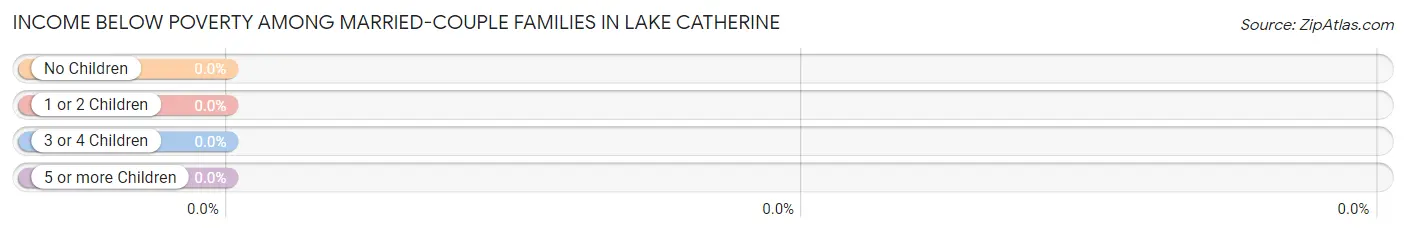
| Children | Above Poverty | Below Poverty |
| No Children | 154 (100.0%) | 0 (0.0%) |
| 1 or 2 Children | 72 (100.0%) | 0 (0.0%) |
| 3 or 4 Children | 3 (100.0%) | 0 (0.0%) |
| 5 or more Children | 0 (0.0%) | 0 (0.0%) |
| Total | 229 (100.0%) | 0 (0.0%) |
Income Below Poverty Among Single-Parent Households in Lake Catherine
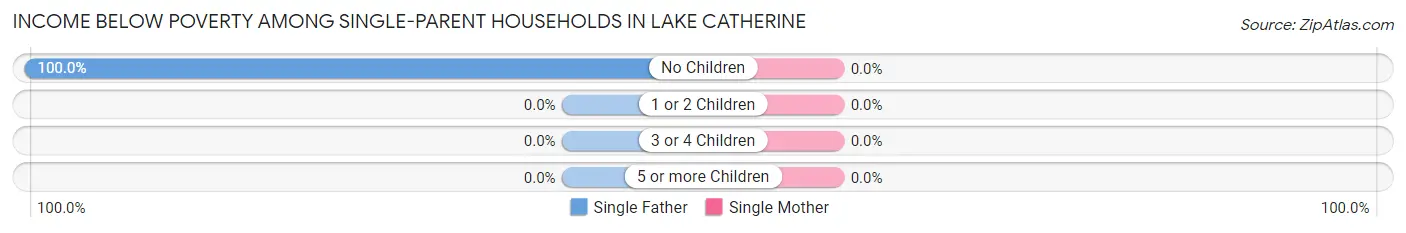
| Children | Single Father | Single Mother |
| No Children | 9 (100.0%) | 0 (0.0%) |
| 1 or 2 Children | 0 (0.0%) | 0 (0.0%) |
| 3 or 4 Children | 0 (0.0%) | 0 (0.0%) |
| 5 or more Children | 0 (0.0%) | 0 (0.0%) |
| Total | 9 (100.0%) | 0 (0.0%) |
Income Below Poverty Among Married-Couple vs Single-Parent Households in Lake Catherine
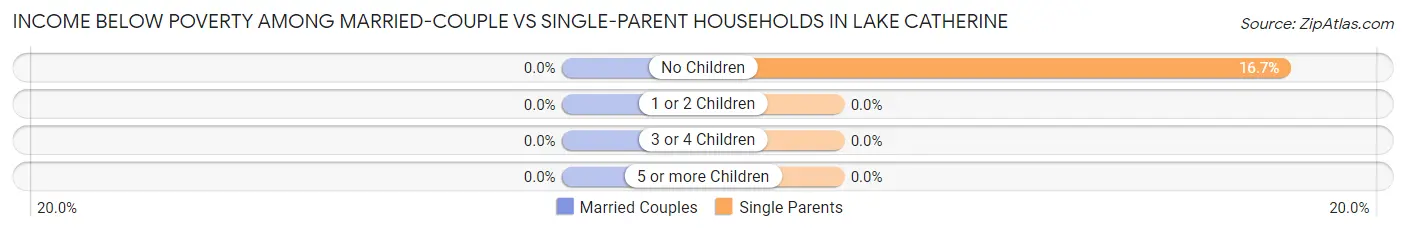
| Children | Married-Couple Families | Single-Parent Households |
| No Children | 0 (0.0%) | 9 (16.7%) |
| 1 or 2 Children | 0 (0.0%) | 0 (0.0%) |
| 3 or 4 Children | 0 (0.0%) | 0 (0.0%) |
| 5 or more Children | 0 (0.0%) | 0 (0.0%) |
| Total | 0 (0.0%) | 9 (12.7%) |
Employment Characteristics in Lake Catherine
Employment by Class of Employer in Lake Catherine
Among the 676 employed individuals in Lake Catherine, private company employees (460 | 68.0%), not-for-profit organizations (96 | 14.2%), and self-employed (incorporated) (46 | 6.8%) make up the most common classes of employment.
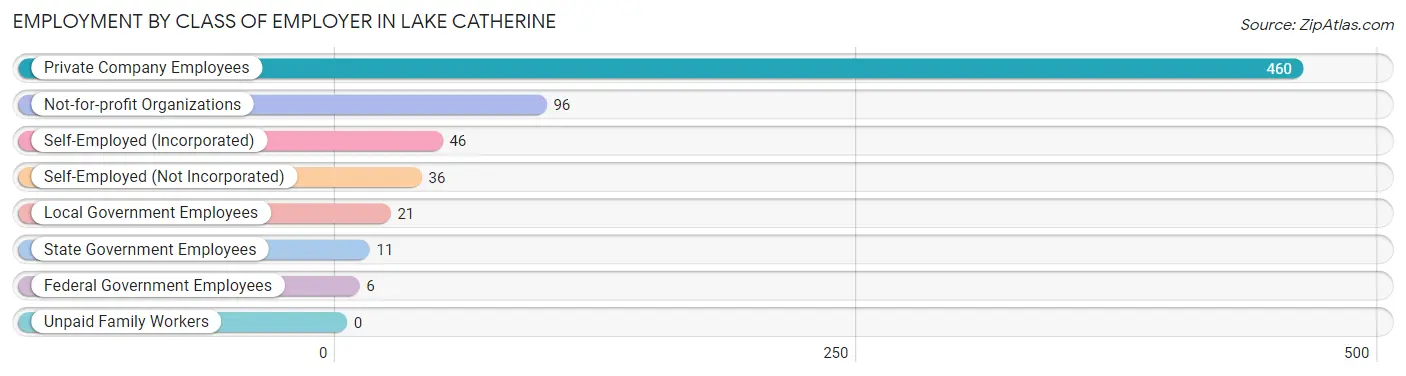
| Employer Class | # Employees | % Employees |
| Private Company Employees | 460 | 68.0% |
| Self-Employed (Incorporated) | 46 | 6.8% |
| Self-Employed (Not Incorporated) | 36 | 5.3% |
| Not-for-profit Organizations | 96 | 14.2% |
| Local Government Employees | 21 | 3.1% |
| State Government Employees | 11 | 1.6% |
| Federal Government Employees | 6 | 0.9% |
| Unpaid Family Workers | 0 | 0.0% |
| Total | 676 | 100.0% |
Employment Status by Age in Lake Catherine
According to the labor force statistics for Lake Catherine, out of the total population over 16 years of age (1,194), 64.6% or 771 individuals are in the labor force, with 10.0% or 77 of them unemployed. The age group with the highest labor force participation rate is 30 to 34 years, with 100.0% or 65 individuals in the labor force. Within the labor force, the 20 to 24 years age range has the highest percentage of unemployed individuals, with 76.0% or 57 of them being unemployed.
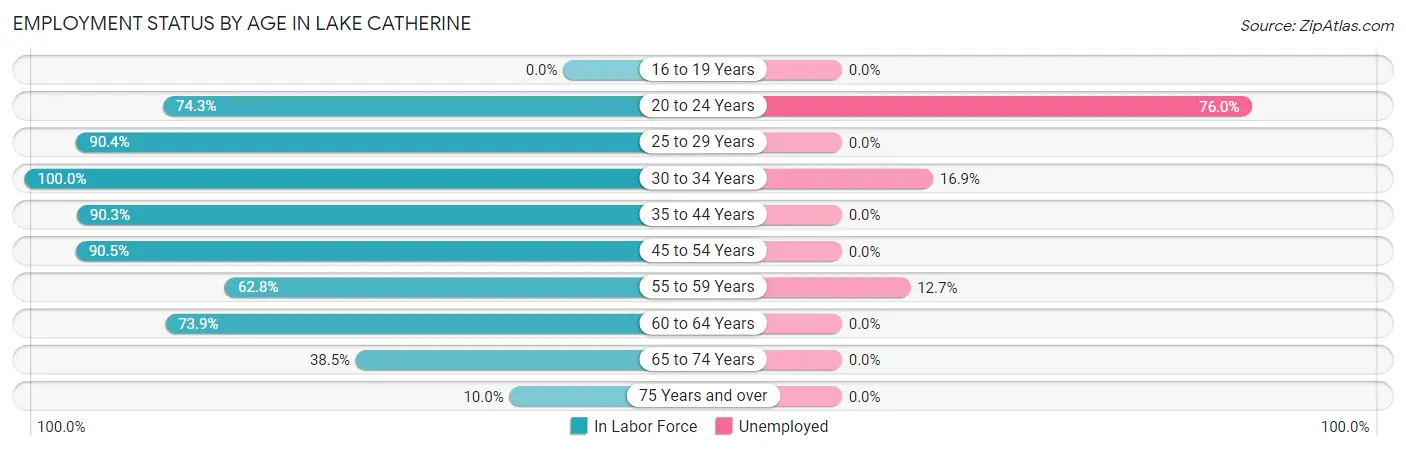
| Age Bracket | In Labor Force | Unemployed |
| 16 to 19 Years | 0 (0.0%) | 0 (0.0%) |
| 20 to 24 Years | 75 (74.3%) | 57 (76.0%) |
| 25 to 29 Years | 104 (90.4%) | 0 (0.0%) |
| 30 to 34 Years | 65 (100.0%) | 11 (16.9%) |
| 35 to 44 Years | 112 (90.3%) | 0 (0.0%) |
| 45 to 54 Years | 134 (90.5%) | 0 (0.0%) |
| 55 to 59 Years | 71 (62.8%) | 9 (12.7%) |
| 60 to 64 Years | 147 (73.9%) | 0 (0.0%) |
| 65 to 74 Years | 50 (38.5%) | 0 (0.0%) |
| 75 Years and over | 13 (10.0%) | 0 (0.0%) |
| Total | 771 (64.6%) | 77 (10.0%) |
Employment Status by Educational Attainment in Lake Catherine
According to labor force statistics for Lake Catherine, 82.9% of individuals (633) out of the total population between 25 and 64 years of age (764) are in the labor force, with 3.2% or 20 of them being unemployed. The group with the highest labor force participation rate are those with the educational attainment of bachelor's degree or higher, with 90.2% or 194 individuals in the labor force. Within the labor force, individuals with high school diploma education have the highest percentage of unemployment, with 8.8% or 20 of them being unemployed.
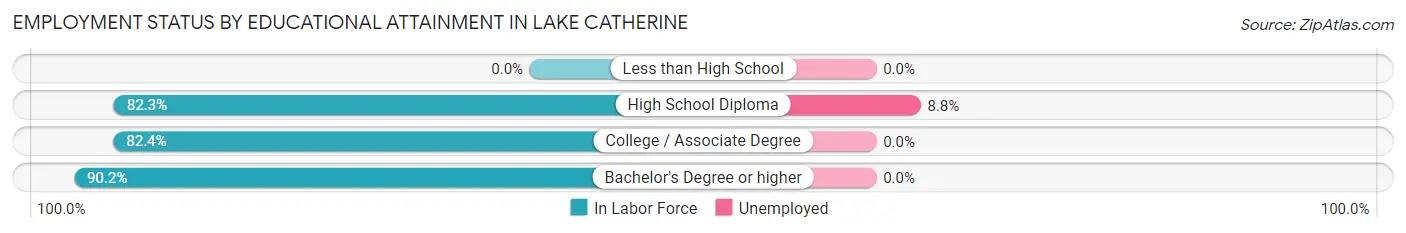
| Educational Attainment | In Labor Force | Unemployed |
| Less than High School | 0 (0.0%) | 0 (0.0%) |
| High School Diploma | 228 (82.3%) | 24 (8.8%) |
| College / Associate Degree | 211 (82.4%) | 0 (0.0%) |
| Bachelor's Degree or higher | 194 (90.2%) | 0 (0.0%) |
| Total | 633 (82.9%) | 24 (3.2%) |
Employment Occupations by Sex in Lake Catherine
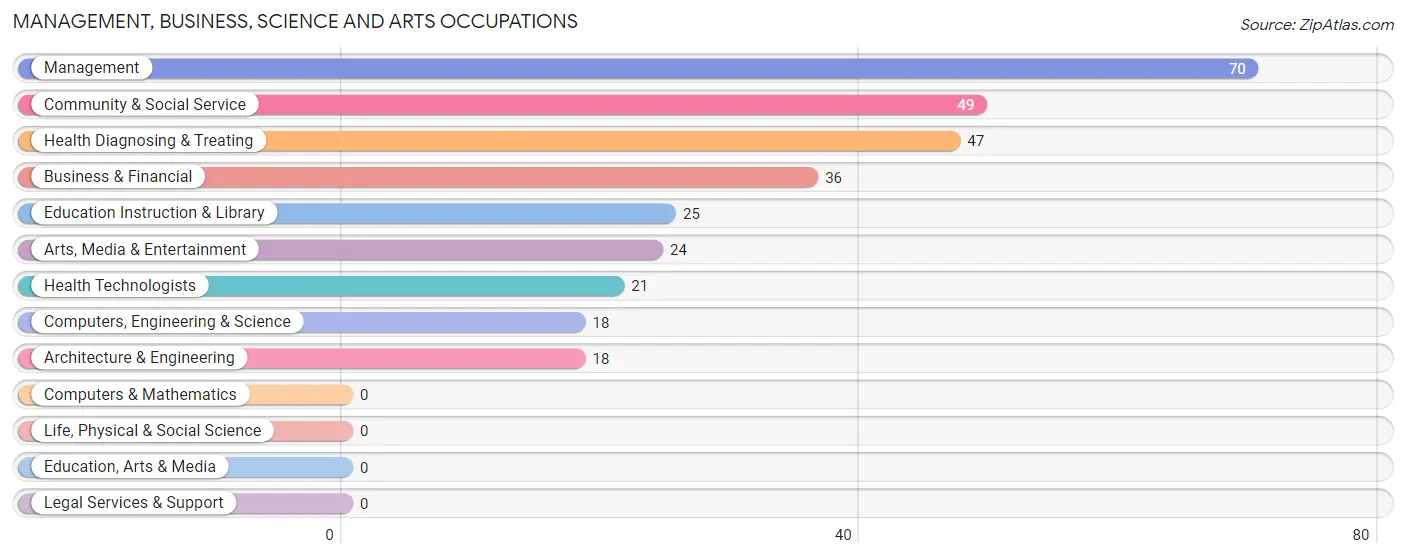
Management, Business, Science and Arts Occupations
The most common Management, Business, Science and Arts occupations in Lake Catherine are Management (70 | 10.1%), Community & Social Service (49 | 7.1%), Health Diagnosing & Treating (47 | 6.8%), Business & Financial (36 | 5.2%), and Education Instruction & Library (25 | 3.6%).
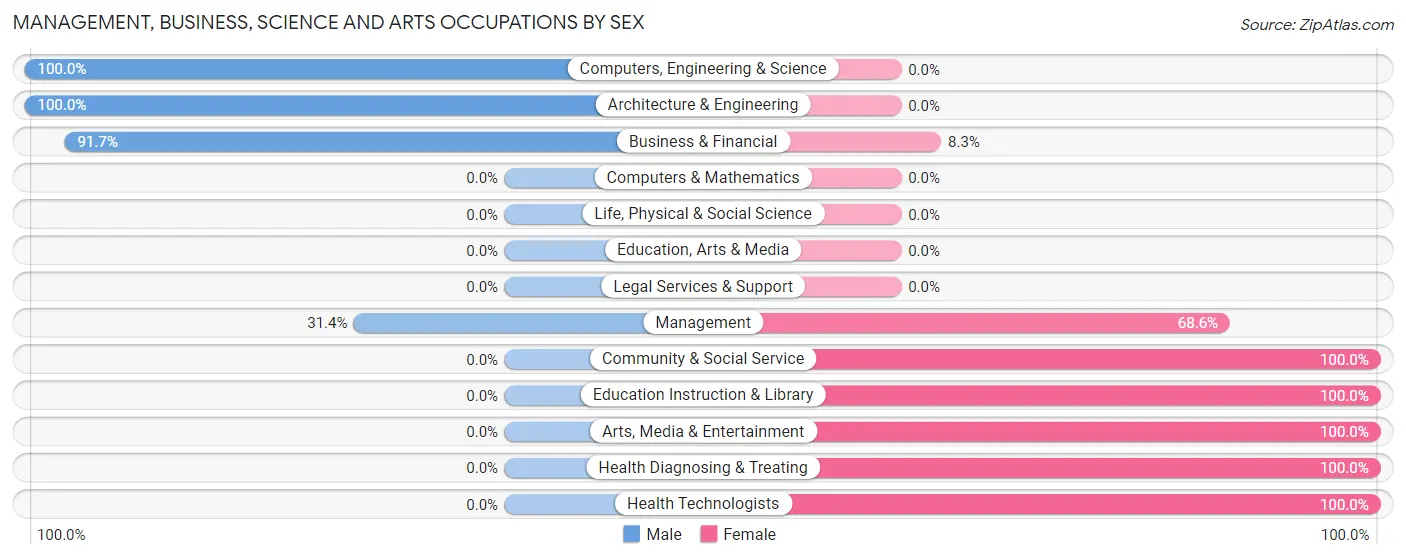
Management, Business, Science and Arts Occupations by Sex
Within the Management, Business, Science and Arts occupations in Lake Catherine, the most male-oriented occupations are Computers, Engineering & Science (100.0%), Architecture & Engineering (100.0%), and Business & Financial (91.7%), while the most female-oriented occupations are Community & Social Service (100.0%), Education Instruction & Library (100.0%), and Arts, Media & Entertainment (100.0%).
| Occupation | Male | Female |
| Management | 22 (31.4%) | 48 (68.6%) |
| Business & Financial | 33 (91.7%) | 3 (8.3%) |
| Computers, Engineering & Science | 18 (100.0%) | 0 (0.0%) |
| Computers & Mathematics | 0 (0.0%) | 0 (0.0%) |
| Architecture & Engineering | 18 (100.0%) | 0 (0.0%) |
| Life, Physical & Social Science | 0 (0.0%) | 0 (0.0%) |
| Community & Social Service | 0 (0.0%) | 49 (100.0%) |
| Education, Arts & Media | 0 (0.0%) | 0 (0.0%) |
| Legal Services & Support | 0 (0.0%) | 0 (0.0%) |
| Education Instruction & Library | 0 (0.0%) | 25 (100.0%) |
| Arts, Media & Entertainment | 0 (0.0%) | 24 (100.0%) |
| Health Diagnosing & Treating | 0 (0.0%) | 47 (100.0%) |
| Health Technologists | 0 (0.0%) | 21 (100.0%) |
| Total (Category) | 73 (33.2%) | 147 (66.8%) |
| Total (Overall) | 385 (55.5%) | 309 (44.5%) |
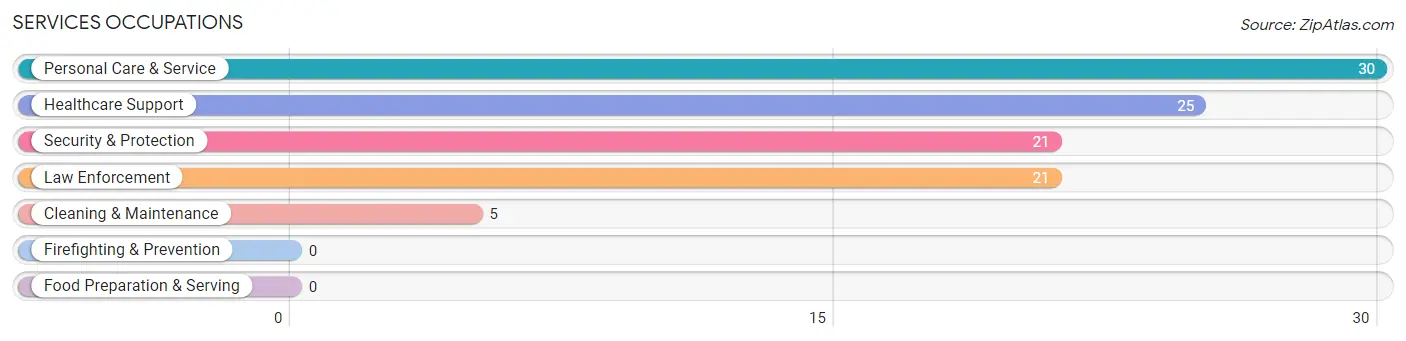
Services Occupations
The most common Services occupations in Lake Catherine are Personal Care & Service (30 | 4.3%), Healthcare Support (25 | 3.6%), Security & Protection (21 | 3.0%), Law Enforcement (21 | 3.0%), and Cleaning & Maintenance (5 | 0.7%).
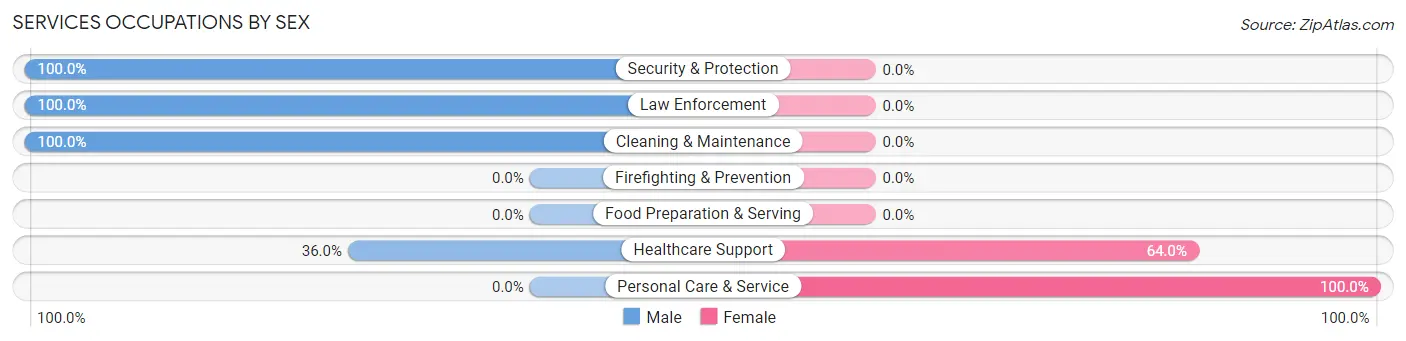
Services Occupations by Sex
Within the Services occupations in Lake Catherine, the most male-oriented occupations are Security & Protection (100.0%), Law Enforcement (100.0%), and Cleaning & Maintenance (100.0%), while the most female-oriented occupations are Personal Care & Service (100.0%), and Healthcare Support (64.0%).
| Occupation | Male | Female |
| Healthcare Support | 9 (36.0%) | 16 (64.0%) |
| Security & Protection | 21 (100.0%) | 0 (0.0%) |
| Firefighting & Prevention | 0 (0.0%) | 0 (0.0%) |
| Law Enforcement | 21 (100.0%) | 0 (0.0%) |
| Food Preparation & Serving | 0 (0.0%) | 0 (0.0%) |
| Cleaning & Maintenance | 5 (100.0%) | 0 (0.0%) |
| Personal Care & Service | 0 (0.0%) | 30 (100.0%) |
| Total (Category) | 35 (43.2%) | 46 (56.8%) |
| Total (Overall) | 385 (55.5%) | 309 (44.5%) |
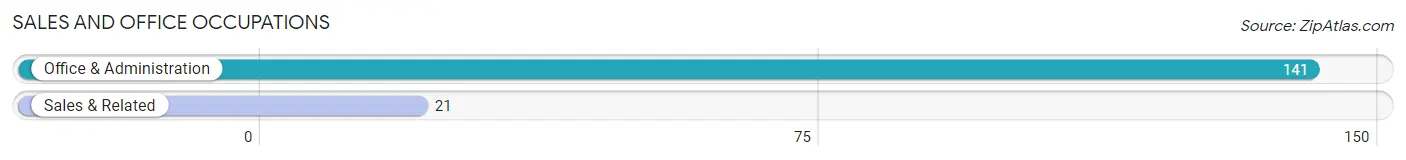
Sales and Office Occupations
The most common Sales and Office occupations in Lake Catherine are Office & Administration (141 | 20.3%), and Sales & Related (21 | 3.0%).
Sales and Office Occupations by Sex
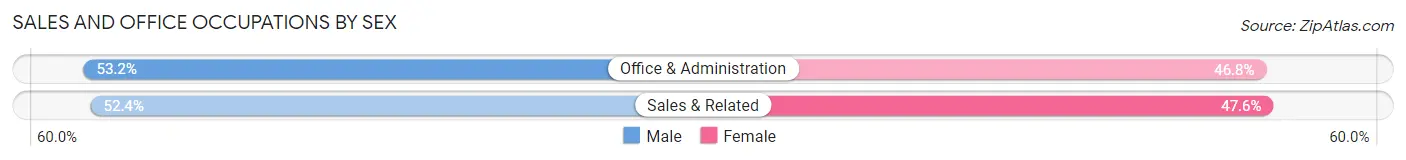
| Occupation | Male | Female |
| Sales & Related | 11 (52.4%) | 10 (47.6%) |
| Office & Administration | 75 (53.2%) | 66 (46.8%) |
| Total (Category) | 86 (53.1%) | 76 (46.9%) |
| Total (Overall) | 385 (55.5%) | 309 (44.5%) |
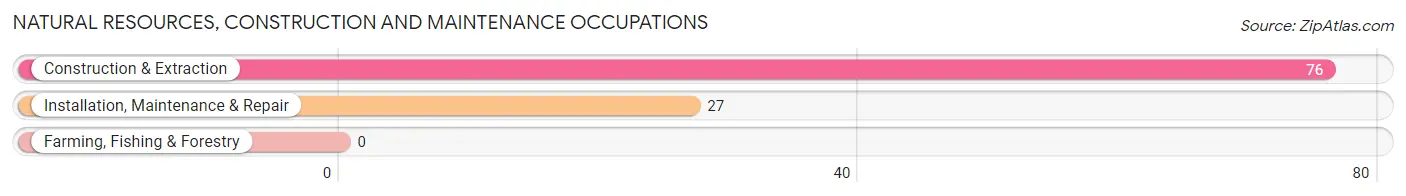
Natural Resources, Construction and Maintenance Occupations
The most common Natural Resources, Construction and Maintenance occupations in Lake Catherine are Construction & Extraction (76 | 11.0%), and Installation, Maintenance & Repair (27 | 3.9%).
Natural Resources, Construction and Maintenance Occupations by Sex
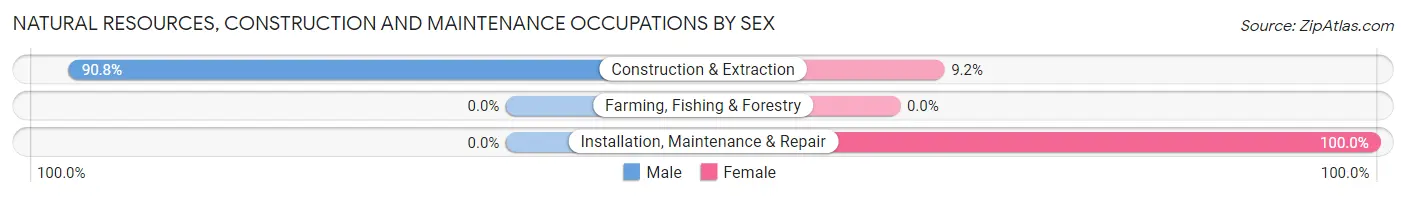
| Occupation | Male | Female |
| Farming, Fishing & Forestry | 0 (0.0%) | 0 (0.0%) |
| Construction & Extraction | 69 (90.8%) | 7 (9.2%) |
| Installation, Maintenance & Repair | 0 (0.0%) | 27 (100.0%) |
| Total (Category) | 69 (67.0%) | 34 (33.0%) |
| Total (Overall) | 385 (55.5%) | 309 (44.5%) |
Production, Transportation and Moving Occupations
The most common Production, Transportation and Moving occupations in Lake Catherine are Transportation (86 | 12.4%), and Production (42 | 6.0%).
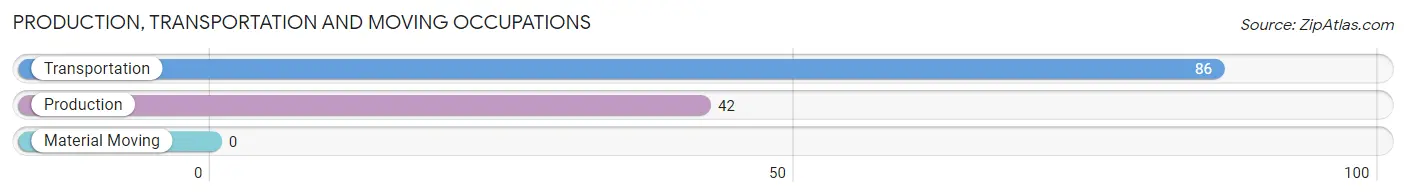
Production, Transportation and Moving Occupations by Sex
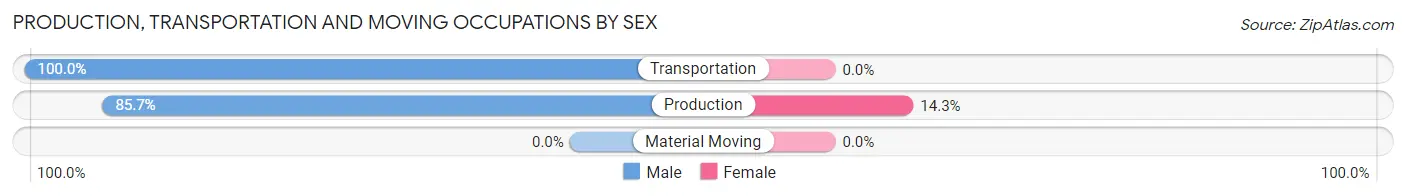
| Occupation | Male | Female |
| Production | 36 (85.7%) | 6 (14.3%) |
| Transportation | 86 (100.0%) | 0 (0.0%) |
| Material Moving | 0 (0.0%) | 0 (0.0%) |
| Total (Category) | 122 (95.3%) | 6 (4.7%) |
| Total (Overall) | 385 (55.5%) | 309 (44.5%) |
Employment Industries by Sex in Lake Catherine
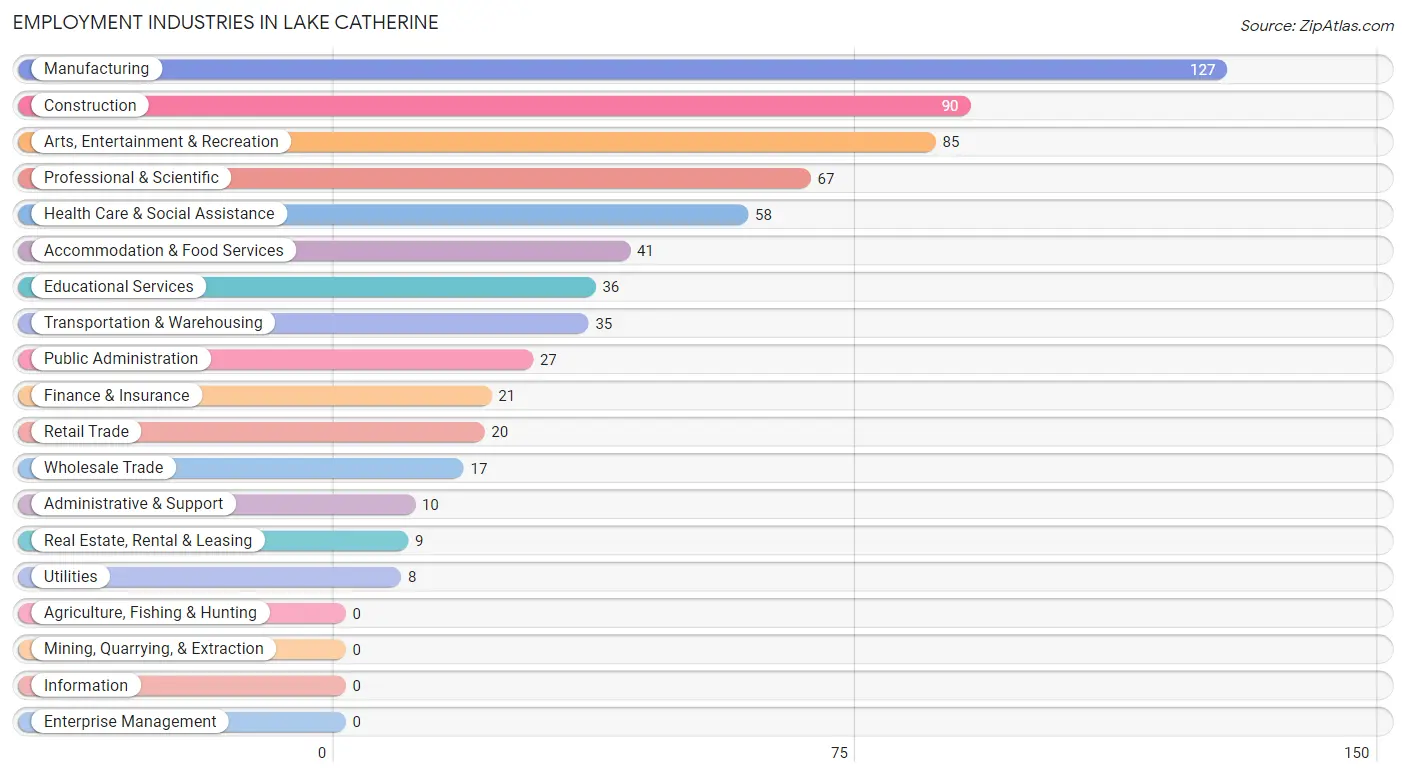
Employment Industries in Lake Catherine
The major employment industries in Lake Catherine include Manufacturing (127 | 18.3%), Construction (90 | 13.0%), Arts, Entertainment & Recreation (85 | 12.2%), Professional & Scientific (67 | 9.7%), and Health Care & Social Assistance (58 | 8.4%).
Employment Industries by Sex in Lake Catherine
The Lake Catherine industries that see more men than women are Transportation & Warehousing (100.0%), Finance & Insurance (100.0%), and Administrative & Support (100.0%), whereas the industries that tend to have a higher number of women are Utilities (100.0%), Health Care & Social Assistance (100.0%), and Retail Trade (70.0%).
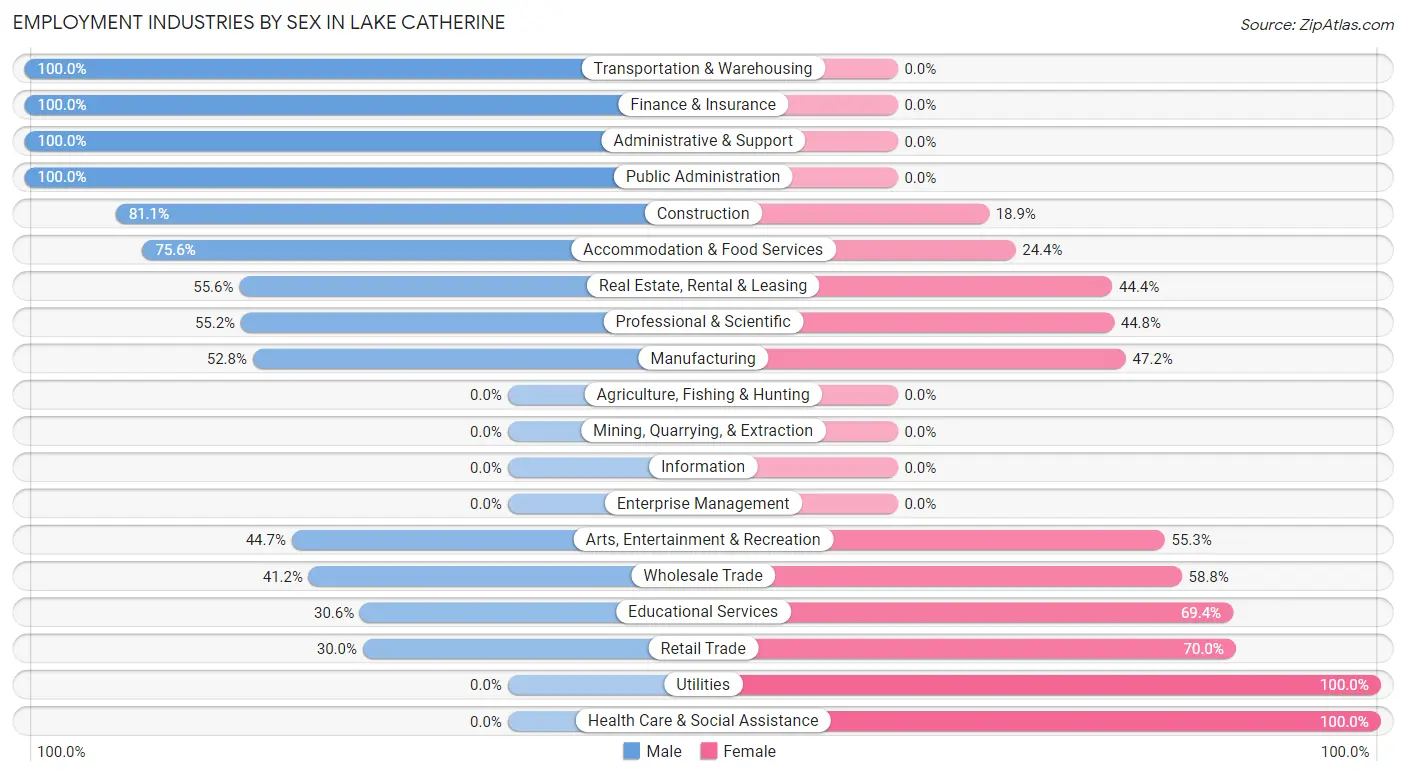
| Industry | Male | Female |
| Agriculture, Fishing & Hunting | 0 (0.0%) | 0 (0.0%) |
| Mining, Quarrying, & Extraction | 0 (0.0%) | 0 (0.0%) |
| Construction | 73 (81.1%) | 17 (18.9%) |
| Manufacturing | 67 (52.8%) | 60 (47.2%) |
| Wholesale Trade | 7 (41.2%) | 10 (58.8%) |
| Retail Trade | 6 (30.0%) | 14 (70.0%) |
| Transportation & Warehousing | 35 (100.0%) | 0 (0.0%) |
| Utilities | 0 (0.0%) | 8 (100.0%) |
| Information | 0 (0.0%) | 0 (0.0%) |
| Finance & Insurance | 21 (100.0%) | 0 (0.0%) |
| Real Estate, Rental & Leasing | 5 (55.6%) | 4 (44.4%) |
| Professional & Scientific | 37 (55.2%) | 30 (44.8%) |
| Enterprise Management | 0 (0.0%) | 0 (0.0%) |
| Administrative & Support | 10 (100.0%) | 0 (0.0%) |
| Educational Services | 11 (30.6%) | 25 (69.4%) |
| Health Care & Social Assistance | 0 (0.0%) | 58 (100.0%) |
| Arts, Entertainment & Recreation | 38 (44.7%) | 47 (55.3%) |
| Accommodation & Food Services | 31 (75.6%) | 10 (24.4%) |
| Public Administration | 27 (100.0%) | 0 (0.0%) |
| Total | 385 (55.5%) | 309 (44.5%) |
Education in Lake Catherine
School Enrollment in Lake Catherine
The most common levels of schooling among the 198 students in Lake Catherine are high school (81 | 40.9%), college / undergraduate (59 | 29.8%), and middle school (27 | 13.6%).
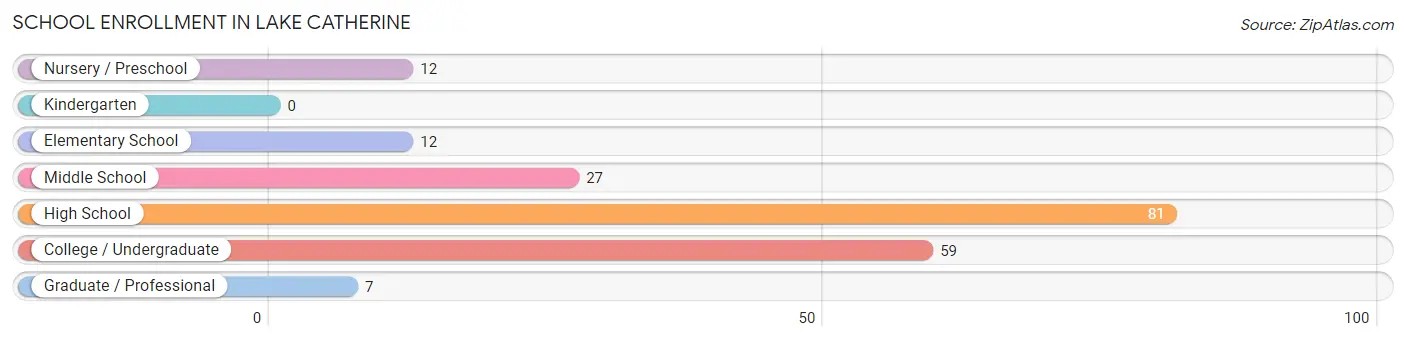
| School Level | # Students | % Students |
| Nursery / Preschool | 12 | 6.1% |
| Kindergarten | 0 | 0.0% |
| Elementary School | 12 | 6.1% |
| Middle School | 27 | 13.6% |
| High School | 81 | 40.9% |
| College / Undergraduate | 59 | 29.8% |
| Graduate / Professional | 7 | 3.5% |
| Total | 198 | 100.0% |
School Enrollment by Age by Funding Source in Lake Catherine
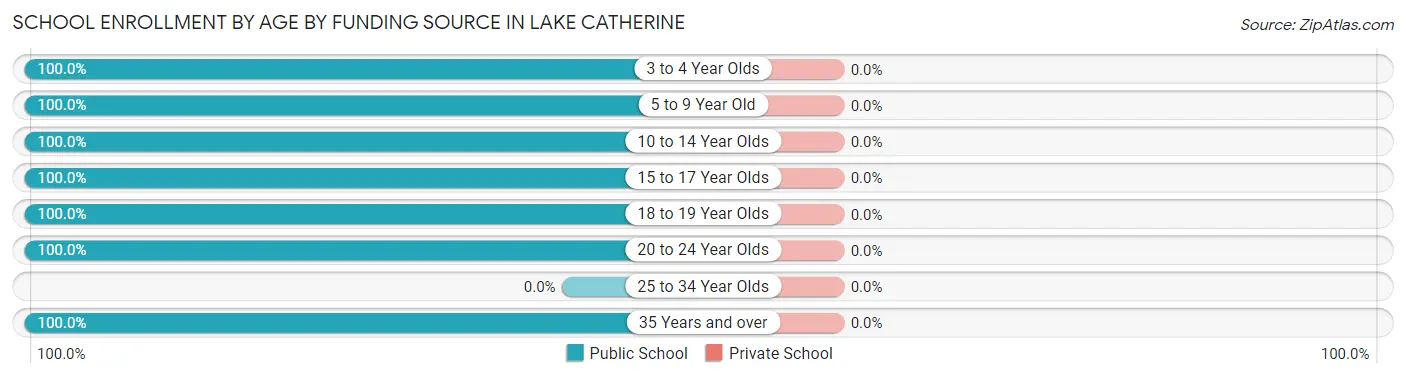
| Age Bracket | Public School | Private School |
| 3 to 4 Year Olds | 12 (100.0%) | 0 (0.0%) |
| 5 to 9 Year Old | 9 (100.0%) | 0 (0.0%) |
| 10 to 14 Year Olds | 51 (100.0%) | 0 (0.0%) |
| 15 to 17 Year Olds | 60 (100.0%) | 0 (0.0%) |
| 18 to 19 Year Olds | 33 (100.0%) | 0 (0.0%) |
| 20 to 24 Year Olds | 26 (100.0%) | 0 (0.0%) |
| 25 to 34 Year Olds | 0 (0.0%) | 0 (0.0%) |
| 35 Years and over | 7 (100.0%) | 0 (0.0%) |
| Total | 198 (100.0%) | 0 (0.0%) |
Educational Attainment by Field of Study in Lake Catherine
Arts & humanities (73 | 27.0%), education (71 | 26.3%), bio, nature & agricultural (31 | 11.5%), business (30 | 11.1%), and science & technology (29 | 10.7%) are the most common fields of study among 270 individuals in Lake Catherine who have obtained a bachelor's degree or higher.
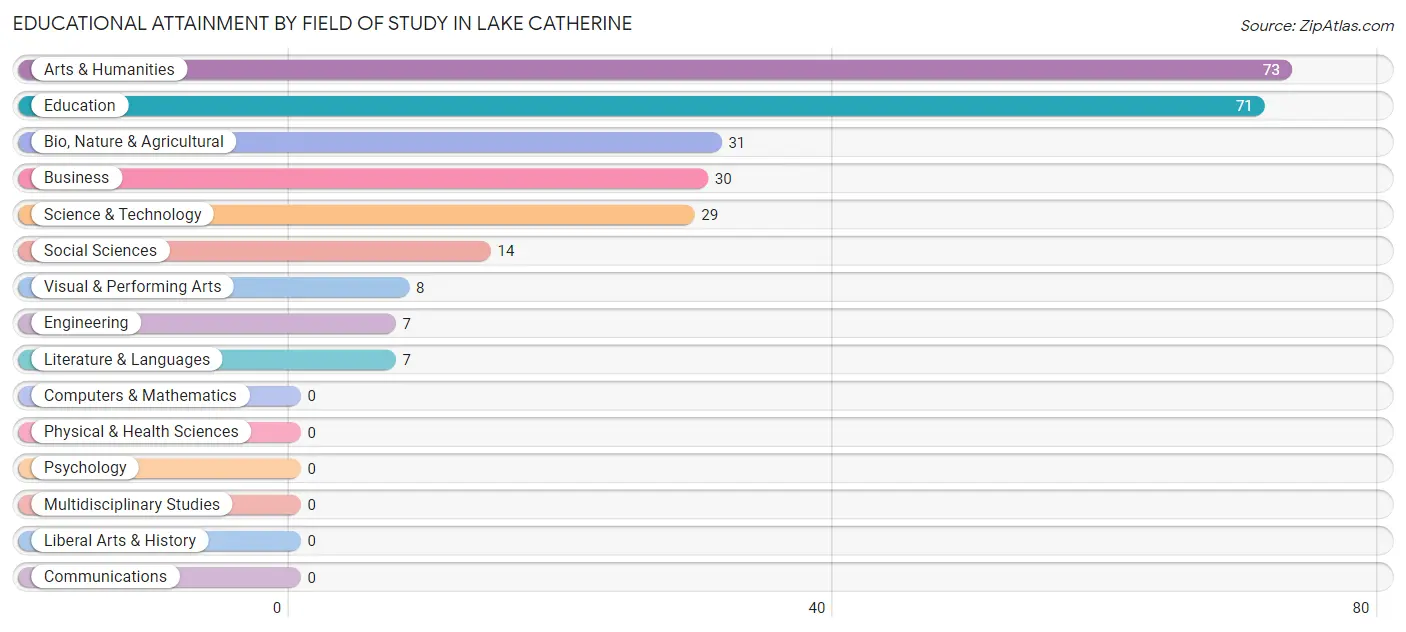
| Field of Study | # Graduates | % Graduates |
| Computers & Mathematics | 0 | 0.0% |
| Bio, Nature & Agricultural | 31 | 11.5% |
| Physical & Health Sciences | 0 | 0.0% |
| Psychology | 0 | 0.0% |
| Social Sciences | 14 | 5.2% |
| Engineering | 7 | 2.6% |
| Multidisciplinary Studies | 0 | 0.0% |
| Science & Technology | 29 | 10.7% |
| Business | 30 | 11.1% |
| Education | 71 | 26.3% |
| Literature & Languages | 7 | 2.6% |
| Liberal Arts & History | 0 | 0.0% |
| Visual & Performing Arts | 8 | 3.0% |
| Communications | 0 | 0.0% |
| Arts & Humanities | 73 | 27.0% |
| Total | 270 | 100.0% |
Transportation & Commute in Lake Catherine
Vehicle Availability by Sex in Lake Catherine
The most prevalent vehicle ownership categories in Lake Catherine are males with 3 vehicles (159, accounting for 42.5%) and females with 3 vehicles (111, making up 52.6%).
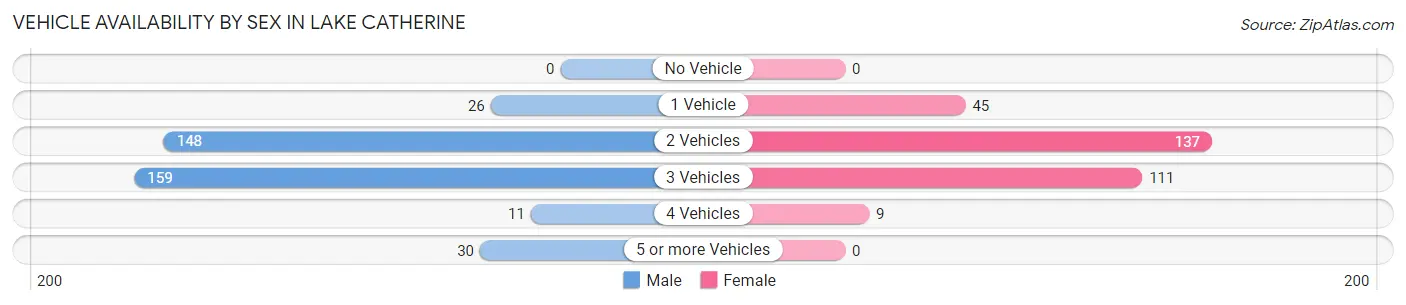
| Vehicles Available | Male | Female |
| No Vehicle | 0 (0.0%) | 0 (0.0%) |
| 1 Vehicle | 26 (7.0%) | 45 (14.9%) |
| 2 Vehicles | 148 (39.6%) | 137 (45.4%) |
| 3 Vehicles | 159 (42.5%) | 111 (36.7%) |
| 4 Vehicles | 11 (2.9%) | 9 (3.0%) |
| 5 or more Vehicles | 30 (8.0%) | 0 (0.0%) |
| Total | 374 (100.0%) | 302 (100.0%) |
Commute Time in Lake Catherine
The most frequently occuring commute durations in Lake Catherine are 45 to 59 minutes (204 commuters, 33.6%), 5 to 9 minutes (104 commuters, 17.1%), and 10 to 14 minutes (95 commuters, 15.6%).
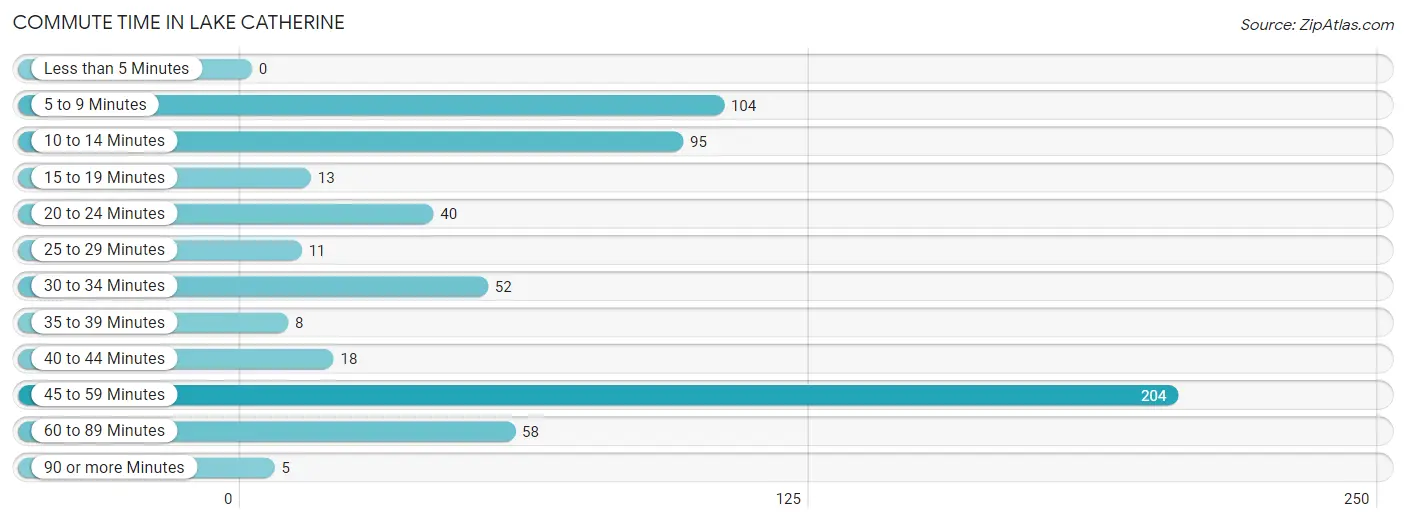
| Commute Time | # Commuters | % Commuters |
| Less than 5 Minutes | 0 | 0.0% |
| 5 to 9 Minutes | 104 | 17.1% |
| 10 to 14 Minutes | 95 | 15.6% |
| 15 to 19 Minutes | 13 | 2.1% |
| 20 to 24 Minutes | 40 | 6.6% |
| 25 to 29 Minutes | 11 | 1.8% |
| 30 to 34 Minutes | 52 | 8.6% |
| 35 to 39 Minutes | 8 | 1.3% |
| 40 to 44 Minutes | 18 | 3.0% |
| 45 to 59 Minutes | 204 | 33.6% |
| 60 to 89 Minutes | 58 | 9.5% |
| 90 or more Minutes | 5 | 0.8% |
Commute Time by Sex in Lake Catherine
The most common commute times in Lake Catherine are 45 to 59 minutes (116 commuters, 33.8%) for males and 45 to 59 minutes (88 commuters, 33.2%) for females.
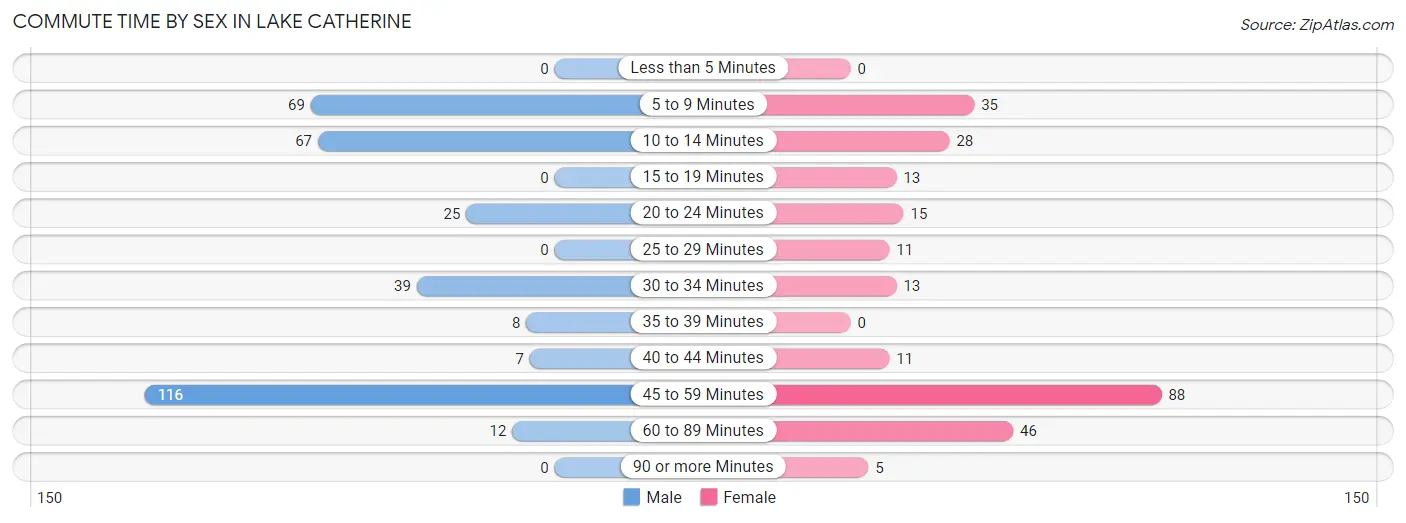
| Commute Time | Male | Female |
| Less than 5 Minutes | 0 (0.0%) | 0 (0.0%) |
| 5 to 9 Minutes | 69 (20.1%) | 35 (13.2%) |
| 10 to 14 Minutes | 67 (19.5%) | 28 (10.6%) |
| 15 to 19 Minutes | 0 (0.0%) | 13 (4.9%) |
| 20 to 24 Minutes | 25 (7.3%) | 15 (5.7%) |
| 25 to 29 Minutes | 0 (0.0%) | 11 (4.2%) |
| 30 to 34 Minutes | 39 (11.4%) | 13 (4.9%) |
| 35 to 39 Minutes | 8 (2.3%) | 0 (0.0%) |
| 40 to 44 Minutes | 7 (2.0%) | 11 (4.2%) |
| 45 to 59 Minutes | 116 (33.8%) | 88 (33.2%) |
| 60 to 89 Minutes | 12 (3.5%) | 46 (17.4%) |
| 90 or more Minutes | 0 (0.0%) | 5 (1.9%) |
Time of Departure to Work by Sex in Lake Catherine
The most frequent times of departure to work in Lake Catherine are 7:30 AM to 7:59 AM (68, 19.8%) for males and 7:00 AM to 7:29 AM (53, 20.0%) for females.
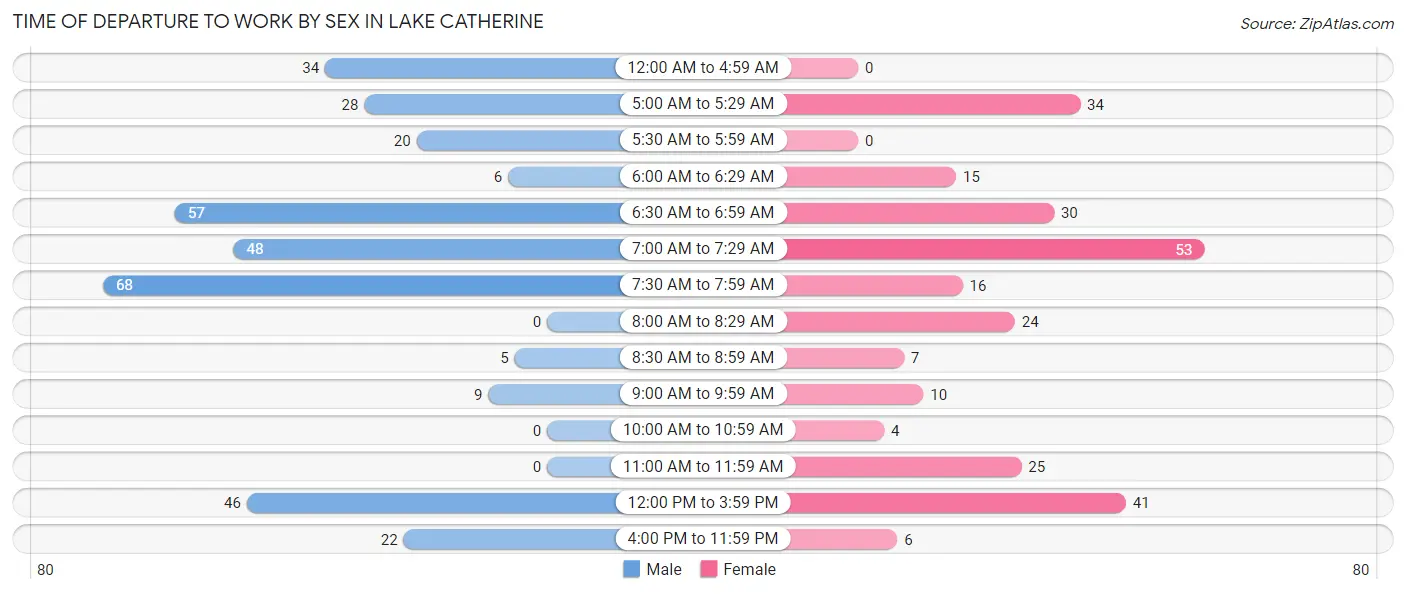
| Time of Departure | Male | Female |
| 12:00 AM to 4:59 AM | 34 (9.9%) | 0 (0.0%) |
| 5:00 AM to 5:29 AM | 28 (8.2%) | 34 (12.8%) |
| 5:30 AM to 5:59 AM | 20 (5.8%) | 0 (0.0%) |
| 6:00 AM to 6:29 AM | 6 (1.8%) | 15 (5.7%) |
| 6:30 AM to 6:59 AM | 57 (16.6%) | 30 (11.3%) |
| 7:00 AM to 7:29 AM | 48 (14.0%) | 53 (20.0%) |
| 7:30 AM to 7:59 AM | 68 (19.8%) | 16 (6.0%) |
| 8:00 AM to 8:29 AM | 0 (0.0%) | 24 (9.1%) |
| 8:30 AM to 8:59 AM | 5 (1.5%) | 7 (2.6%) |
| 9:00 AM to 9:59 AM | 9 (2.6%) | 10 (3.8%) |
| 10:00 AM to 10:59 AM | 0 (0.0%) | 4 (1.5%) |
| 11:00 AM to 11:59 AM | 0 (0.0%) | 25 (9.4%) |
| 12:00 PM to 3:59 PM | 46 (13.4%) | 41 (15.5%) |
| 4:00 PM to 11:59 PM | 22 (6.4%) | 6 (2.3%) |
| Total | 343 (100.0%) | 265 (100.0%) |
Housing Occupancy in Lake Catherine
Occupancy by Ownership in Lake Catherine
Of the total 586 dwellings in Lake Catherine, owner-occupied units account for 426 (72.7%), while renter-occupied units make up 160 (27.3%).
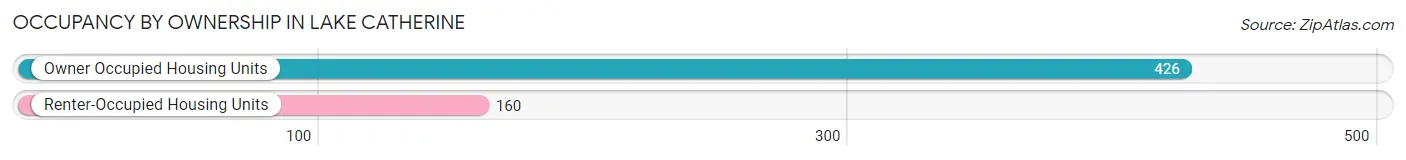
| Occupancy | # Housing Units | % Housing Units |
| Owner Occupied Housing Units | 426 | 72.7% |
| Renter-Occupied Housing Units | 160 | 27.3% |
| Total Occupied Housing Units | 586 | 100.0% |
Occupancy by Household Size in Lake Catherine
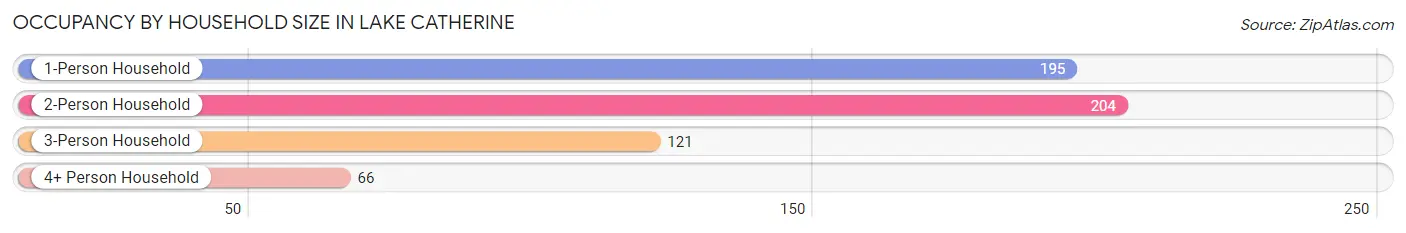
| Household Size | # Housing Units | % Housing Units |
| 1-Person Household | 195 | 33.3% |
| 2-Person Household | 204 | 34.8% |
| 3-Person Household | 121 | 20.6% |
| 4+ Person Household | 66 | 11.3% |
| Total Housing Units | 586 | 100.0% |
Occupancy by Ownership by Household Size in Lake Catherine
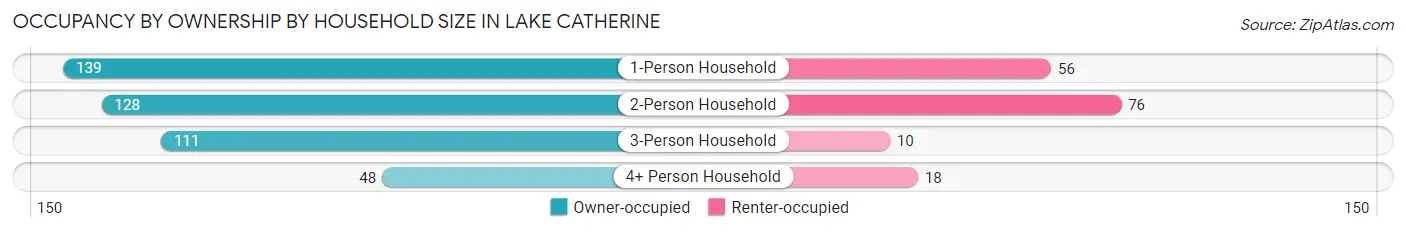
| Household Size | Owner-occupied | Renter-occupied |
| 1-Person Household | 139 (71.3%) | 56 (28.7%) |
| 2-Person Household | 128 (62.7%) | 76 (37.2%) |
| 3-Person Household | 111 (91.7%) | 10 (8.3%) |
| 4+ Person Household | 48 (72.7%) | 18 (27.3%) |
| Total Housing Units | 426 (72.7%) | 160 (27.3%) |
Occupancy by Educational Attainment in Lake Catherine
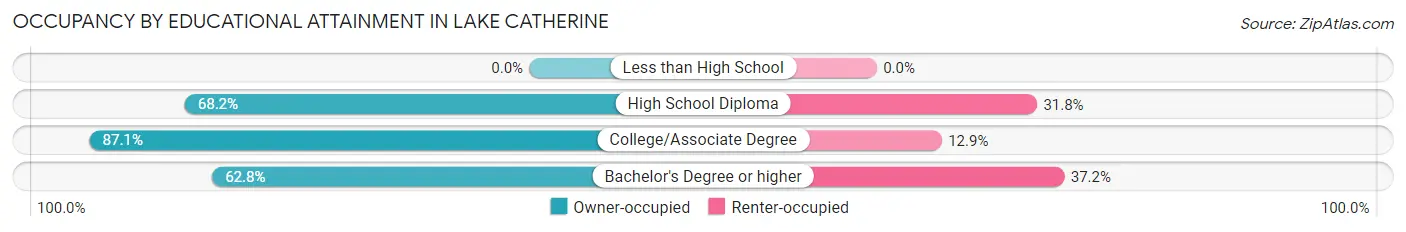
| Household Size | Owner-occupied | Renter-occupied |
| Less than High School | 0 (0.0%) | 0 (0.0%) |
| High School Diploma | 161 (68.2%) | 75 (31.8%) |
| College/Associate Degree | 162 (87.1%) | 24 (12.9%) |
| Bachelor's Degree or higher | 103 (62.8%) | 61 (37.2%) |
Occupancy by Age of Householder in Lake Catherine
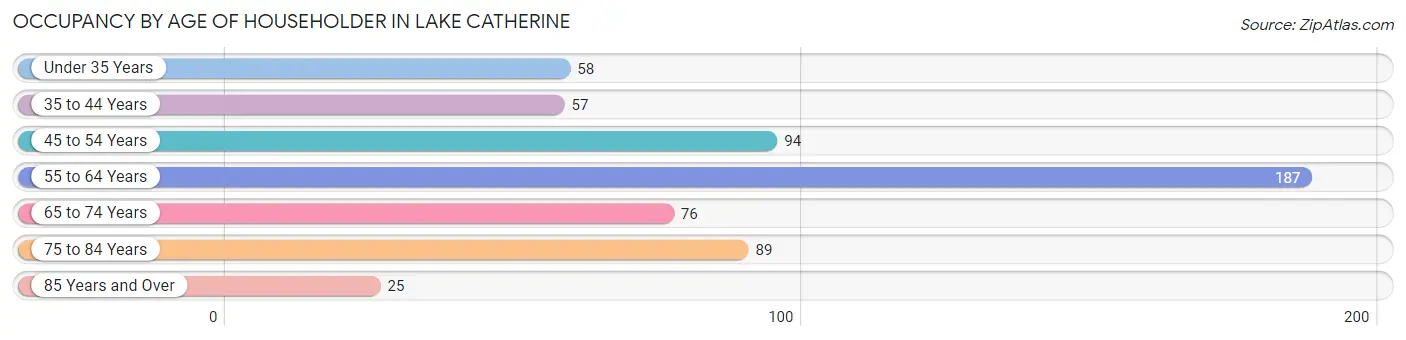
| Age Bracket | # Households | % Households |
| Under 35 Years | 58 | 9.9% |
| 35 to 44 Years | 57 | 9.7% |
| 45 to 54 Years | 94 | 16.0% |
| 55 to 64 Years | 187 | 31.9% |
| 65 to 74 Years | 76 | 13.0% |
| 75 to 84 Years | 89 | 15.2% |
| 85 Years and Over | 25 | 4.3% |
| Total | 586 | 100.0% |
Housing Finances in Lake Catherine
Median Income by Occupancy in Lake Catherine
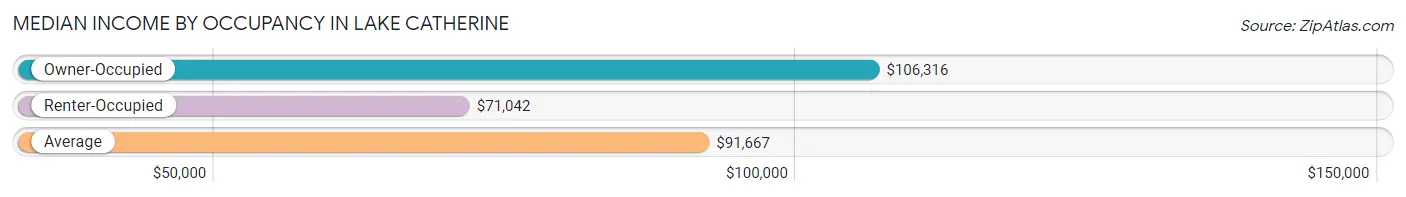
| Occupancy Type | # Households | Median Income |
| Owner-Occupied | 426 (72.7%) | $106,316 |
| Renter-Occupied | 160 (27.3%) | $71,042 |
| Average | 586 (100.0%) | $91,667 |
Occupancy by Householder Income Bracket in Lake Catherine
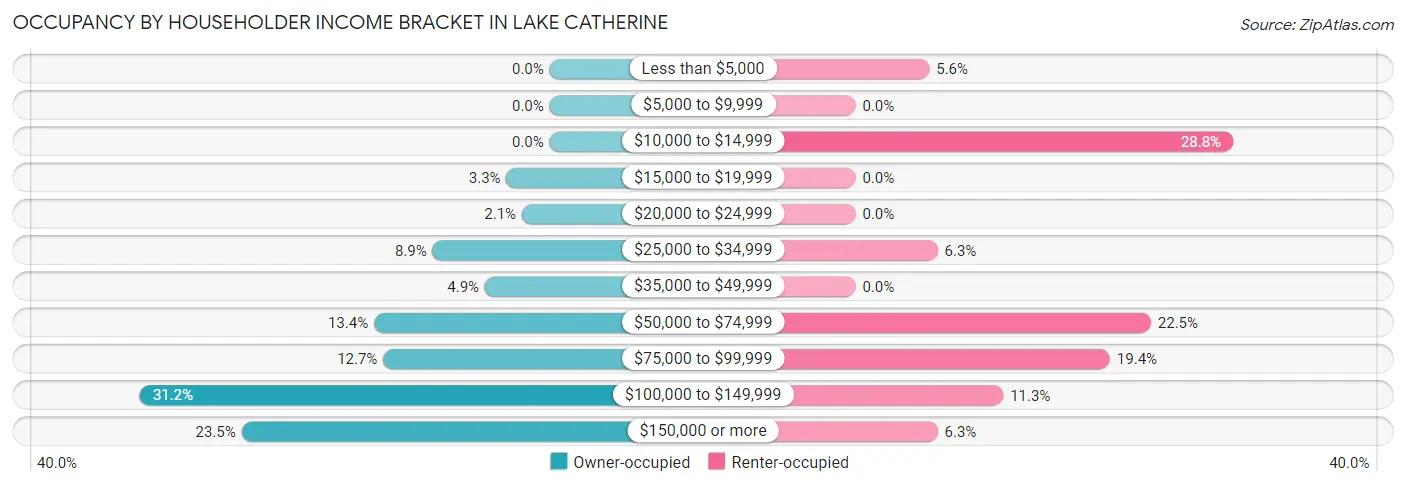
| Income Bracket | Owner-occupied | Renter-occupied |
| Less than $5,000 | 0 (0.0%) | 9 (5.6%) |
| $5,000 to $9,999 | 0 (0.0%) | 0 (0.0%) |
| $10,000 to $14,999 | 0 (0.0%) | 46 (28.7%) |
| $15,000 to $19,999 | 14 (3.3%) | 0 (0.0%) |
| $20,000 to $24,999 | 9 (2.1%) | 0 (0.0%) |
| $25,000 to $34,999 | 38 (8.9%) | 10 (6.2%) |
| $35,000 to $49,999 | 21 (4.9%) | 0 (0.0%) |
| $50,000 to $74,999 | 57 (13.4%) | 36 (22.5%) |
| $75,000 to $99,999 | 54 (12.7%) | 31 (19.4%) |
| $100,000 to $149,999 | 133 (31.2%) | 18 (11.3%) |
| $150,000 or more | 100 (23.5%) | 10 (6.2%) |
| Total | 426 (100.0%) | 160 (100.0%) |
Monthly Housing Cost Tiers in Lake Catherine
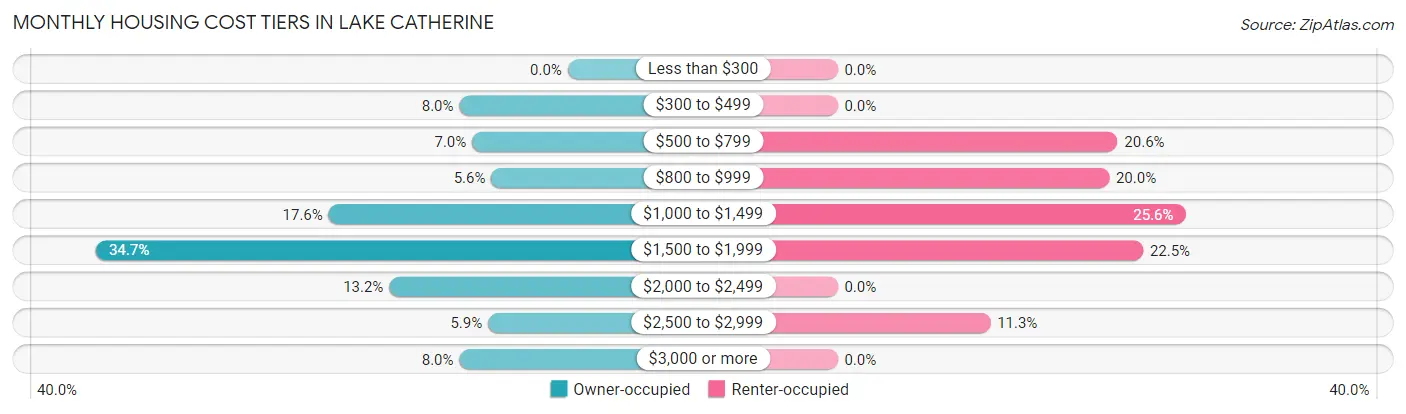
| Monthly Cost | Owner-occupied | Renter-occupied |
| Less than $300 | 0 (0.0%) | 0 (0.0%) |
| $300 to $499 | 34 (8.0%) | 0 (0.0%) |
| $500 to $799 | 30 (7.0%) | 33 (20.6%) |
| $800 to $999 | 24 (5.6%) | 32 (20.0%) |
| $1,000 to $1,499 | 75 (17.6%) | 41 (25.6%) |
| $1,500 to $1,999 | 148 (34.7%) | 36 (22.5%) |
| $2,000 to $2,499 | 56 (13.2%) | 0 (0.0%) |
| $2,500 to $2,999 | 25 (5.9%) | 18 (11.3%) |
| $3,000 or more | 34 (8.0%) | 0 (0.0%) |
| Total | 426 (100.0%) | 160 (100.0%) |
Physical Housing Characteristics in Lake Catherine
Housing Structures in Lake Catherine
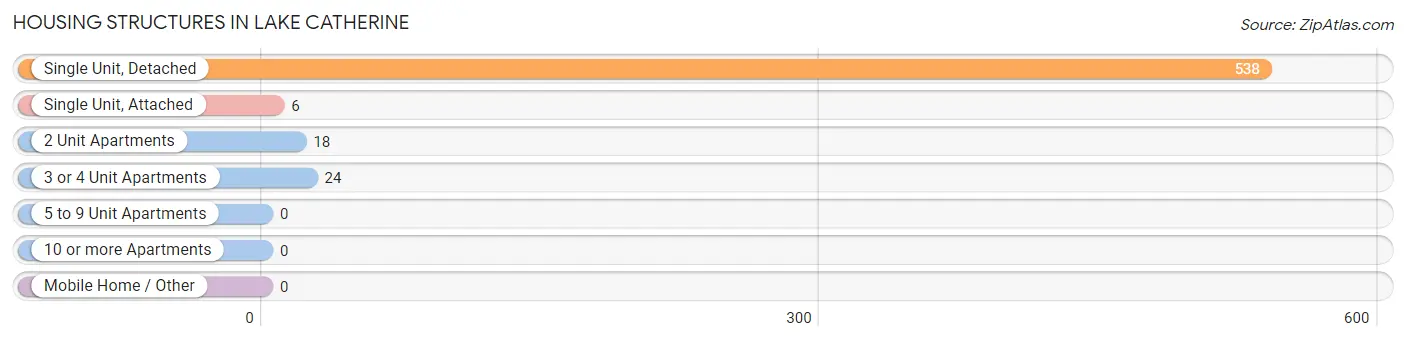
| Structure Type | # Housing Units | % Housing Units |
| Single Unit, Detached | 538 | 91.8% |
| Single Unit, Attached | 6 | 1.0% |
| 2 Unit Apartments | 18 | 3.1% |
| 3 or 4 Unit Apartments | 24 | 4.1% |
| 5 to 9 Unit Apartments | 0 | 0.0% |
| 10 or more Apartments | 0 | 0.0% |
| Mobile Home / Other | 0 | 0.0% |
| Total | 586 | 100.0% |
Housing Structures by Occupancy in Lake Catherine
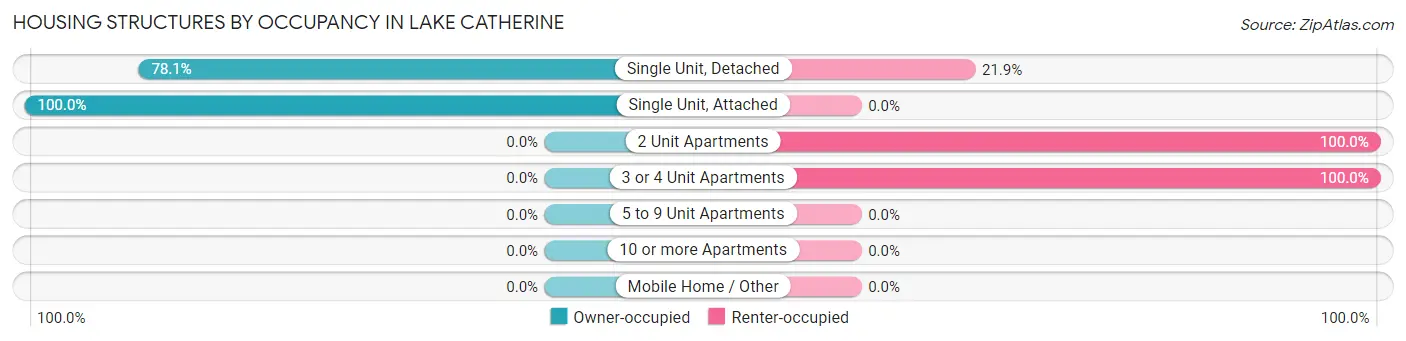
| Structure Type | Owner-occupied | Renter-occupied |
| Single Unit, Detached | 420 (78.1%) | 118 (21.9%) |
| Single Unit, Attached | 6 (100.0%) | 0 (0.0%) |
| 2 Unit Apartments | 0 (0.0%) | 18 (100.0%) |
| 3 or 4 Unit Apartments | 0 (0.0%) | 24 (100.0%) |
| 5 to 9 Unit Apartments | 0 (0.0%) | 0 (0.0%) |
| 10 or more Apartments | 0 (0.0%) | 0 (0.0%) |
| Mobile Home / Other | 0 (0.0%) | 0 (0.0%) |
| Total | 426 (72.7%) | 160 (27.3%) |
Housing Structures by Number of Rooms in Lake Catherine
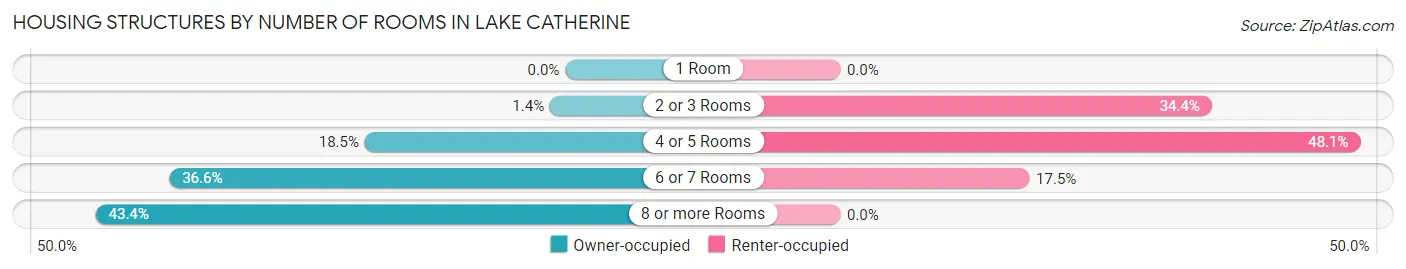
| Number of Rooms | Owner-occupied | Renter-occupied |
| 1 Room | 0 (0.0%) | 0 (0.0%) |
| 2 or 3 Rooms | 6 (1.4%) | 55 (34.4%) |
| 4 or 5 Rooms | 79 (18.5%) | 77 (48.1%) |
| 6 or 7 Rooms | 156 (36.6%) | 28 (17.5%) |
| 8 or more Rooms | 185 (43.4%) | 0 (0.0%) |
| Total | 426 (100.0%) | 160 (100.0%) |
Housing Structure by Heating Type in Lake Catherine
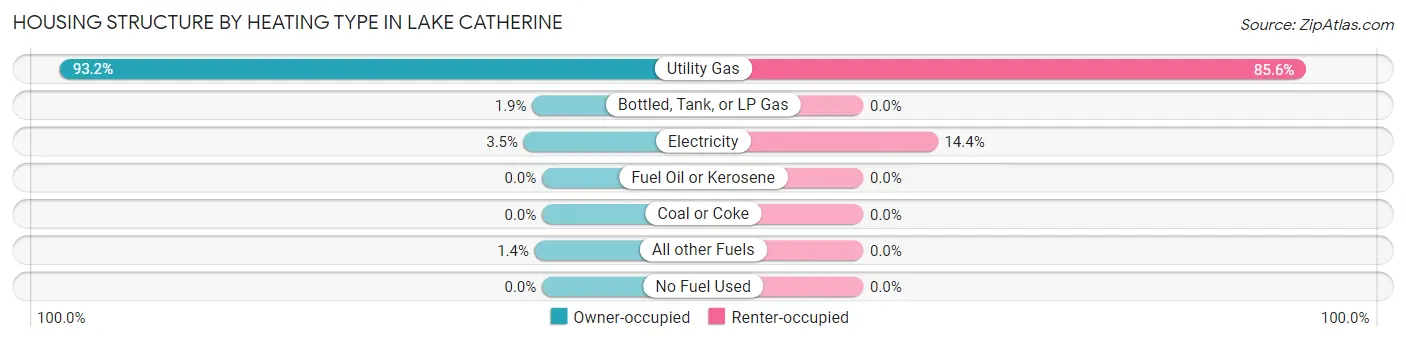
| Heating Type | Owner-occupied | Renter-occupied |
| Utility Gas | 397 (93.2%) | 137 (85.6%) |
| Bottled, Tank, or LP Gas | 8 (1.9%) | 0 (0.0%) |
| Electricity | 15 (3.5%) | 23 (14.4%) |
| Fuel Oil or Kerosene | 0 (0.0%) | 0 (0.0%) |
| Coal or Coke | 0 (0.0%) | 0 (0.0%) |
| All other Fuels | 6 (1.4%) | 0 (0.0%) |
| No Fuel Used | 0 (0.0%) | 0 (0.0%) |
| Total | 426 (100.0%) | 160 (100.0%) |
Household Vehicle Usage in Lake Catherine
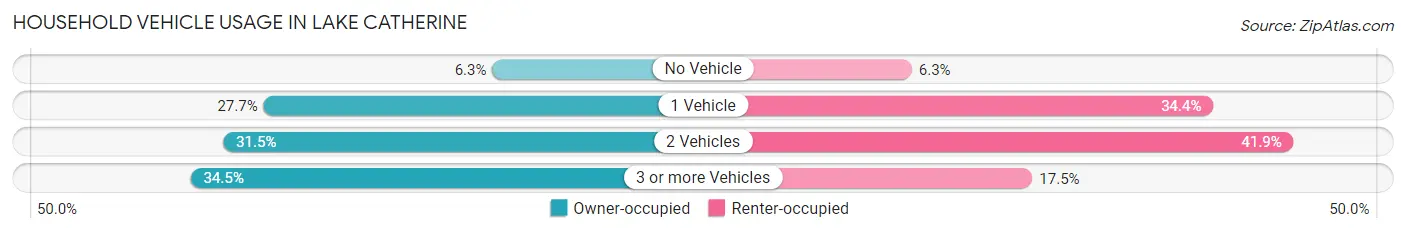
| Vehicles per Household | Owner-occupied | Renter-occupied |
| No Vehicle | 27 (6.3%) | 10 (6.2%) |
| 1 Vehicle | 118 (27.7%) | 55 (34.4%) |
| 2 Vehicles | 134 (31.5%) | 67 (41.9%) |
| 3 or more Vehicles | 147 (34.5%) | 28 (17.5%) |
| Total | 426 (100.0%) | 160 (100.0%) |
Real Estate & Mortgages in Lake Catherine
Real Estate and Mortgage Overview in Lake Catherine
| Characteristic | Without Mortgage | With Mortgage |
| Housing Units | 122 | 304 |
| Median Property Value | $210,000 | $243,000 |
| Median Household Income | $57,143 | $70 |
| Monthly Housing Costs | $829 | $34 |
| Real Estate Taxes | $4,947 | $16 |
Property Value by Mortgage Status in Lake Catherine
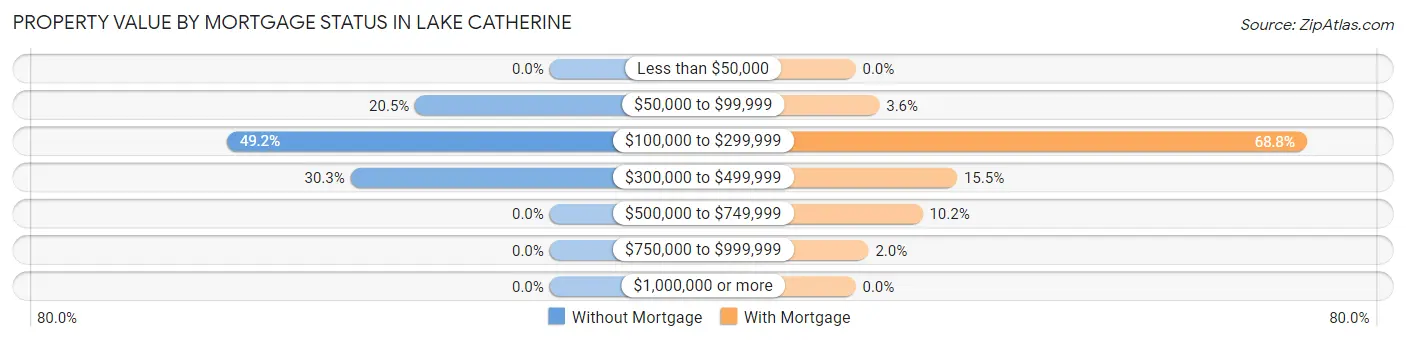
| Property Value | Without Mortgage | With Mortgage |
| Less than $50,000 | 0 (0.0%) | 0 (0.0%) |
| $50,000 to $99,999 | 25 (20.5%) | 11 (3.6%) |
| $100,000 to $299,999 | 60 (49.2%) | 209 (68.8%) |
| $300,000 to $499,999 | 37 (30.3%) | 47 (15.5%) |
| $500,000 to $749,999 | 0 (0.0%) | 31 (10.2%) |
| $750,000 to $999,999 | 0 (0.0%) | 6 (2.0%) |
| $1,000,000 or more | 0 (0.0%) | 0 (0.0%) |
| Total | 122 (100.0%) | 304 (100.0%) |
Household Income by Mortgage Status in Lake Catherine
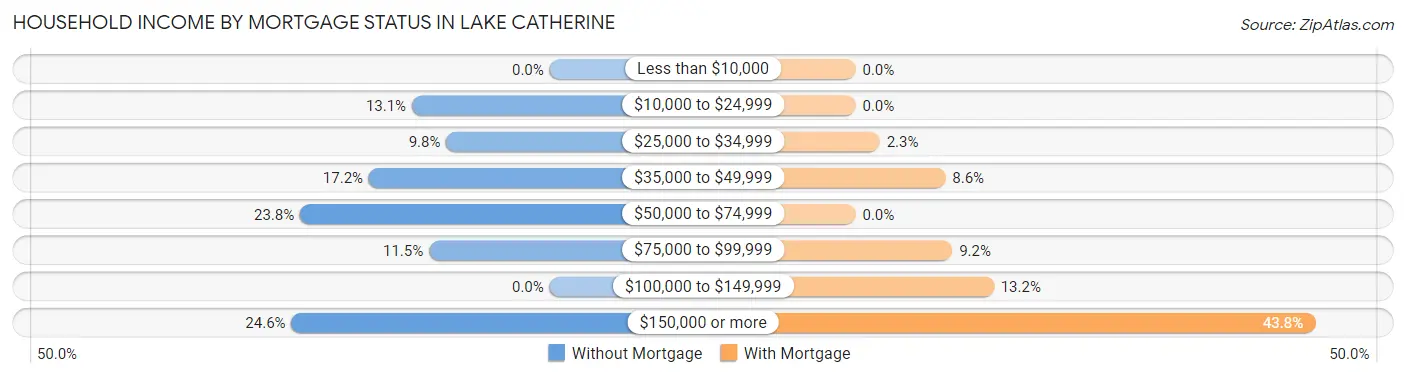
| Household Income | Without Mortgage | With Mortgage |
| Less than $10,000 | 0 (0.0%) | 0 (0.0%) |
| $10,000 to $24,999 | 16 (13.1%) | 0 (0.0%) |
| $25,000 to $34,999 | 12 (9.8%) | 7 (2.3%) |
| $35,000 to $49,999 | 21 (17.2%) | 26 (8.6%) |
| $50,000 to $74,999 | 29 (23.8%) | 0 (0.0%) |
| $75,000 to $99,999 | 14 (11.5%) | 28 (9.2%) |
| $100,000 to $149,999 | 0 (0.0%) | 40 (13.2%) |
| $150,000 or more | 30 (24.6%) | 133 (43.8%) |
| Total | 122 (100.0%) | 304 (100.0%) |
Property Value to Household Income Ratio in Lake Catherine
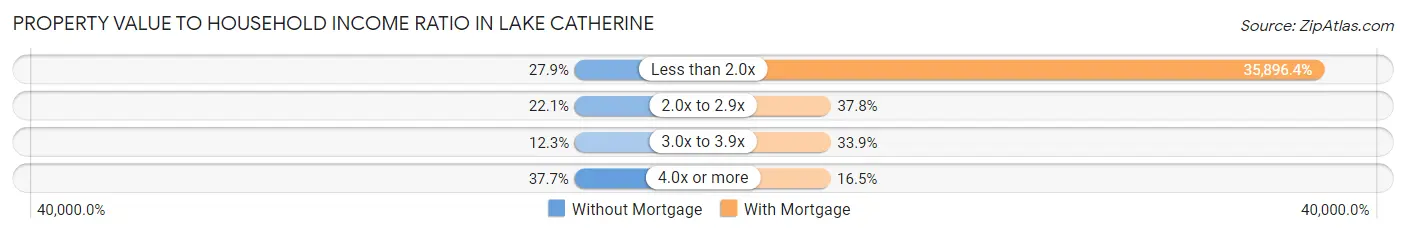
| Value-to-Income Ratio | Without Mortgage | With Mortgage |
| Less than 2.0x | 34 (27.9%) | 109,125 (35,896.4%) |
| 2.0x to 2.9x | 27 (22.1%) | 115 (37.8%) |
| 3.0x to 3.9x | 15 (12.3%) | 103 (33.9%) |
| 4.0x or more | 46 (37.7%) | 50 (16.5%) |
| Total | 122 (100.0%) | 304 (100.0%) |
Real Estate Taxes by Mortgage Status in Lake Catherine
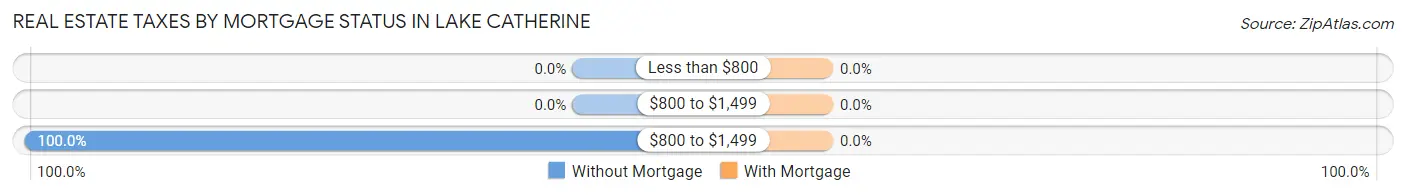
| Property Taxes | Without Mortgage | With Mortgage |
| Less than $800 | 0 (0.0%) | 0 (0.0%) |
| $800 to $1,499 | 0 (0.0%) | 0 (0.0%) |
| $800 to $1,499 | 122 (100.0%) | 0 (0.0%) |
| Total | 122 (100.0%) | 304 (100.0%) |
Health & Disability in Lake Catherine
Health Insurance Coverage by Age in Lake Catherine
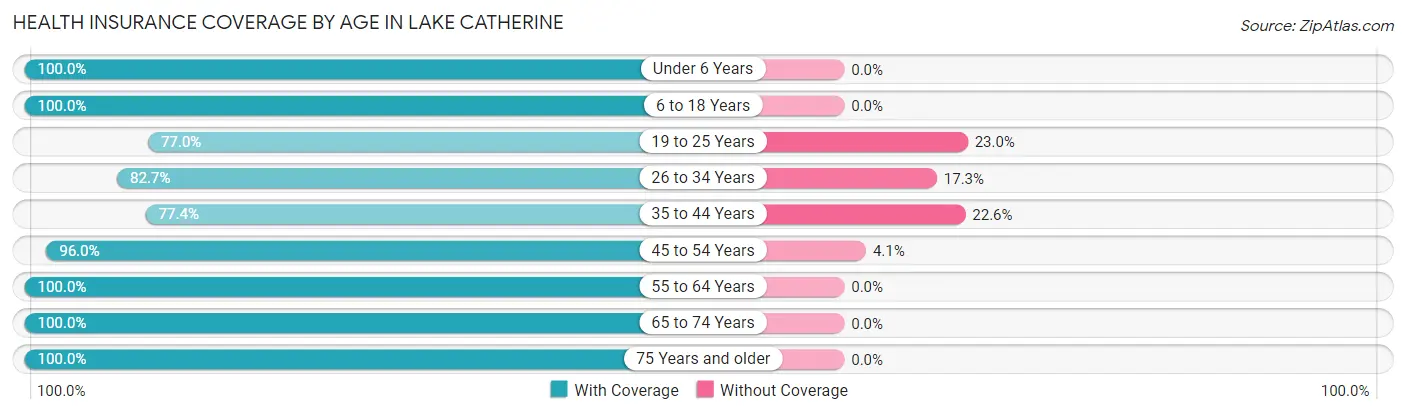
| Age Bracket | With Coverage | Without Coverage |
| Under 6 Years | 33 (100.0%) | 0 (0.0%) |
| 6 to 18 Years | 153 (100.0%) | 0 (0.0%) |
| 19 to 25 Years | 87 (77.0%) | 26 (23.0%) |
| 26 to 34 Years | 139 (82.7%) | 29 (17.3%) |
| 35 to 44 Years | 96 (77.4%) | 28 (22.6%) |
| 45 to 54 Years | 142 (96.0%) | 6 (4.1%) |
| 55 to 64 Years | 312 (100.0%) | 0 (0.0%) |
| 65 to 74 Years | 130 (100.0%) | 0 (0.0%) |
| 75 Years and older | 130 (100.0%) | 0 (0.0%) |
| Total | 1,222 (93.2%) | 89 (6.8%) |
Health Insurance Coverage by Citizenship Status in Lake Catherine
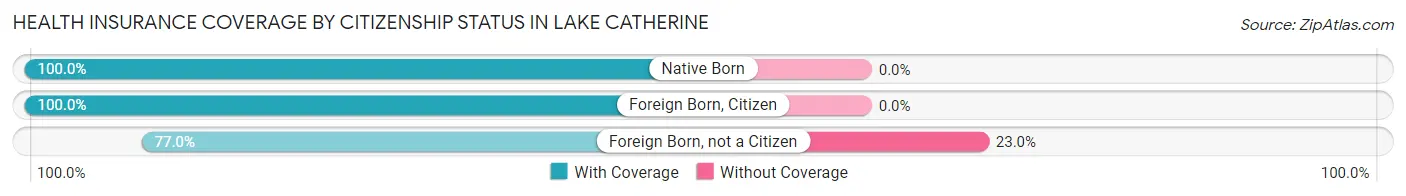
| Citizenship Status | With Coverage | Without Coverage |
| Native Born | 33 (100.0%) | 0 (0.0%) |
| Foreign Born, Citizen | 153 (100.0%) | 0 (0.0%) |
| Foreign Born, not a Citizen | 87 (77.0%) | 26 (23.0%) |
Health Insurance Coverage by Household Income in Lake Catherine
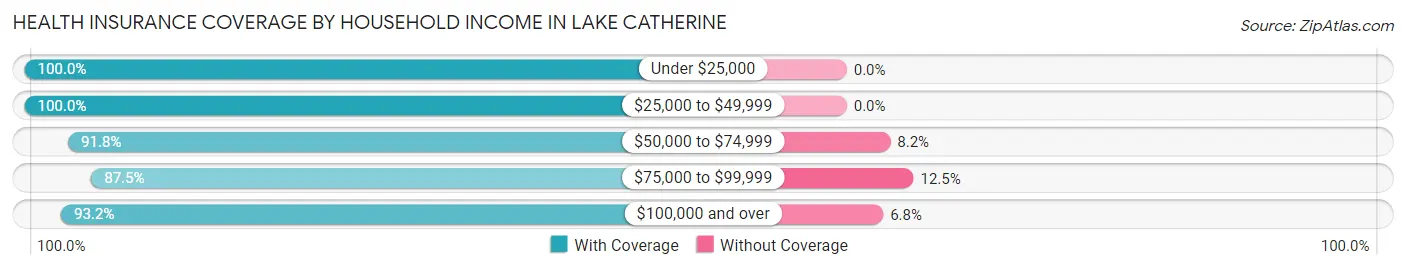
| Household Income | With Coverage | Without Coverage |
| Under $25,000 | 96 (100.0%) | 0 (0.0%) |
| $25,000 to $49,999 | 83 (100.0%) | 0 (0.0%) |
| $50,000 to $74,999 | 135 (91.8%) | 12 (8.2%) |
| $75,000 to $99,999 | 154 (87.5%) | 22 (12.5%) |
| $100,000 and over | 750 (93.2%) | 55 (6.8%) |
Public vs Private Health Insurance Coverage by Age in Lake Catherine
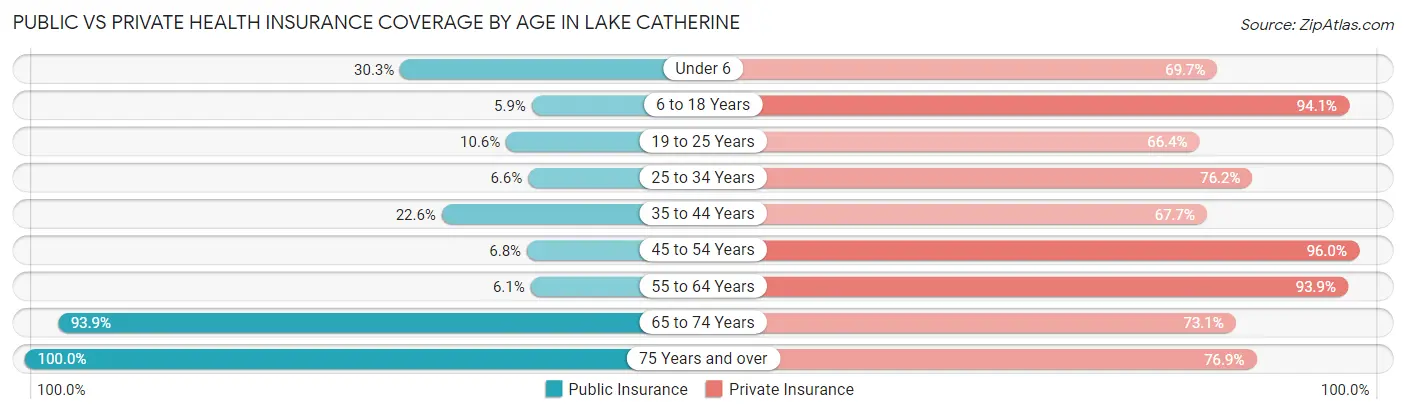
| Age Bracket | Public Insurance | Private Insurance |
| Under 6 | 10 (30.3%) | 23 (69.7%) |
| 6 to 18 Years | 9 (5.9%) | 144 (94.1%) |
| 19 to 25 Years | 12 (10.6%) | 75 (66.4%) |
| 25 to 34 Years | 11 (6.6%) | 128 (76.2%) |
| 35 to 44 Years | 28 (22.6%) | 84 (67.7%) |
| 45 to 54 Years | 10 (6.8%) | 142 (96.0%) |
| 55 to 64 Years | 19 (6.1%) | 293 (93.9%) |
| 65 to 74 Years | 122 (93.9%) | 95 (73.1%) |
| 75 Years and over | 130 (100.0%) | 100 (76.9%) |
| Total | 351 (26.8%) | 1,084 (82.7%) |
Disability Status by Sex by Age in Lake Catherine
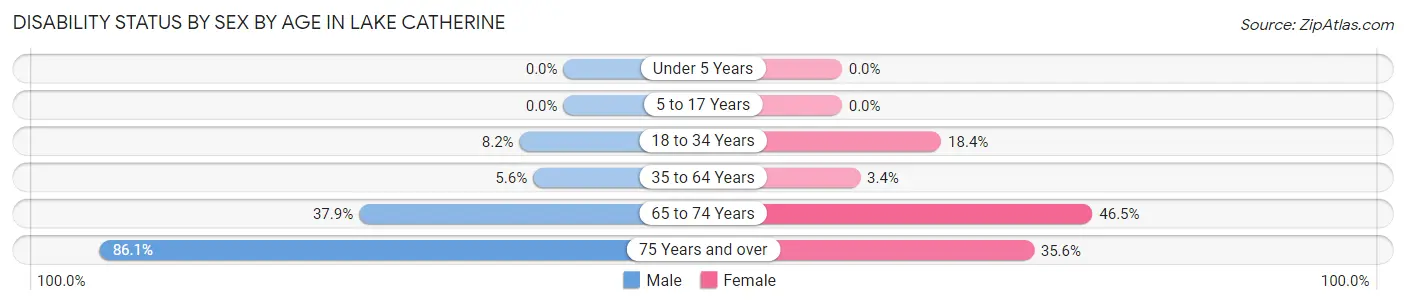
| Age Bracket | Male | Female |
| Under 5 Years | 0 (0.0%) | 0 (0.0%) |
| 5 to 17 Years | 0 (0.0%) | 0 (0.0%) |
| 18 to 34 Years | 11 (8.2%) | 33 (18.4%) |
| 35 to 64 Years | 18 (5.6%) | 9 (3.4%) |
| 65 to 74 Years | 33 (37.9%) | 20 (46.5%) |
| 75 Years and over | 37 (86.1%) | 31 (35.6%) |
Disability Class by Sex by Age in Lake Catherine
Disability Class: Hearing Difficulty
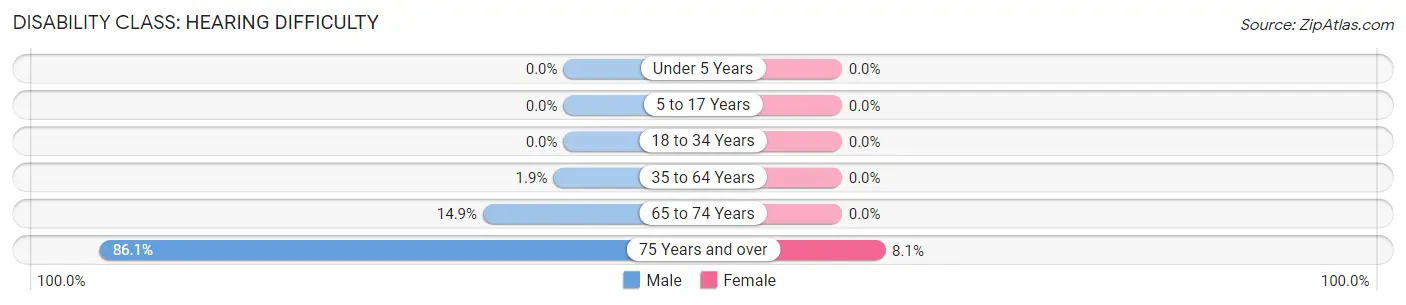
| Age Bracket | Male | Female |
| Under 5 Years | 0 (0.0%) | 0 (0.0%) |
| 5 to 17 Years | 0 (0.0%) | 0 (0.0%) |
| 18 to 34 Years | 0 (0.0%) | 0 (0.0%) |
| 35 to 64 Years | 6 (1.9%) | 0 (0.0%) |
| 65 to 74 Years | 13 (14.9%) | 0 (0.0%) |
| 75 Years and over | 37 (86.1%) | 7 (8.1%) |
Disability Class: Vision Difficulty
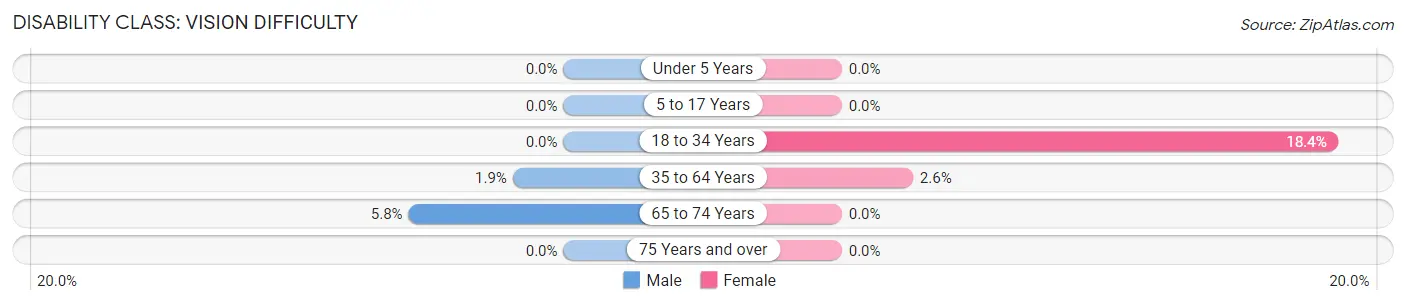
| Age Bracket | Male | Female |
| Under 5 Years | 0 (0.0%) | 0 (0.0%) |
| 5 to 17 Years | 0 (0.0%) | 0 (0.0%) |
| 18 to 34 Years | 0 (0.0%) | 33 (18.4%) |
| 35 to 64 Years | 6 (1.9%) | 7 (2.6%) |
| 65 to 74 Years | 5 (5.8%) | 0 (0.0%) |
| 75 Years and over | 0 (0.0%) | 0 (0.0%) |
Disability Class: Cognitive Difficulty
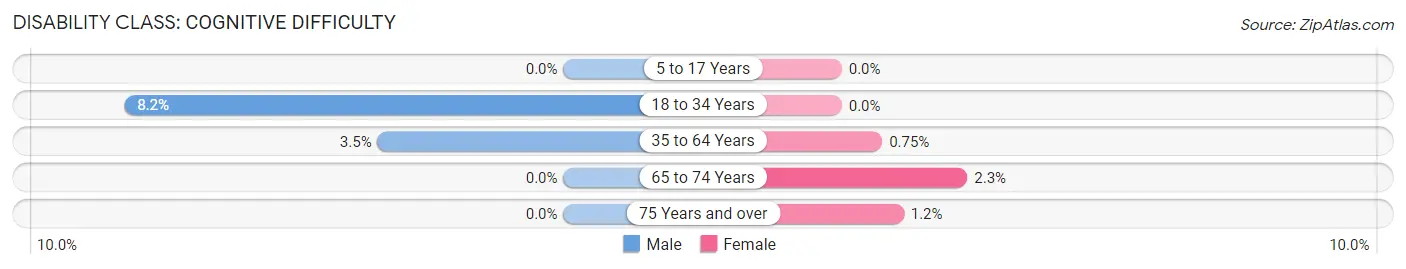
| Age Bracket | Male | Female |
| 5 to 17 Years | 0 (0.0%) | 0 (0.0%) |
| 18 to 34 Years | 11 (8.2%) | 0 (0.0%) |
| 35 to 64 Years | 11 (3.5%) | 2 (0.7%) |
| 65 to 74 Years | 0 (0.0%) | 1 (2.3%) |
| 75 Years and over | 0 (0.0%) | 1 (1.1%) |
Disability Class: Ambulatory Difficulty
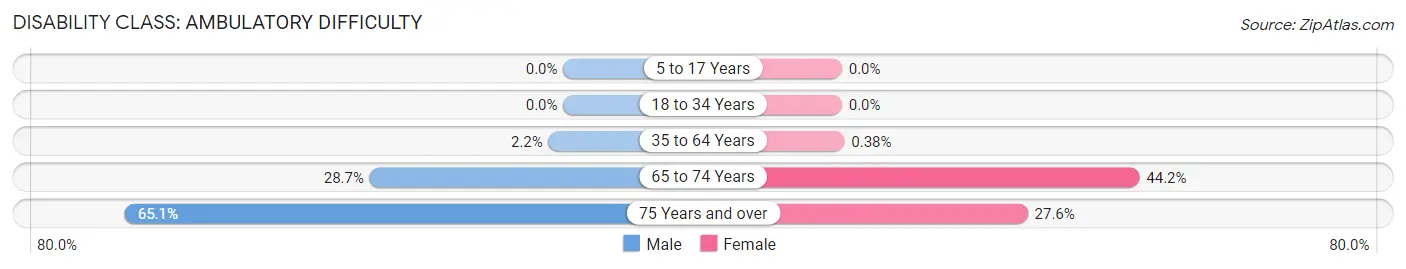
| Age Bracket | Male | Female |
| 5 to 17 Years | 0 (0.0%) | 0 (0.0%) |
| 18 to 34 Years | 0 (0.0%) | 0 (0.0%) |
| 35 to 64 Years | 7 (2.2%) | 1 (0.4%) |
| 65 to 74 Years | 25 (28.7%) | 19 (44.2%) |
| 75 Years and over | 28 (65.1%) | 24 (27.6%) |
Disability Class: Self-Care Difficulty
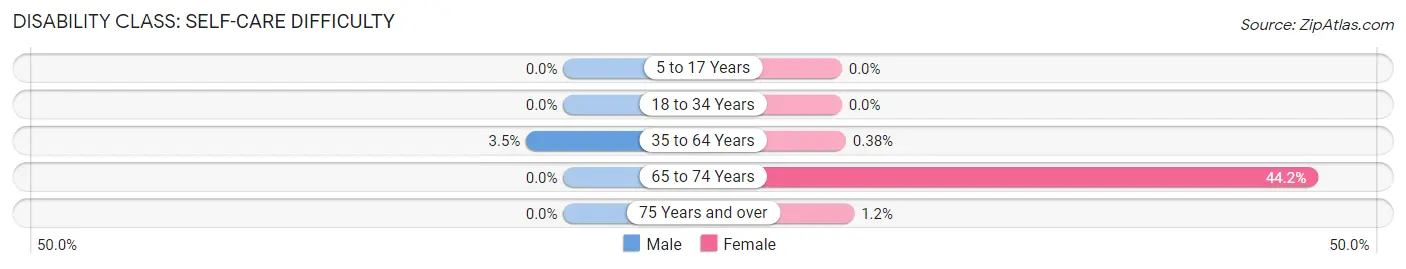
| Age Bracket | Male | Female |
| 5 to 17 Years | 0 (0.0%) | 0 (0.0%) |
| 18 to 34 Years | 0 (0.0%) | 0 (0.0%) |
| 35 to 64 Years | 11 (3.5%) | 1 (0.4%) |
| 65 to 74 Years | 0 (0.0%) | 19 (44.2%) |
| 75 Years and over | 0 (0.0%) | 1 (1.1%) |
Technology Access in Lake Catherine
Computing Device Access in Lake Catherine
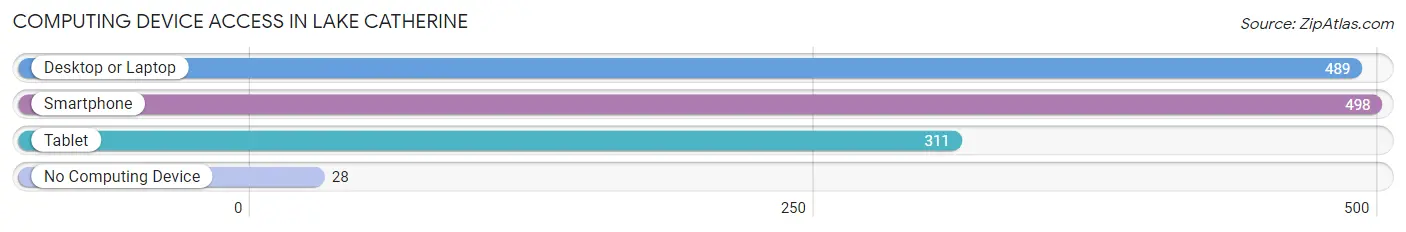
| Device Type | # Households | % Households |
| Desktop or Laptop | 489 | 83.5% |
| Smartphone | 498 | 85.0% |
| Tablet | 311 | 53.1% |
| No Computing Device | 28 | 4.8% |
| Total | 586 | 100.0% |
Internet Access in Lake Catherine
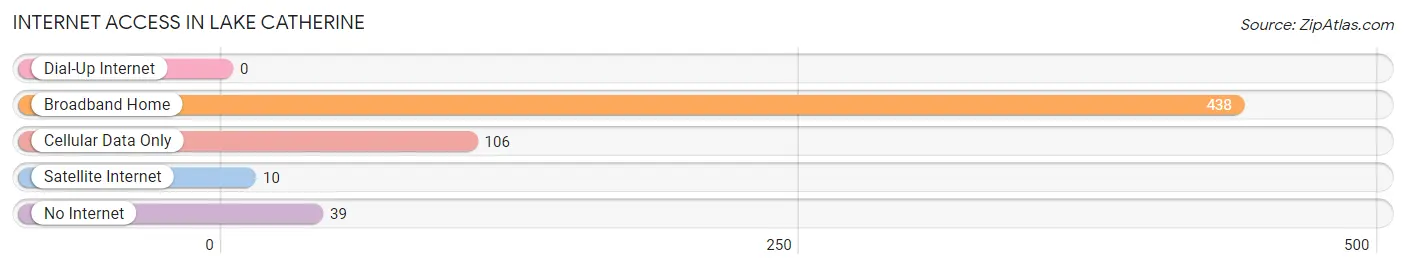
| Internet Type | # Households | % Households |
| Dial-Up Internet | 0 | 0.0% |
| Broadband Home | 438 | 74.7% |
| Cellular Data Only | 106 | 18.1% |
| Satellite Internet | 10 | 1.7% |
| No Internet | 39 | 6.7% |
| Total | 586 | 100.0% |
Lake Catherine Summary
Catherine, Illinois is a small village located in Madison County, Illinois. It is situated on the banks of Lake Catherine, a small lake that is part of the larger Chain O' Lakes system. The village has a population of just over 500 people and is located about 25 miles northeast of St. Louis, Missouri.
History
The area around Lake Catherine has been inhabited for thousands of years. The first recorded inhabitants of the area were the Illiniwek, a Native American tribe that lived in the area until the late 1700s. The first European settlers arrived in the area in the early 1800s and the village of Lake Catherine was officially founded in 1837. The village was named after Catherine, the daughter of one of the first settlers.
In the late 1800s, the village began to grow and prosper. The economy was largely based on agriculture and the village was home to several small businesses. In the early 1900s, the village was connected to the larger cities of St. Louis and Chicago by railroads. This allowed for the growth of the village and the population began to increase.
Geography
Lake Catherine is located in Madison County, Illinois. It is situated on the banks of Lake Catherine, a small lake that is part of the larger Chain O' Lakes system. The village is located about 25 miles northeast of St. Louis, Missouri. The village is surrounded by rolling hills and farmland. The climate in the area is generally mild with hot summers and cold winters.
Economy
The economy of Lake Catherine is largely based on agriculture. The village is home to several small businesses, including a grocery store, a hardware store, and a few restaurants. The village also has a small marina on the lake, which provides access to the larger Chain O' Lakes system.
Demographics
As of the 2010 census, the population of Lake Catherine was 514. The racial makeup of the village was 97.3% White, 0.6% African American, 0.2% Native American, 0.4% Asian, and 1.5% from other races. The median household income was $45,000 and the median family income was $50,000. The per capita income was $20,000.
Conclusion
Lake Catherine, Illinois is a small village located in Madison County, Illinois. It is situated on the banks of Lake Catherine, a small lake that is part of the larger Chain O' Lakes system. The village has a population of just over 500 people and is located about 25 miles northeast of St. Louis, Missouri. The economy of the village is largely based on agriculture and the village is home to several small businesses. The racial makeup of the village is 97.3% White, 0.6% African American, 0.2% Native American, 0.4% Asian, and 1.5% from other races. The median household income was $45,000 and the median family income was $50,000.
Common Questions
What is the Total Population of Lake Catherine?
Total Population of Lake Catherine is 1,311.
What is the Total Male Population of Lake Catherine?
Total Male Population of Lake Catherine is 643.
What is the Total Female Population of Lake Catherine?
Total Female Population of Lake Catherine is 668.
What is the Ratio of Males per 100 Females in Lake Catherine?
There are 96.26 Males per 100 Females in Lake Catherine.
What is the Ratio of Females per 100 Males in Lake Catherine?
There are 103.89 Females per 100 Males in Lake Catherine.
What is the Median Population Age in Lake Catherine?
Median Population Age in Lake Catherine is 49.5 Years.
What is the Average Family Size in Lake Catherine
Average Family Size in Lake Catherine is 3.0 People.
What is the Average Household Size in Lake Catherine
Average Household Size in Lake Catherine is 2.2 People.
What is Per Capita Income in Lake Catherine?
Per Capita income in Lake Catherine is $50,649.
What is the Median Family Income in Lake Catherine?
Median Family Income in Lake Catherine is $107,287.
What is the Median Household income in Lake Catherine?
Median Household Income in Lake Catherine is $91,667.
What is Income or Wage Gap in Lake Catherine?
Income or Wage Gap in Lake Catherine is 61.4%.
Women in Lake Catherine earn 38.6 cents for every dollar earned by a man.
What is Inequality or Gini Index in Lake Catherine?
Inequality or Gini Index in Lake Catherine is 0.43.
How Large is the Labor Force in Lake Catherine?
There are 771 People in the Labor Forcein in Lake Catherine.
What is the Percentage of People in the Labor Force in Lake Catherine?
64.6% of People are in the Labor Force in Lake Catherine.
What is the Unemployment Rate in Lake Catherine?
Unemployment Rate in Lake Catherine is 10.0%.