Cities with the Highest Percentage of Population with a Degree in Visual and Performing Arts in Texas
RELATED REPORTS & OPTIONS
Visual and Performing Arts
Texas
Compare Cities
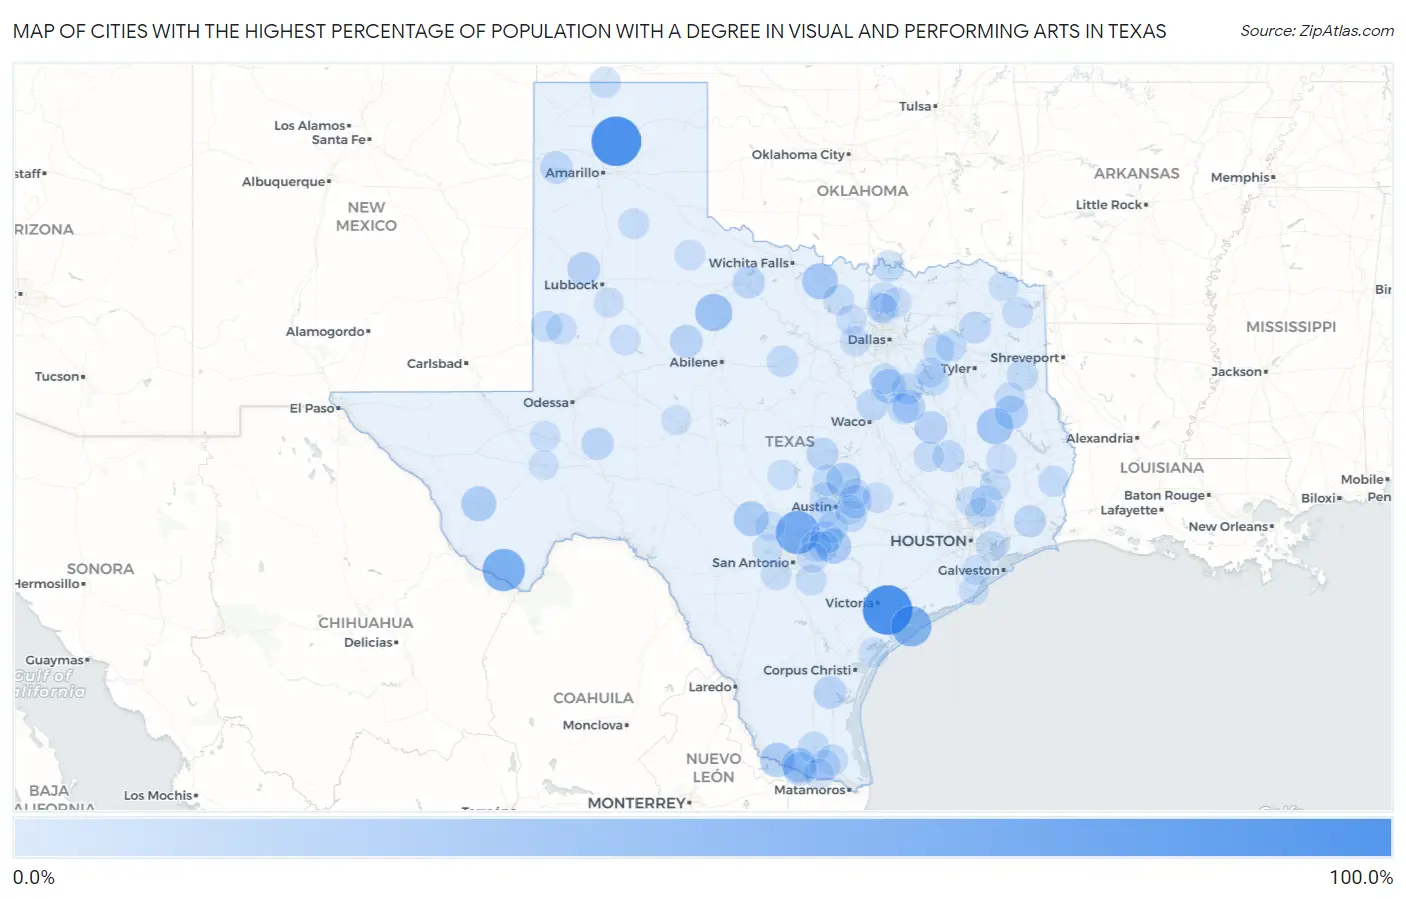
Map of Cities with the Highest Percentage of Population with a Degree in Visual and Performing Arts in Texas
0.0%
100.0%
Cities with the Highest Percentage of Population with a Degree in Visual and Performing Arts in Texas
| City | % Graduates | vs State | vs National | |
| 1. | Placedo | 100.0% | 3.2%(+96.8)#1 | 4.3%(+95.7)#3 |
| 2. | Sheridan | 100.0% | 3.2%(+96.8)#2 | 4.3%(+95.7)#20 |
| 3. | Lake Meredith Estates | 100.0% | 3.2%(+96.8)#3 | 4.3%(+95.7)#27 |
| 4. | Spring Branch | 70.3% | 3.2%(+67.1)#4 | 4.3%(+66.1)#62 |
| 5. | Terlingua | 65.6% | 3.2%(+62.4)#5 | 4.3%(+61.4)#67 |
| 6. | Port O Connor | 56.8% | 3.2%(+53.6)#6 | 4.3%(+52.6)#91 |
| 7. | Ben Arnold | 53.8% | 3.2%(+50.6)#7 | 4.3%(+49.6)#98 |
| 8. | Rule | 41.3% | 3.2%(+38.1)#8 | 4.3%(+37.1)#168 |
| 9. | Wells | 37.5% | 3.2%(+34.3)#9 | 4.3%(+33.2)#196 |
| 10. | Bellevue | 36.0% | 3.2%(+32.8)#10 | 4.3%(+31.7)#215 |
| 11. | Marfa | 31.2% | 3.2%(+28.0)#11 | 4.3%(+26.9)#295 |
| 12. | Kingsbury | 31.1% | 3.2%(+27.9)#12 | 4.3%(+26.9)#296 |
| 13. | Garza Salinas Ii | 30.4% | 3.2%(+27.2)#13 | 4.3%(+26.2)#304 |
| 14. | Ingram | 30.1% | 3.2%(+26.9)#14 | 4.3%(+25.8)#310 |
| 15. | Weir | 29.3% | 3.2%(+26.1)#15 | 4.3%(+25.0)#323 |
| 16. | Bluff Dale | 29.3% | 3.2%(+26.1)#16 | 4.3%(+25.0)#324 |
| 17. | Doffing | 28.2% | 3.2%(+25.0)#17 | 4.3%(+24.0)#350 |
| 18. | Frost | 27.6% | 3.2%(+24.4)#18 | 4.3%(+23.3)#364 |
| 19. | Palmview South | 26.7% | 3.2%(+23.5)#19 | 4.3%(+22.5)#382 |
| 20. | Redfield | 25.0% | 3.2%(+21.8)#20 | 4.3%(+20.7)#426 |
| 21. | Anton | 22.4% | 3.2%(+19.2)#21 | 4.3%(+18.1)#506 |
| 22. | Elgin | 22.4% | 3.2%(+19.1)#22 | 4.3%(+18.1)#507 |
| 23. | Roby | 21.8% | 3.2%(+18.6)#23 | 4.3%(+17.6)#533 |
| 24. | Buffalo | 21.4% | 3.2%(+18.2)#24 | 4.3%(+17.2)#551 |
| 25. | Ricardo | 21.3% | 3.2%(+18.1)#25 | 4.3%(+17.0)#558 |
| 26. | Wortham | 21.2% | 3.2%(+18.0)#26 | 4.3%(+17.0)#561 |
| 27. | Redwood | 20.3% | 3.2%(+17.1)#27 | 4.3%(+16.1)#609 |
| 28. | Adrian | 20.0% | 3.2%(+16.8)#28 | 4.3%(+15.7)#634 |
| 29. | Kempner | 19.5% | 3.2%(+16.3)#29 | 4.3%(+15.3)#666 |
| 30. | Seymour | 19.5% | 3.2%(+16.3)#30 | 4.3%(+15.2)#672 |
| 31. | Rankin | 19.2% | 3.2%(+16.0)#31 | 4.3%(+14.9)#692 |
| 32. | China | 18.5% | 3.2%(+15.3)#32 | 4.3%(+14.3)#742 |
| 33. | Santo | 18.3% | 3.2%(+15.1)#33 | 4.3%(+14.0)#757 |
| 34. | Plum | 17.4% | 3.2%(+14.2)#34 | 4.3%(+13.1)#820 |
| 35. | Winnsboro | 17.4% | 3.2%(+14.2)#35 | 4.3%(+13.1)#824 |
| 36. | West | 17.1% | 3.2%(+13.9)#36 | 4.3%(+12.9)#841 |
| 37. | Retreat | 17.0% | 3.2%(+13.8)#37 | 4.3%(+12.8)#846 |
| 38. | Midway | 17.0% | 3.2%(+13.8)#38 | 4.3%(+12.7)#850 |
| 39. | North Cleveland | 16.7% | 3.2%(+13.5)#39 | 4.3%(+12.4)#894 |
| 40. | Linn | 16.3% | 3.2%(+13.1)#40 | 4.3%(+12.0)#931 |
| 41. | Tehuacana | 16.1% | 3.2%(+12.9)#41 | 4.3%(+11.8)#948 |
| 42. | Ranger | 16.0% | 3.2%(+12.8)#42 | 4.3%(+11.7)#951 |
| 43. | Beckville | 15.8% | 3.2%(+12.6)#43 | 4.3%(+11.5)#969 |
| 44. | Myrtle Springs | 15.8% | 3.2%(+12.6)#44 | 4.3%(+11.5)#970 |
| 45. | Sherwood Shores | 15.6% | 3.2%(+12.4)#45 | 4.3%(+11.3)#1,001 |
| 46. | Wyldwood | 15.3% | 3.2%(+12.1)#46 | 4.3%(+11.0)#1,040 |
| 47. | Uhland | 15.0% | 3.2%(+11.8)#47 | 4.3%(+10.7)#1,068 |
| 48. | Kirbyville | 14.6% | 3.2%(+11.4)#48 | 4.3%(+10.4)#1,103 |
| 49. | Denver City | 14.6% | 3.2%(+11.4)#49 | 4.3%(+10.3)#1,113 |
| 50. | Grand Saline | 14.6% | 3.2%(+11.3)#50 | 4.3%(+10.3)#1,114 |
| 51. | Liberty Hill | 14.3% | 3.2%(+11.1)#51 | 4.3%(+10.1)#1,139 |
| 52. | Hudson Bend | 14.3% | 3.2%(+11.1)#52 | 4.3%(+10.1)#1,140 |
| 53. | Sebastian | 14.3% | 3.2%(+11.1)#53 | 4.3%(+10.0)#1,143 |
| 54. | Texhoma | 14.3% | 3.2%(+11.1)#54 | 4.3%(+10.0)#1,151 |
| 55. | Malakoff | 13.6% | 3.2%(+10.4)#55 | 4.3%(+9.36)#1,249 |
| 56. | Morgan S Point | 13.5% | 3.2%(+10.3)#56 | 4.3%(+9.26)#1,265 |
| 57. | Pilot Point | 13.3% | 3.2%(+10.1)#57 | 4.3%(+9.09)#1,286 |
| 58. | Mount Enterprise | 13.3% | 3.2%(+10.1)#58 | 4.3%(+9.08)#1,296 |
| 59. | Marietta | 13.3% | 3.2%(+10.1)#59 | 4.3%(+9.08)#1,305 |
| 60. | Alvord | 13.2% | 3.2%(+10.00)#60 | 4.3%(+8.96)#1,320 |
| 61. | Ben Wheeler | 13.1% | 3.2%(+9.92)#61 | 4.3%(+8.88)#1,331 |
| 62. | Seagraves | 13.1% | 3.2%(+9.89)#62 | 4.3%(+8.84)#1,336 |
| 63. | Laguna Seca | 12.9% | 3.2%(+9.69)#63 | 4.3%(+8.65)#1,359 |
| 64. | Silverton | 12.8% | 3.2%(+9.61)#64 | 4.3%(+8.57)#1,371 |
| 65. | Floresville | 12.5% | 3.2%(+9.31)#65 | 4.3%(+8.27)#1,408 |
| 66. | Goodrich | 12.5% | 3.2%(+9.29)#66 | 4.3%(+8.25)#1,421 |
| 67. | Woodbranch | 12.4% | 3.2%(+9.18)#67 | 4.3%(+8.14)#1,444 |
| 68. | Lake Dunlap | 12.3% | 3.2%(+9.05)#68 | 4.3%(+8.01)#1,464 |
| 69. | Coupland | 12.2% | 3.2%(+9.04)#69 | 4.3%(+7.99)#1,468 |
| 70. | Italy | 12.1% | 3.2%(+8.91)#70 | 4.3%(+7.87)#1,499 |
| 71. | Normangee | 12.1% | 3.2%(+8.91)#71 | 4.3%(+7.87)#1,500 |
| 72. | Payne Springs | 12.1% | 3.2%(+8.91)#72 | 4.3%(+7.87)#1,501 |
| 73. | Geronimo | 12.1% | 3.2%(+8.86)#73 | 4.3%(+7.82)#1,511 |
| 74. | Lytle | 12.0% | 3.2%(+8.74)#74 | 4.3%(+7.70)#1,530 |
| 75. | Rhome | 11.9% | 3.2%(+8.68)#75 | 4.3%(+7.64)#1,546 |
| 76. | Grandfalls | 11.8% | 3.2%(+8.56)#76 | 4.3%(+7.51)#1,577 |
| 77. | Paducah | 11.7% | 3.2%(+8.49)#77 | 4.3%(+7.44)#1,590 |
| 78. | Lexington | 11.3% | 3.2%(+8.06)#78 | 4.3%(+7.02)#1,661 |
| 79. | Westover Hills | 11.2% | 3.2%(+8.02)#79 | 4.3%(+6.97)#1,669 |
| 80. | Corrigan | 11.1% | 3.2%(+7.90)#80 | 4.3%(+6.86)#1,690 |
| 81. | Zuehl | 10.9% | 3.2%(+7.66)#81 | 4.3%(+6.62)#1,784 |
| 82. | Weston | 10.9% | 3.2%(+7.66)#82 | 4.3%(+6.62)#1,786 |
| 83. | Gail | 10.8% | 3.2%(+7.60)#83 | 4.3%(+6.56)#1,801 |
| 84. | Wilson | 10.7% | 3.2%(+7.50)#84 | 4.3%(+6.46)#1,827 |
| 85. | Little Cypress | 10.7% | 3.2%(+7.48)#85 | 4.3%(+6.44)#1,841 |
| 86. | Bear Creek | 10.7% | 3.2%(+7.48)#86 | 4.3%(+6.43)#1,843 |
| 87. | Lakehills | 10.7% | 3.2%(+7.45)#87 | 4.3%(+6.41)#1,850 |
| 88. | Scissors | 10.6% | 3.2%(+7.43)#88 | 4.3%(+6.39)#1,854 |
| 89. | Llano | 10.6% | 3.2%(+7.41)#89 | 4.3%(+6.37)#1,864 |
| 90. | Avery | 10.6% | 3.2%(+7.39)#90 | 4.3%(+6.34)#1,873 |
| 91. | Cut And Shoot | 10.5% | 3.2%(+7.32)#91 | 4.3%(+6.27)#1,886 |
| 92. | Providence Village | 10.4% | 3.2%(+7.17)#92 | 4.3%(+6.12)#1,938 |
| 93. | Rockport | 10.4% | 3.2%(+7.15)#93 | 4.3%(+6.10)#1,944 |
| 94. | Comfort | 10.3% | 3.2%(+7.08)#94 | 4.3%(+6.04)#1,960 |
| 95. | Fort Stockton | 10.2% | 3.2%(+6.96)#95 | 4.3%(+5.92)#2,006 |
| 96. | Oyster Creek | 10.0% | 3.2%(+6.79)#96 | 4.3%(+5.75)#2,053 |
| 97. | Savannah | 10.0% | 3.2%(+6.76)#97 | 4.3%(+5.72)#2,085 |
| 98. | Webberville | 9.9% | 3.2%(+6.74)#98 | 4.3%(+5.70)#2,091 |
| 99. | Grape Creek | 9.8% | 3.2%(+6.64)#99 | 4.3%(+5.60)#2,121 |
| 100. | Liverpool | 9.7% | 3.2%(+6.47)#100 | 4.3%(+5.43)#2,183 |
Common Questions
What are the Top 10 Cities with the Highest Percentage of Population with a Degree in Visual and Performing Arts in Texas?
Top 10 Cities with the Highest Percentage of Population with a Degree in Visual and Performing Arts in Texas are:
#1
100.0%
#2
100.0%
#3
70.3%
#4
65.6%
#5
56.8%
#6
41.3%
#7
37.5%
#8
36.0%
#9
31.2%
#10
31.1%
What city has the Highest Percentage of Population with a Degree in Visual and Performing Arts in Texas?
Placedo has the Highest Percentage of Population with a Degree in Visual and Performing Arts in Texas with 100.0%.
What is the Percentage of Population with a Degree in Visual and Performing Arts in the State of Texas?
Percentage of Population with a Degree in Visual and Performing Arts in Texas is 3.2%.
What is the Percentage of Population with a Degree in Visual and Performing Arts in the United States?
Percentage of Population with a Degree in Visual and Performing Arts in the United States is 4.3%.