Cities with the Highest Percentage of Peruvian Population in Texas
RELATED REPORTS & OPTIONS
Peruvian
Texas
Compare Cities
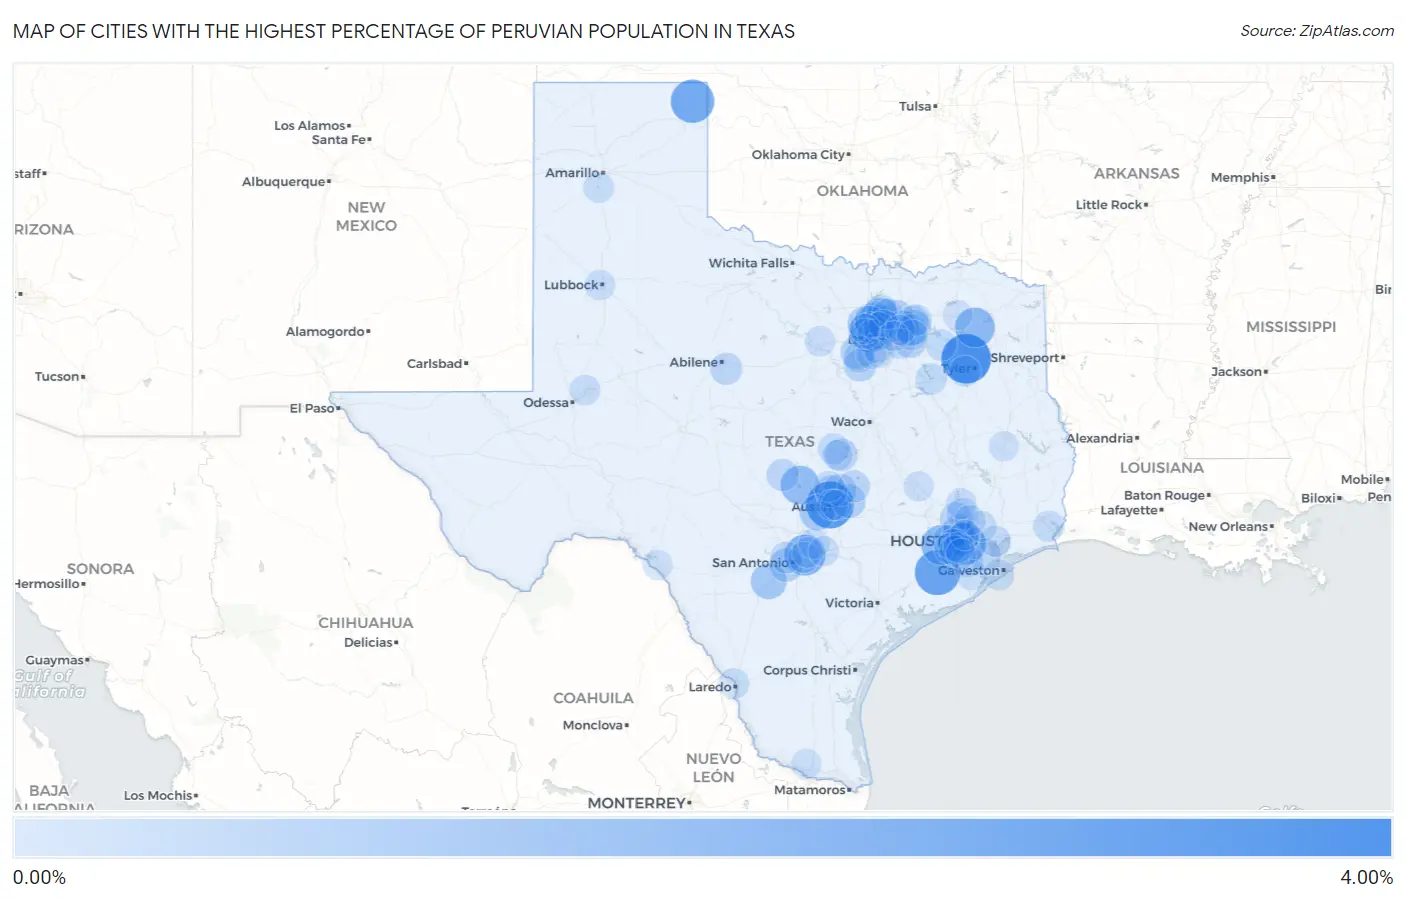
Map of Cities with the Highest Percentage of Peruvian Population in Texas
0.00%
4.00%
Cities with the Highest Percentage of Peruvian Population in Texas
| City | Peruvian | vs State | vs National | |
| 1. | Hideaway | 3.42% | 0.13%(+3.30)#1 | 0.22%(+3.21)#120 |
| 2. | Lost Creek | 3.02% | 0.13%(+2.89)#2 | 0.22%(+2.80)#151 |
| 3. | Boling | 2.68% | 0.13%(+2.56)#3 | 0.22%(+2.47)#189 |
| 4. | Lipscomb | 2.38% | 0.13%(+2.26)#4 | 0.22%(+2.17)#233 |
| 5. | Colleyville | 2.09% | 0.13%(+1.97)#5 | 0.22%(+1.88)#281 |
| 6. | Bellaire | 2.05% | 0.13%(+1.92)#6 | 0.22%(+1.83)#290 |
| 7. | Randolph Afb | 1.92% | 0.13%(+1.80)#7 | 0.22%(+1.71)#319 |
| 8. | Fulshear | 1.77% | 0.13%(+1.65)#8 | 0.22%(+1.56)#363 |
| 9. | Winnsboro | 1.75% | 0.13%(+1.62)#9 | 0.22%(+1.53)#371 |
| 10. | Granite Shoals | 1.57% | 0.13%(+1.44)#10 | 0.22%(+1.35)#417 |
| 11. | Devine | 1.10% | 0.13%(+0.971)#11 | 0.22%(+0.882)#628 |
| 12. | Dripping Springs | 1.09% | 0.13%(+0.966)#12 | 0.22%(+0.877)#635 |
| 13. | Roanoke | 0.94% | 0.13%(+0.815)#13 | 0.22%(+0.726)#743 |
| 14. | Lakewood Village | 0.94% | 0.13%(+0.811)#14 | 0.22%(+0.722)#745 |
| 15. | Fate | 0.87% | 0.13%(+0.742)#15 | 0.22%(+0.653)#795 |
| 16. | Manor | 0.76% | 0.13%(+0.630)#16 | 0.22%(+0.541)#899 |
| 17. | Crowley | 0.76% | 0.13%(+0.630)#17 | 0.22%(+0.540)#901 |
| 18. | Lackland Afb | 0.69% | 0.13%(+0.567)#18 | 0.22%(+0.477)#969 |
| 19. | Double Oak | 0.69% | 0.13%(+0.565)#19 | 0.22%(+0.476)#972 |
| 20. | Forney | 0.65% | 0.13%(+0.527)#20 | 0.22%(+0.438)#1,018 |
| 21. | Allen | 0.65% | 0.13%(+0.523)#21 | 0.22%(+0.433)#1,026 |
| 22. | Bunker Hill Village | 0.63% | 0.13%(+0.502)#22 | 0.22%(+0.413)#1,055 |
| 23. | Keene | 0.62% | 0.13%(+0.494)#23 | 0.22%(+0.405)#1,065 |
| 24. | Jersey Village | 0.62% | 0.13%(+0.492)#24 | 0.22%(+0.403)#1,067 |
| 25. | Lewisville | 0.61% | 0.13%(+0.483)#25 | 0.22%(+0.393)#1,083 |
| 26. | Hedwig Village | 0.60% | 0.13%(+0.478)#26 | 0.22%(+0.388)#1,089 |
| 27. | Tomball | 0.60% | 0.13%(+0.476)#27 | 0.22%(+0.386)#1,094 |
| 28. | Harker Heights | 0.59% | 0.13%(+0.467)#28 | 0.22%(+0.378)#1,109 |
| 29. | Cinco Ranch | 0.58% | 0.13%(+0.452)#29 | 0.22%(+0.363)#1,131 |
| 30. | Round Rock | 0.52% | 0.13%(+0.397)#30 | 0.22%(+0.308)#1,236 |
| 31. | Taylor | 0.50% | 0.13%(+0.373)#31 | 0.22%(+0.283)#1,292 |
| 32. | Cedar Park | 0.49% | 0.13%(+0.364)#32 | 0.22%(+0.275)#1,319 |
| 33. | Rowlett | 0.49% | 0.13%(+0.361)#33 | 0.22%(+0.271)#1,331 |
| 34. | Webster | 0.48% | 0.13%(+0.354)#34 | 0.22%(+0.265)#1,346 |
| 35. | Llano | 0.47% | 0.13%(+0.348)#35 | 0.22%(+0.259)#1,361 |
| 36. | Mission Bend | 0.47% | 0.13%(+0.342)#36 | 0.22%(+0.252)#1,379 |
| 37. | Potosi | 0.47% | 0.13%(+0.342)#37 | 0.22%(+0.252)#1,380 |
| 38. | Addison | 0.44% | 0.13%(+0.315)#38 | 0.22%(+0.225)#1,436 |
| 39. | Nevada | 0.43% | 0.13%(+0.308)#39 | 0.22%(+0.218)#1,451 |
| 40. | Sachse | 0.42% | 0.13%(+0.295)#40 | 0.22%(+0.205)#1,481 |
| 41. | Iowa Colony | 0.41% | 0.13%(+0.285)#41 | 0.22%(+0.195)#1,506 |
| 42. | Leon Valley | 0.41% | 0.13%(+0.283)#42 | 0.22%(+0.194)#1,508 |
| 43. | The Woodlands | 0.40% | 0.13%(+0.271)#43 | 0.22%(+0.182)#1,550 |
| 44. | Star Harbor | 0.39% | 0.13%(+0.268)#44 | 0.22%(+0.178)#1,561 |
| 45. | Highland Village | 0.38% | 0.13%(+0.252)#45 | 0.22%(+0.162)#1,605 |
| 46. | Fort Hood | 0.38% | 0.13%(+0.251)#46 | 0.22%(+0.162)#1,607 |
| 47. | Rockwall | 0.37% | 0.13%(+0.242)#47 | 0.22%(+0.152)#1,625 |
| 48. | Edgewood | 0.35% | 0.13%(+0.222)#48 | 0.22%(+0.133)#1,679 |
| 49. | Irving | 0.35% | 0.13%(+0.220)#49 | 0.22%(+0.131)#1,684 |
| 50. | Pecan Grove | 0.33% | 0.13%(+0.208)#50 | 0.22%(+0.118)#1,729 |
| 51. | Josephine | 0.31% | 0.13%(+0.189)#51 | 0.22%(+0.099)#1,771 |
| 52. | Hackberry | 0.31% | 0.13%(+0.189)#52 | 0.22%(+0.099)#1,772 |
| 53. | Sugar Land | 0.31% | 0.13%(+0.188)#53 | 0.22%(+0.098)#1,775 |
| 54. | Nederland | 0.31% | 0.13%(+0.187)#54 | 0.22%(+0.097)#1,776 |
| 55. | Chandler | 0.30% | 0.13%(+0.176)#55 | 0.22%(+0.087)#1,808 |
| 56. | Belterra | 0.30% | 0.13%(+0.174)#56 | 0.22%(+0.084)#1,818 |
| 57. | Converse | 0.30% | 0.13%(+0.174)#57 | 0.22%(+0.084)#1,819 |
| 58. | Baytown | 0.30% | 0.13%(+0.173)#58 | 0.22%(+0.083)#1,822 |
| 59. | Paloma Creek South | 0.29% | 0.13%(+0.166)#59 | 0.22%(+0.077)#1,852 |
| 60. | Burleson | 0.29% | 0.13%(+0.166)#60 | 0.22%(+0.077)#1,854 |
| 61. | Atascocita | 0.27% | 0.13%(+0.149)#61 | 0.22%(+0.060)#1,920 |
| 62. | Galveston | 0.27% | 0.13%(+0.148)#62 | 0.22%(+0.059)#1,925 |
| 63. | Conroe | 0.27% | 0.13%(+0.147)#63 | 0.22%(+0.057)#1,929 |
| 64. | Canyon | 0.27% | 0.13%(+0.146)#64 | 0.22%(+0.056)#1,936 |
| 65. | Flower Mound | 0.27% | 0.13%(+0.146)#65 | 0.22%(+0.056)#1,939 |
| 66. | Laredo | 0.27% | 0.13%(+0.145)#66 | 0.22%(+0.056)#1,941 |
| 67. | Southlake | 0.25% | 0.13%(+0.124)#67 | 0.22%(+0.035)#2,052 |
| 68. | Leander | 0.25% | 0.13%(+0.124)#68 | 0.22%(+0.034)#2,059 |
| 69. | Grand Prairie | 0.24% | 0.13%(+0.117)#69 | 0.22%(+0.028)#2,090 |
| 70. | West Lake Hills | 0.24% | 0.13%(+0.112)#70 | 0.22%(+0.023)#2,105 |
| 71. | Midland | 0.24% | 0.13%(+0.110)#71 | 0.22%(+0.020)#2,115 |
| 72. | Millsap | 0.23% | 0.13%(+0.106)#72 | 0.22%(+0.017)#2,130 |
| 73. | New Braunfels | 0.23% | 0.13%(+0.101)#73 | 0.22%(+0.012)#2,149 |
| 74. | Lubbock | 0.21% | 0.13%(+0.088)#74 | 0.22%(-0.002)#2,205 |
| 75. | Mclendon Chisholm | 0.21% | 0.13%(+0.087)#75 | 0.22%(-0.002)#2,206 |
| 76. | Euless | 0.21% | 0.13%(+0.086)#76 | 0.22%(-0.003)#2,214 |
| 77. | Meadows Place | 0.21% | 0.13%(+0.086)#77 | 0.22%(-0.003)#2,215 |
| 78. | Coppell | 0.21% | 0.13%(+0.086)#78 | 0.22%(-0.004)#2,216 |
| 79. | Schertz | 0.21% | 0.13%(+0.086)#79 | 0.22%(-0.004)#2,218 |
| 80. | Frisco | 0.21% | 0.13%(+0.085)#80 | 0.22%(-0.004)#2,220 |
| 81. | Carrollton | 0.21% | 0.13%(+0.080)#81 | 0.22%(-0.010)#2,257 |
| 82. | Balch Springs | 0.20% | 0.13%(+0.079)#82 | 0.22%(-0.010)#2,260 |
| 83. | Danbury | 0.20% | 0.13%(+0.079)#83 | 0.22%(-0.010)#2,262 |
| 84. | Mansfield | 0.19% | 0.13%(+0.068)#84 | 0.22%(-0.021)#2,323 |
| 85. | North Richland Hills | 0.19% | 0.13%(+0.065)#85 | 0.22%(-0.024)#2,341 |
| 86. | Killeen | 0.19% | 0.13%(+0.063)#86 | 0.22%(-0.026)#2,350 |
| 87. | Seguin | 0.19% | 0.13%(+0.062)#87 | 0.22%(-0.027)#2,357 |
| 88. | Spring | 0.18% | 0.13%(+0.059)#88 | 0.22%(-0.031)#2,377 |
| 89. | Keller | 0.18% | 0.13%(+0.051)#89 | 0.22%(-0.039)#2,414 |
| 90. | Garland | 0.17% | 0.13%(+0.047)#90 | 0.22%(-0.042)#2,438 |
| 91. | Del Rio | 0.17% | 0.13%(+0.044)#91 | 0.22%(-0.045)#2,454 |
| 92. | Sulphur Springs | 0.17% | 0.13%(+0.043)#92 | 0.22%(-0.047)#2,463 |
| 93. | Mcallen | 0.17% | 0.13%(+0.040)#93 | 0.22%(-0.050)#2,475 |
| 94. | Austin | 0.16% | 0.13%(+0.035)#94 | 0.22%(-0.054)#2,496 |
| 95. | Cedar Hill | 0.16% | 0.13%(+0.030)#95 | 0.22%(-0.059)#2,533 |
| 96. | Houston | 0.16% | 0.13%(+0.030)#96 | 0.22%(-0.060)#2,540 |
| 97. | Dallas | 0.15% | 0.13%(+0.029)#97 | 0.22%(-0.060)#2,546 |
| 98. | Missouri City | 0.15% | 0.13%(+0.028)#98 | 0.22%(-0.061)#2,553 |
| 99. | Diboll | 0.15% | 0.13%(+0.028)#99 | 0.22%(-0.061)#2,557 |
| 100. | College Station | 0.15% | 0.13%(+0.026)#100 | 0.22%(-0.063)#2,570 |
Common Questions
What are the Top 10 Cities with the Highest Percentage of Peruvian Population in Texas?
Top 10 Cities with the Highest Percentage of Peruvian Population in Texas are:
#1
3.42%
#2
3.02%
#3
2.68%
#4
2.38%
#5
2.09%
#6
2.05%
#7
1.92%
#8
1.77%
#9
1.75%
#10
1.57%
What city has the Highest Percentage of Peruvian Population in Texas?
Hideaway has the Highest Percentage of Peruvian Population in Texas with 3.42%.
What is the Percentage of Peruvian Population in the State of Texas?
Percentage of Peruvian Population in Texas is 0.13%.
What is the Percentage of Peruvian Population in the United States?
Percentage of Peruvian Population in the United States is 0.22%.