Cities with the Highest Percentage of Immigrants from South Central Asia in Texas
RELATED REPORTS & OPTIONS
South Central Asia
Texas
Compare Cities
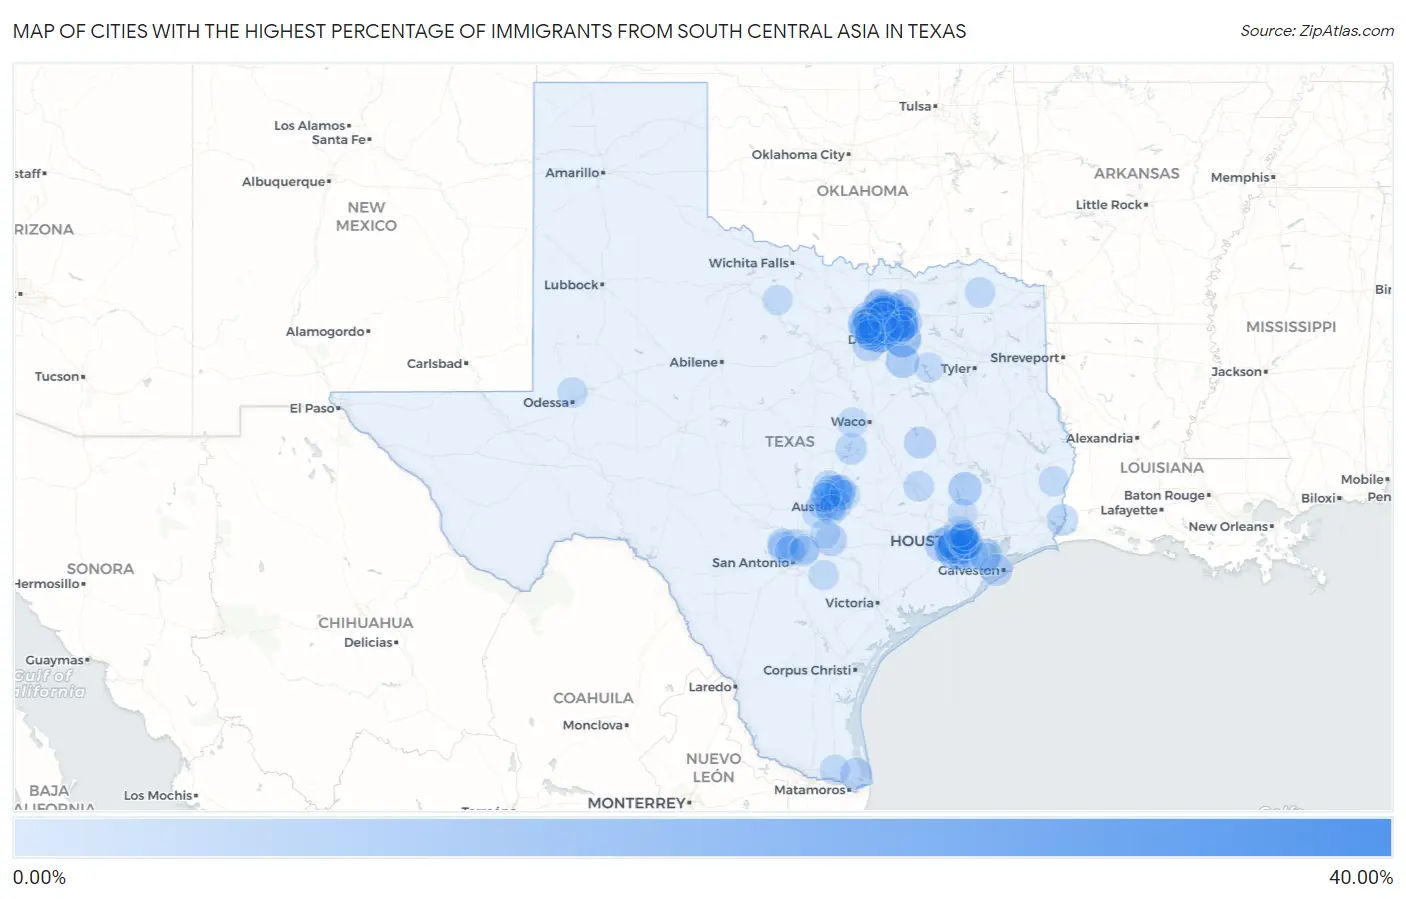
Map of Cities with the Highest Percentage of Immigrants from South Central Asia in Texas
0.00%
40.00%
Cities with the Highest Percentage of Immigrants from South Central Asia in Texas
| City | South Central Asia | vs State | vs National | |
| 1. | Hebron | 32.84% | 1.60%(+31.2)#1 | 1.31%(+31.5)#13 |
| 2. | Irving | 13.77% | 1.60%(+12.2)#2 | 1.31%(+12.5)#93 |
| 3. | Coppell | 13.61% | 1.60%(+12.0)#3 | 1.31%(+12.3)#94 |
| 4. | Sunnyvale | 12.85% | 1.60%(+11.3)#4 | 1.31%(+11.5)#110 |
| 5. | Murphy | 12.50% | 1.60%(+10.9)#5 | 1.31%(+11.2)#118 |
| 6. | Frisco | 12.46% | 1.60%(+10.9)#6 | 1.31%(+11.2)#119 |
| 7. | Sugar Land | 12.13% | 1.60%(+10.5)#7 | 1.31%(+10.8)#126 |
| 8. | Plano | 10.36% | 1.60%(+8.76)#8 | 1.31%(+9.05)#170 |
| 9. | Parker | 8.61% | 1.60%(+7.02)#9 | 1.31%(+7.30)#225 |
| 10. | Four Corners | 8.36% | 1.60%(+6.76)#10 | 1.31%(+7.05)#238 |
| 11. | Roanoke | 7.84% | 1.60%(+6.24)#11 | 1.31%(+6.53)#263 |
| 12. | Missouri City | 7.14% | 1.60%(+5.54)#12 | 1.31%(+5.83)#293 |
| 13. | Steiner Ranch | 7.06% | 1.60%(+5.47)#13 | 1.31%(+5.76)#299 |
| 14. | Meadows Place | 7.06% | 1.60%(+5.46)#14 | 1.31%(+5.75)#301 |
| 15. | New Waverly | 6.99% | 1.60%(+5.39)#15 | 1.31%(+5.68)#307 |
| 16. | Bristol | 6.94% | 1.60%(+5.34)#16 | 1.31%(+5.63)#311 |
| 17. | Mcleod | 6.80% | 1.60%(+5.20)#17 | 1.31%(+5.49)#316 |
| 18. | Fulshear | 6.49% | 1.60%(+4.89)#18 | 1.31%(+5.18)#344 |
| 19. | Euless | 6.45% | 1.60%(+4.85)#19 | 1.31%(+5.14)#348 |
| 20. | Stafford | 5.92% | 1.60%(+4.32)#20 | 1.31%(+4.61)#395 |
| 21. | Wells Branch | 5.75% | 1.60%(+4.15)#21 | 1.31%(+4.44)#422 |
| 22. | Flower Mound | 5.41% | 1.60%(+3.81)#22 | 1.31%(+4.10)#464 |
| 23. | Nassau Bay | 5.31% | 1.60%(+3.71)#23 | 1.31%(+4.00)#478 |
| 24. | Cedar Park | 5.23% | 1.60%(+3.64)#24 | 1.31%(+3.92)#492 |
| 25. | Brushy Creek | 5.17% | 1.60%(+3.57)#25 | 1.31%(+3.86)#502 |
| 26. | Westlake | 5.15% | 1.60%(+3.56)#26 | 1.31%(+3.85)#504 |
| 27. | Dalworthington Gardens | 5.13% | 1.60%(+3.53)#27 | 1.31%(+3.82)#507 |
| 28. | Allen | 5.11% | 1.60%(+3.51)#28 | 1.31%(+3.80)#510 |
| 29. | Cinco Ranch | 5.08% | 1.60%(+3.48)#29 | 1.31%(+3.77)#519 |
| 30. | Mckinney | 5.06% | 1.60%(+3.46)#30 | 1.31%(+3.75)#523 |
| 31. | Prosper | 5.03% | 1.60%(+3.43)#31 | 1.31%(+3.72)#525 |
| 32. | Southlake | 5.01% | 1.60%(+3.41)#32 | 1.31%(+3.70)#528 |
| 33. | Carrollton | 4.85% | 1.60%(+3.26)#33 | 1.31%(+3.54)#553 |
| 34. | Southside Place | 4.82% | 1.60%(+3.22)#34 | 1.31%(+3.51)#561 |
| 35. | Hackberry | 4.61% | 1.60%(+3.01)#35 | 1.31%(+3.30)#591 |
| 36. | Tiki Island | 4.52% | 1.60%(+2.92)#36 | 1.31%(+3.21)#607 |
| 37. | Bayview | 4.46% | 1.60%(+2.87)#37 | 1.31%(+3.16)#622 |
| 38. | Krugerville | 4.45% | 1.60%(+2.85)#38 | 1.31%(+3.14)#625 |
| 39. | Richardson | 4.40% | 1.60%(+2.81)#39 | 1.31%(+3.10)#634 |
| 40. | Staples | 4.40% | 1.60%(+2.80)#40 | 1.31%(+3.09)#635 |
| 41. | Marquez | 4.38% | 1.60%(+2.78)#41 | 1.31%(+3.07)#638 |
| 42. | Piney Point Village | 4.37% | 1.60%(+2.77)#42 | 1.31%(+3.06)#642 |
| 43. | Lewisville | 4.30% | 1.60%(+2.70)#43 | 1.31%(+2.99)#660 |
| 44. | Wylie | 4.22% | 1.60%(+2.62)#44 | 1.31%(+2.91)#673 |
| 45. | Little Elm | 4.17% | 1.60%(+2.57)#45 | 1.31%(+2.86)#685 |
| 46. | Farmers Branch | 4.08% | 1.60%(+2.48)#46 | 1.31%(+2.77)#700 |
| 47. | Bee Cave | 4.05% | 1.60%(+2.45)#47 | 1.31%(+2.74)#710 |
| 48. | Leander | 4.04% | 1.60%(+2.44)#48 | 1.31%(+2.73)#712 |
| 49. | Timberwood Park | 4.01% | 1.60%(+2.41)#49 | 1.31%(+2.70)#721 |
| 50. | Pearland | 3.91% | 1.60%(+2.31)#50 | 1.31%(+2.60)#743 |
| 51. | Morgan S Point Resort | 3.90% | 1.60%(+2.31)#51 | 1.31%(+2.60)#744 |
| 52. | Argyle | 3.90% | 1.60%(+2.31)#52 | 1.31%(+2.59)#745 |
| 53. | West Orange | 3.89% | 1.60%(+2.29)#53 | 1.31%(+2.58)#749 |
| 54. | Cross Mountain | 3.87% | 1.60%(+2.27)#54 | 1.31%(+2.56)#756 |
| 55. | Lost Creek | 3.80% | 1.60%(+2.20)#55 | 1.31%(+2.49)#780 |
| 56. | Pecan Grove | 3.76% | 1.60%(+2.16)#56 | 1.31%(+2.45)#788 |
| 57. | Hedwig Village | 3.75% | 1.60%(+2.15)#57 | 1.31%(+2.44)#793 |
| 58. | Bunker Hill Village | 3.61% | 1.60%(+2.02)#58 | 1.31%(+2.30)#839 |
| 59. | Mission Bend | 3.53% | 1.60%(+1.94)#59 | 1.31%(+2.23)#862 |
| 60. | Sachse | 3.30% | 1.60%(+1.70)#60 | 1.31%(+1.99)#943 |
| 61. | Seis Lagos | 3.22% | 1.60%(+1.62)#61 | 1.31%(+1.91)#973 |
| 62. | Bellaire | 3.20% | 1.60%(+1.61)#62 | 1.31%(+1.90)#980 |
| 63. | Colleyville | 3.20% | 1.60%(+1.60)#63 | 1.31%(+1.89)#986 |
| 64. | Round Rock | 3.05% | 1.60%(+1.45)#64 | 1.31%(+1.74)#1,058 |
| 65. | Melissa | 2.94% | 1.60%(+1.34)#65 | 1.31%(+1.63)#1,093 |
| 66. | Austin | 2.78% | 1.60%(+1.19)#66 | 1.31%(+1.48)#1,149 |
| 67. | Scenic Oaks | 2.77% | 1.60%(+1.18)#67 | 1.31%(+1.47)#1,156 |
| 68. | Dripping Springs | 2.71% | 1.60%(+1.11)#68 | 1.31%(+1.40)#1,186 |
| 69. | Sienna | 2.69% | 1.60%(+1.09)#69 | 1.31%(+1.38)#1,199 |
| 70. | Shavano Park | 2.68% | 1.60%(+1.08)#70 | 1.31%(+1.37)#1,205 |
| 71. | Bogata | 2.62% | 1.60%(+1.02)#71 | 1.31%(+1.31)#1,237 |
| 72. | College Station | 2.52% | 1.60%(+0.927)#72 | 1.31%(+1.22)#1,282 |
| 73. | West University Place | 2.47% | 1.60%(+0.875)#73 | 1.31%(+1.16)#1,312 |
| 74. | Volente | 2.44% | 1.60%(+0.842)#74 | 1.31%(+1.13)#1,338 |
| 75. | Hilshire Village | 2.37% | 1.60%(+0.768)#75 | 1.31%(+1.06)#1,380 |
| 76. | Addison | 2.31% | 1.60%(+0.717)#76 | 1.31%(+1.01)#1,406 |
| 77. | Jersey Village | 2.29% | 1.60%(+0.696)#77 | 1.31%(+0.985)#1,419 |
| 78. | Palm Valley | 2.29% | 1.60%(+0.695)#78 | 1.31%(+0.984)#1,422 |
| 79. | Gardendale | 2.29% | 1.60%(+0.693)#79 | 1.31%(+0.983)#1,423 |
| 80. | Stockdale | 2.28% | 1.60%(+0.684)#80 | 1.31%(+0.973)#1,432 |
| 81. | Grapevine | 2.17% | 1.60%(+0.572)#81 | 1.31%(+0.861)#1,501 |
| 82. | Aubrey | 2.12% | 1.60%(+0.527)#82 | 1.31%(+0.816)#1,545 |
| 83. | Trophy Club | 2.11% | 1.60%(+0.508)#83 | 1.31%(+0.797)#1,559 |
| 84. | The Colony | 2.08% | 1.60%(+0.487)#84 | 1.31%(+0.777)#1,568 |
| 85. | Olney | 2.06% | 1.60%(+0.458)#85 | 1.31%(+0.748)#1,593 |
| 86. | Bedford | 2.04% | 1.60%(+0.441)#86 | 1.31%(+0.730)#1,609 |
| 87. | Pflugerville | 2.03% | 1.60%(+0.434)#87 | 1.31%(+0.724)#1,615 |
| 88. | Kirbyville | 1.97% | 1.60%(+0.368)#88 | 1.31%(+0.658)#1,671 |
| 89. | Sunset Valley | 1.96% | 1.60%(+0.360)#89 | 1.31%(+0.649)#1,677 |
| 90. | Keller | 1.93% | 1.60%(+0.331)#90 | 1.31%(+0.620)#1,703 |
| 91. | Houston | 1.89% | 1.60%(+0.293)#91 | 1.31%(+0.582)#1,732 |
| 92. | Garland | 1.86% | 1.60%(+0.264)#92 | 1.31%(+0.554)#1,755 |
| 93. | Hudson Bend | 1.85% | 1.60%(+0.254)#93 | 1.31%(+0.544)#1,770 |
| 94. | League City | 1.81% | 1.60%(+0.217)#94 | 1.31%(+0.507)#1,800 |
| 95. | San Marcos | 1.81% | 1.60%(+0.212)#95 | 1.31%(+0.502)#1,806 |
| 96. | Crawford | 1.76% | 1.60%(+0.163)#96 | 1.31%(+0.452)#1,851 |
| 97. | Garden Ridge | 1.76% | 1.60%(+0.160)#97 | 1.31%(+0.449)#1,855 |
| 98. | Selma | 1.74% | 1.60%(+0.147)#98 | 1.31%(+0.436)#1,873 |
| 99. | The Woodlands | 1.71% | 1.60%(+0.110)#99 | 1.31%(+0.399)#1,913 |
| 100. | Mabank | 1.70% | 1.60%(+0.098)#100 | 1.31%(+0.388)#1,923 |
Common Questions
What are the Top 10 Cities with the Highest Percentage of Immigrants from South Central Asia in Texas?
Top 10 Cities with the Highest Percentage of Immigrants from South Central Asia in Texas are:
#1
32.84%
#2
13.77%
#3
13.61%
#4
12.85%
#5
12.50%
#6
12.46%
#7
12.13%
#8
10.36%
#9
8.61%
#10
8.36%
What city has the Highest Percentage of Immigrants from South Central Asia in Texas?
Hebron has the Highest Percentage of Immigrants from South Central Asia in Texas with 32.84%.
What is the Percentage of Immigrants from South Central Asia in the State of Texas?
Percentage of Immigrants from South Central Asia in Texas is 1.60%.
What is the Percentage of Immigrants from South Central Asia in the United States?
Percentage of Immigrants from South Central Asia in the United States is 1.31%.