Zip Codes with the Highest Percentage of Population with a Degree in Visual and Performing Arts in Magnolia, TX
RELATED REPORTS & OPTIONS
Visual and Performing Arts
Magnolia
Compare Zip Codes
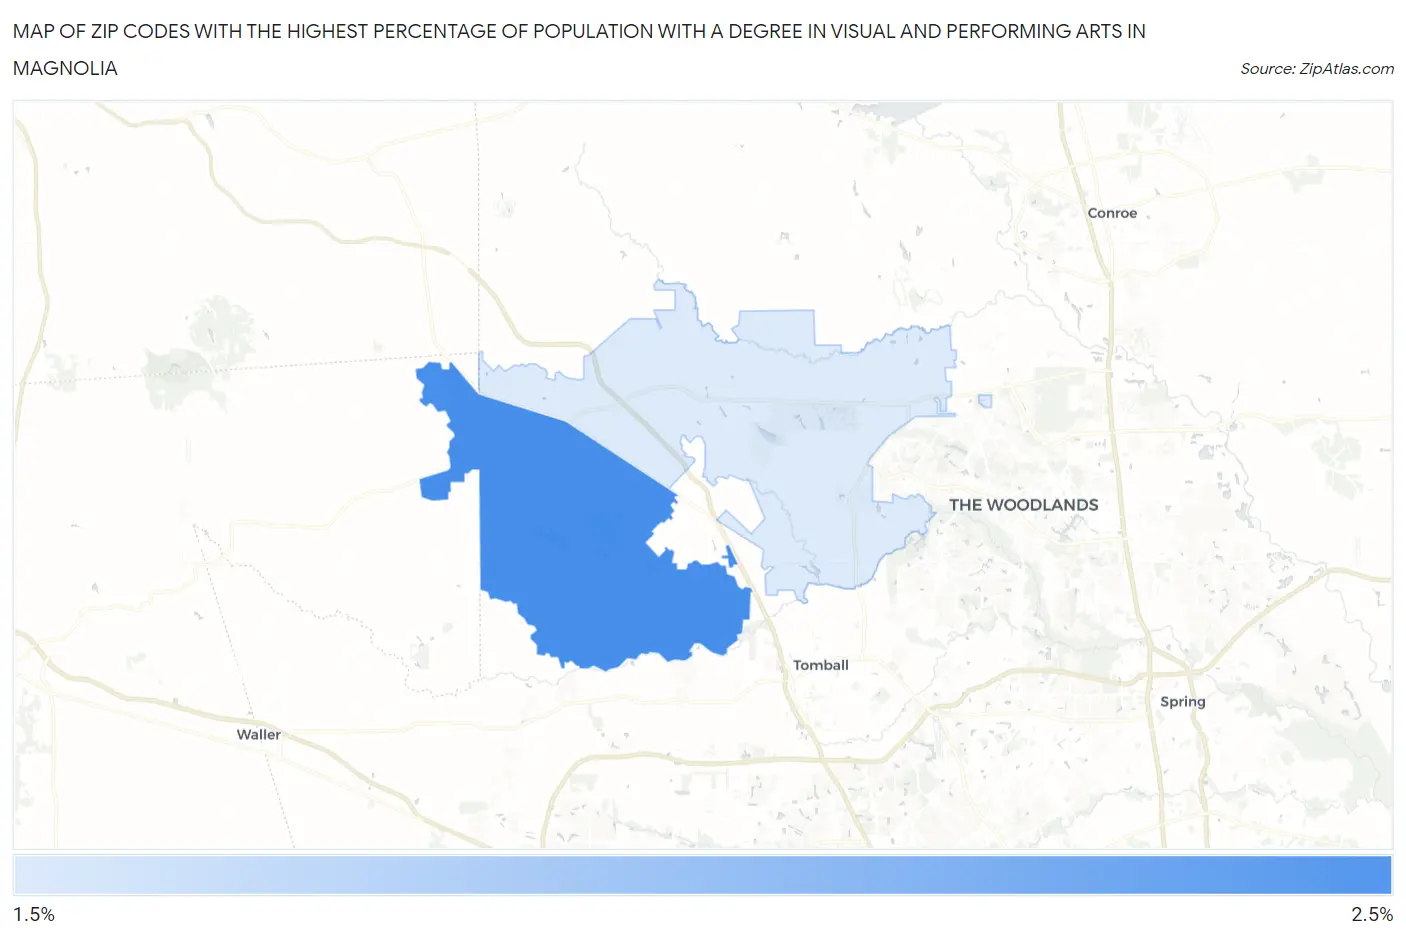
Map of Zip Codes with the Highest Percentage of Population with a Degree in Visual and Performing Arts in Magnolia
0.0%
2.5%
Zip Codes with the Highest Percentage of Population with a Degree in Visual and Performing Arts in Magnolia, TX
| Zip Code | % Graduates | vs State | vs National | |
| 1. | 77355 | 2.2% | 3.2%(-1.04)#815 | 4.3%(-2.08)#15,809 |
| 2. | 77354 | 2.0% | 3.2%(-1.23)#872 | 4.3%(-2.27)#16,525 |
1
Common Questions
What are the Top Zip Codes with the Highest Percentage of Population with a Degree in Visual and Performing Arts in Magnolia, TX?
Top Zip Codes with the Highest Percentage of Population with a Degree in Visual and Performing Arts in Magnolia, TX are:
What zip code has the Highest Percentage of Population with a Degree in Visual and Performing Arts in Magnolia, TX?
77355 has the Highest Percentage of Population with a Degree in Visual and Performing Arts in Magnolia, TX with 2.2%.
What is the Percentage of Population with a Degree in Visual and Performing Arts in Texas?
Percentage of Population with a Degree in Visual and Performing Arts in Texas is 3.2%.
What is the Percentage of Population with a Degree in Visual and Performing Arts in the United States?
Percentage of Population with a Degree in Visual and Performing Arts in the United States is 4.3%.