Cities with the Highest Percentage of Immigrants from Japan in Texas
RELATED REPORTS & OPTIONS
Japan
Texas
Compare Cities
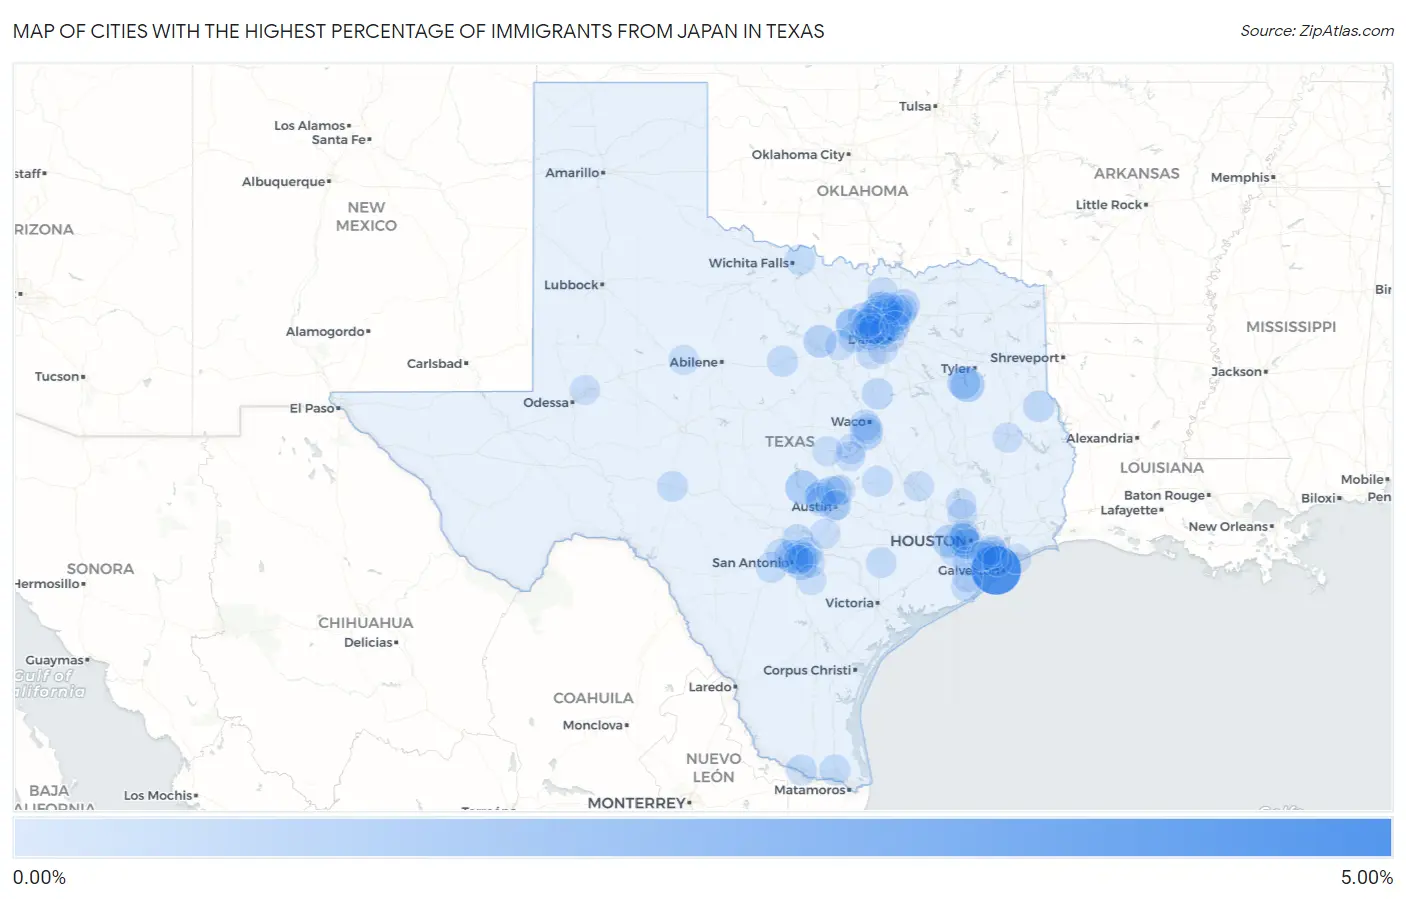
Map of Cities with the Highest Percentage of Immigrants from Japan in Texas
0.00%
5.00%
Cities with the Highest Percentage of Immigrants from Japan in Texas
| City | Japan | vs State | vs National | |
| 1. | Tiki Island | 4.85% | 0.061%(+4.79)#1 | 0.10%(+4.75)#15 |
| 2. | Coppell | 1.45% | 0.061%(+1.39)#2 | 0.10%(+1.35)#159 |
| 3. | Cottonwood Shores | 1.08% | 0.061%(+1.02)#3 | 0.10%(+0.977)#254 |
| 4. | Paloma Creek | 1.06% | 0.061%(+1.00)#4 | 0.10%(+0.961)#259 |
| 5. | Shadybrook | 1.04% | 0.061%(+0.976)#5 | 0.10%(+0.933)#268 |
| 6. | Piney Point Village | 0.83% | 0.061%(+0.774)#6 | 0.10%(+0.732)#354 |
| 7. | Coffee City | 0.79% | 0.061%(+0.730)#7 | 0.10%(+0.687)#392 |
| 8. | Castle Hills | 0.75% | 0.061%(+0.693)#8 | 0.10%(+0.650)#416 |
| 9. | Little Elm | 0.71% | 0.061%(+0.652)#9 | 0.10%(+0.610)#436 |
| 10. | Cinco Ranch | 0.71% | 0.061%(+0.650)#10 | 0.10%(+0.607)#438 |
| 11. | Millsap | 0.70% | 0.061%(+0.635)#11 | 0.10%(+0.593)#445 |
| 12. | Lorena | 0.67% | 0.061%(+0.606)#12 | 0.10%(+0.563)#460 |
| 13. | China Grove | 0.66% | 0.061%(+0.602)#13 | 0.10%(+0.559)#464 |
| 14. | Northlake | 0.60% | 0.061%(+0.536)#14 | 0.10%(+0.493)#536 |
| 15. | Melissa | 0.56% | 0.061%(+0.503)#15 | 0.10%(+0.461)#570 |
| 16. | Windcrest | 0.50% | 0.061%(+0.437)#16 | 0.10%(+0.394)#669 |
| 17. | Corinth | 0.45% | 0.061%(+0.392)#17 | 0.10%(+0.350)#743 |
| 18. | Belterra | 0.43% | 0.061%(+0.373)#18 | 0.10%(+0.331)#782 |
| 19. | Lago Vista | 0.42% | 0.061%(+0.361)#19 | 0.10%(+0.319)#801 |
| 20. | Bulverde | 0.41% | 0.061%(+0.351)#20 | 0.10%(+0.308)#821 |
| 21. | Highland Village | 0.41% | 0.061%(+0.348)#21 | 0.10%(+0.306)#828 |
| 22. | Bynum | 0.41% | 0.061%(+0.346)#22 | 0.10%(+0.303)#832 |
| 23. | Pecan Acres | 0.40% | 0.061%(+0.341)#23 | 0.10%(+0.299)#839 |
| 24. | Center | 0.38% | 0.061%(+0.322)#24 | 0.10%(+0.280)#866 |
| 25. | Addison | 0.35% | 0.061%(+0.286)#25 | 0.10%(+0.243)#942 |
| 26. | Plano | 0.32% | 0.061%(+0.261)#26 | 0.10%(+0.219)#1,014 |
| 27. | Woodway | 0.32% | 0.061%(+0.258)#27 | 0.10%(+0.216)#1,019 |
| 28. | Ranger | 0.32% | 0.061%(+0.256)#28 | 0.10%(+0.214)#1,023 |
| 29. | Olmos Park | 0.31% | 0.061%(+0.245)#29 | 0.10%(+0.203)#1,052 |
| 30. | Fairview | 0.29% | 0.061%(+0.229)#30 | 0.10%(+0.186)#1,098 |
| 31. | Mission | 0.29% | 0.061%(+0.227)#31 | 0.10%(+0.185)#1,107 |
| 32. | Rockdale | 0.28% | 0.061%(+0.216)#32 | 0.10%(+0.173)#1,142 |
| 33. | Santa Rita Ranch | 0.27% | 0.061%(+0.213)#33 | 0.10%(+0.170)#1,151 |
| 34. | Allen | 0.27% | 0.061%(+0.212)#34 | 0.10%(+0.170)#1,154 |
| 35. | Castroville | 0.27% | 0.061%(+0.206)#35 | 0.10%(+0.164)#1,180 |
| 36. | Palm Valley | 0.27% | 0.061%(+0.206)#36 | 0.10%(+0.163)#1,182 |
| 37. | Frisco | 0.26% | 0.061%(+0.197)#37 | 0.10%(+0.154)#1,230 |
| 38. | Schertz | 0.26% | 0.061%(+0.195)#38 | 0.10%(+0.153)#1,232 |
| 39. | Highland Park | 0.25% | 0.061%(+0.188)#39 | 0.10%(+0.145)#1,261 |
| 40. | Sonora | 0.25% | 0.061%(+0.185)#40 | 0.10%(+0.142)#1,279 |
| 41. | Newark | 0.24% | 0.061%(+0.183)#41 | 0.10%(+0.140)#1,287 |
| 42. | Sugar Land | 0.24% | 0.061%(+0.182)#42 | 0.10%(+0.139)#1,295 |
| 43. | Brushy Creek | 0.23% | 0.061%(+0.173)#43 | 0.10%(+0.130)#1,332 |
| 44. | Bellaire | 0.23% | 0.061%(+0.172)#44 | 0.10%(+0.130)#1,333 |
| 45. | Mckinney | 0.23% | 0.061%(+0.164)#45 | 0.10%(+0.122)#1,372 |
| 46. | New Hope | 0.23% | 0.061%(+0.164)#46 | 0.10%(+0.122)#1,373 |
| 47. | Dean | 0.22% | 0.061%(+0.160)#47 | 0.10%(+0.117)#1,390 |
| 48. | Hallettsville | 0.22% | 0.061%(+0.159)#48 | 0.10%(+0.116)#1,396 |
| 49. | West University Place | 0.21% | 0.061%(+0.146)#49 | 0.10%(+0.104)#1,456 |
| 50. | Bacliff | 0.20% | 0.061%(+0.143)#50 | 0.10%(+0.100)#1,473 |
| 51. | Converse | 0.20% | 0.061%(+0.142)#51 | 0.10%(+0.100)#1,477 |
| 52. | Rollingwood | 0.20% | 0.061%(+0.137)#52 | 0.10%(+0.095)#1,506 |
| 53. | Helotes | 0.20% | 0.061%(+0.136)#53 | 0.10%(+0.094)#1,513 |
| 54. | Lake Jackson | 0.19% | 0.061%(+0.129)#54 | 0.10%(+0.086)#1,560 |
| 55. | Tioga | 0.18% | 0.061%(+0.124)#55 | 0.10%(+0.081)#1,587 |
| 56. | Conroe | 0.18% | 0.061%(+0.122)#56 | 0.10%(+0.079)#1,593 |
| 57. | St Hedwig | 0.18% | 0.061%(+0.116)#57 | 0.10%(+0.074)#1,625 |
| 58. | Richland Hills | 0.18% | 0.061%(+0.115)#58 | 0.10%(+0.073)#1,633 |
| 59. | Briarcliff | 0.18% | 0.061%(+0.115)#59 | 0.10%(+0.073)#1,635 |
| 60. | Morgan S Point Resort | 0.17% | 0.061%(+0.111)#60 | 0.10%(+0.068)#1,660 |
| 61. | Seabrook | 0.17% | 0.061%(+0.109)#61 | 0.10%(+0.066)#1,667 |
| 62. | Lakeway | 0.16% | 0.061%(+0.104)#62 | 0.10%(+0.061)#1,695 |
| 63. | Round Rock | 0.16% | 0.061%(+0.099)#63 | 0.10%(+0.056)#1,729 |
| 64. | College Station | 0.15% | 0.061%(+0.092)#64 | 0.10%(+0.049)#1,781 |
| 65. | Sienna | 0.15% | 0.061%(+0.090)#65 | 0.10%(+0.048)#1,792 |
| 66. | Shoreacres | 0.15% | 0.061%(+0.090)#66 | 0.10%(+0.047)#1,798 |
| 67. | Mansfield | 0.15% | 0.061%(+0.088)#67 | 0.10%(+0.046)#1,811 |
| 68. | Lake Worth | 0.15% | 0.061%(+0.088)#68 | 0.10%(+0.045)#1,816 |
| 69. | Spring Valley Village | 0.14% | 0.061%(+0.081)#69 | 0.10%(+0.039)#1,877 |
| 70. | Irving | 0.14% | 0.061%(+0.077)#70 | 0.10%(+0.035)#1,910 |
| 71. | Prosper | 0.14% | 0.061%(+0.076)#71 | 0.10%(+0.033)#1,923 |
| 72. | Hewitt | 0.13% | 0.061%(+0.070)#72 | 0.10%(+0.028)#1,961 |
| 73. | Iowa Colony | 0.13% | 0.061%(+0.065)#73 | 0.10%(+0.023)#1,999 |
| 74. | Angleton | 0.12% | 0.061%(+0.063)#74 | 0.10%(+0.020)#2,024 |
| 75. | Bedford | 0.12% | 0.061%(+0.062)#75 | 0.10%(+0.020)#2,025 |
| 76. | Houston | 0.12% | 0.061%(+0.062)#76 | 0.10%(+0.019)#2,033 |
| 77. | Keller | 0.12% | 0.061%(+0.061)#77 | 0.10%(+0.018)#2,041 |
| 78. | Floresville | 0.12% | 0.061%(+0.060)#78 | 0.10%(+0.018)#2,045 |
| 79. | Cedar Park | 0.12% | 0.061%(+0.056)#79 | 0.10%(+0.013)#2,095 |
| 80. | Bolivar Peninsula | 0.11% | 0.061%(+0.053)#80 | 0.10%(+0.011)#2,113 |
| 81. | Lufkin | 0.11% | 0.061%(+0.050)#81 | 0.10%(+0.008)#2,148 |
| 82. | Duncanville | 0.11% | 0.061%(+0.048)#82 | 0.10%(+0.006)#2,165 |
| 83. | Farmers Branch | 0.11% | 0.061%(+0.048)#83 | 0.10%(+0.005)#2,174 |
| 84. | Friendswood | 0.11% | 0.061%(+0.047)#84 | 0.10%(+0.004)#2,181 |
| 85. | Texas City | 0.11% | 0.061%(+0.047)#85 | 0.10%(+0.004)#2,183 |
| 86. | Austin | 0.100% | 0.061%(+0.039)#86 | 0.10%(-0.003)#2,268 |
| 87. | Kirby | 0.098% | 0.061%(+0.037)#87 | 0.10%(-0.005)#2,289 |
| 88. | Webster | 0.098% | 0.061%(+0.037)#88 | 0.10%(-0.006)#2,296 |
| 89. | Annetta | 0.097% | 0.061%(+0.037)#89 | 0.10%(-0.006)#2,298 |
| 90. | Colleyville | 0.093% | 0.061%(+0.032)#90 | 0.10%(-0.011)#2,340 |
| 91. | Flower Mound | 0.091% | 0.061%(+0.030)#91 | 0.10%(-0.012)#2,355 |
| 92. | Grapevine | 0.091% | 0.061%(+0.030)#92 | 0.10%(-0.013)#2,361 |
| 93. | Trophy Club | 0.091% | 0.061%(+0.030)#93 | 0.10%(-0.013)#2,362 |
| 94. | The Woodlands | 0.090% | 0.061%(+0.029)#94 | 0.10%(-0.014)#2,378 |
| 95. | Richardson | 0.088% | 0.061%(+0.027)#95 | 0.10%(-0.015)#2,389 |
| 96. | Belton | 0.086% | 0.061%(+0.026)#96 | 0.10%(-0.017)#2,403 |
| 97. | Sweetwater | 0.085% | 0.061%(+0.024)#97 | 0.10%(-0.018)#2,418 |
| 98. | Copperas Cove | 0.085% | 0.061%(+0.024)#98 | 0.10%(-0.018)#2,422 |
| 99. | San Marcos | 0.085% | 0.061%(+0.024)#99 | 0.10%(-0.019)#2,424 |
| 100. | Midland | 0.083% | 0.061%(+0.022)#100 | 0.10%(-0.020)#2,457 |
Common Questions
What are the Top 10 Cities with the Highest Percentage of Immigrants from Japan in Texas?
Top 10 Cities with the Highest Percentage of Immigrants from Japan in Texas are:
#1
4.85%
#2
1.45%
#3
1.08%
#4
1.06%
#5
1.04%
#6
0.83%
#7
0.79%
#8
0.75%
#9
0.71%
#10
0.71%
What city has the Highest Percentage of Immigrants from Japan in Texas?
Tiki Island has the Highest Percentage of Immigrants from Japan in Texas with 4.85%.
What is the Percentage of Immigrants from Japan in the State of Texas?
Percentage of Immigrants from Japan in Texas is 0.061%.
What is the Percentage of Immigrants from Japan in the United States?
Percentage of Immigrants from Japan in the United States is 0.10%.