Redfield, TX
Redfield Map
Redfield Overview
339
TOTAL POPULATION
181
MALE POPULATION
158
FEMALE POPULATION
114.56
MALES / 100 FEMALES
87.29
FEMALES / 100 MALES
57.6
MEDIAN AGE
2.9
AVG FAMILY SIZE
2.9
AVG HOUSEHOLD SIZE
$136,814
PER CAPITA INCOME
$89,000
AVG FAMILY INCOME
$89,000
AVG HOUSEHOLD INCOME
0.56
INEQUALITY / GINI INDEX
187
LABOR FORCE [ PEOPLE ]
74.5%
PERCENT IN LABOR FORCE
3.7%
UNEMPLOYMENT RATE
Race in Redfield
The most populous races in Redfield are White / Caucasian (151 | 44.5%), Black / African American (86 | 25.4%), and Hispanic or Latino (66 | 19.5%).
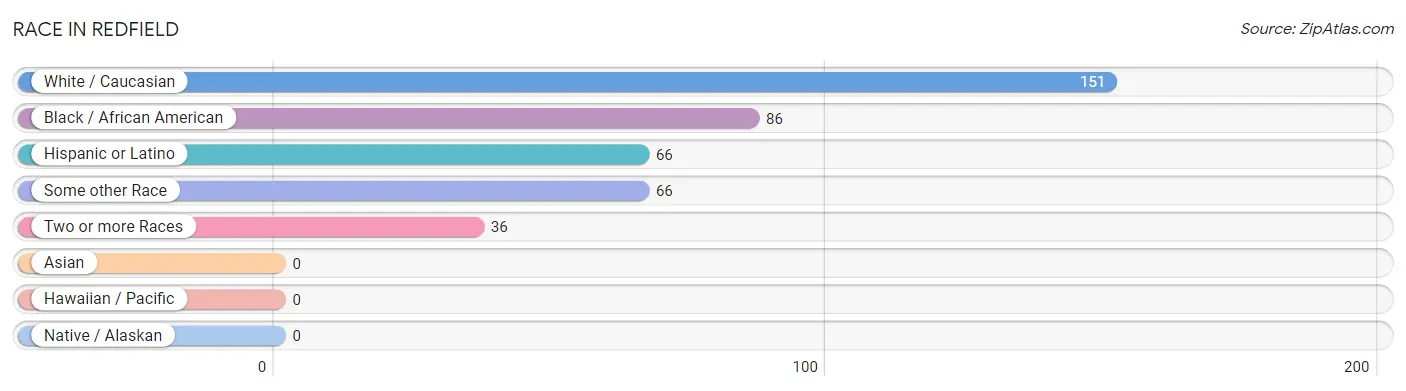
| Race | # Population | % Population |
| Asian | 0 | 0.0% |
| Black / African American | 86 | 25.4% |
| Hawaiian / Pacific | 0 | 0.0% |
| Hispanic or Latino | 66 | 19.5% |
| Native / Alaskan | 0 | 0.0% |
| White / Caucasian | 151 | 44.5% |
| Two or more Races | 36 | 10.6% |
| Some other Race | 66 | 19.5% |
| Total | 339 | 100.0% |
Ancestry in Redfield
The most populous ancestries reported in Redfield are Mexican (66 | 19.5%), English (50 | 14.7%), German (18 | 5.3%), and Irish (18 | 5.3%), together accounting for 44.8% of all Redfield residents.
| Ancestry | # Population | % Population |
| English | 50 | 14.7% |
| German | 18 | 5.3% |
| Irish | 18 | 5.3% |
| Mexican | 66 | 19.5% | View All 4 Rows |
Immigrants in Redfield
The most numerous immigrant groups reported in Redfield came from Central America (66 | 19.5%), Latin America (66 | 19.5%), and Mexico (66 | 19.5%), together accounting for 58.4% of all Redfield residents.
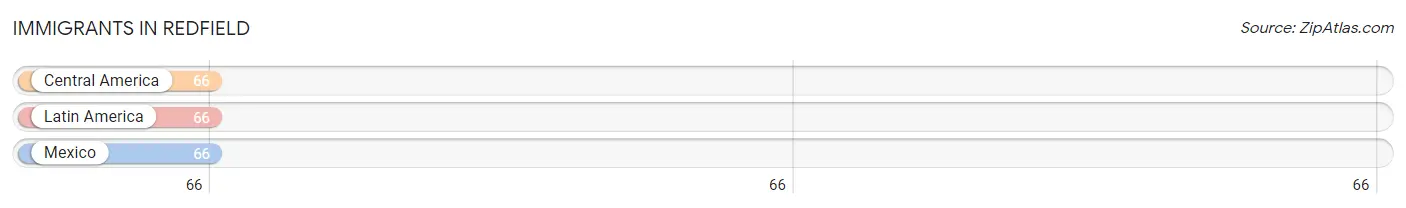
| Immigration Origin | # Population | % Population |
| Central America | 66 | 19.5% |
| Latin America | 66 | 19.5% |
| Mexico | 66 | 19.5% | View All 3 Rows |
Sex and Age in Redfield
Sex and Age in Redfield
The most populous age groups in Redfield are 65 to 69 Years (40 | 22.1%) for men and 60 to 64 Years (91 | 57.6%) for women.
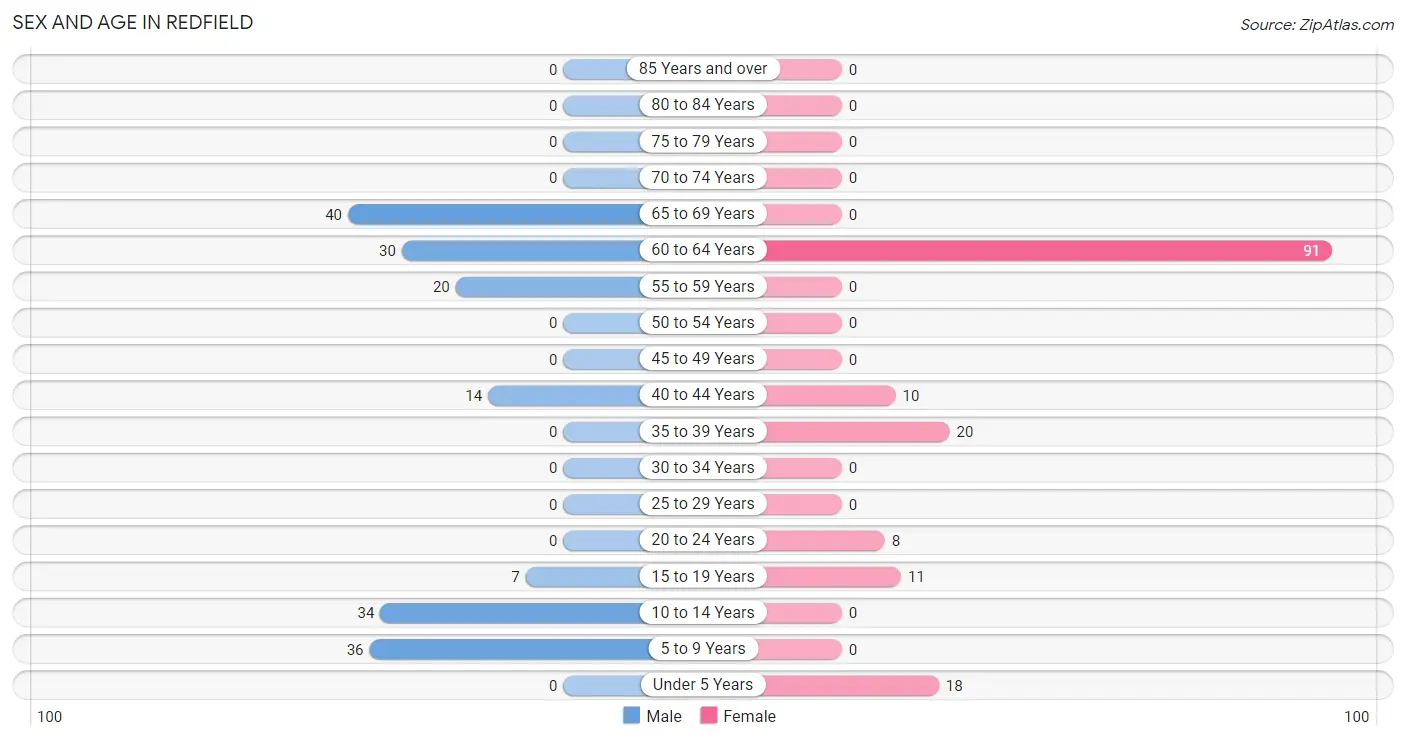
| Age Bracket | Male | Female |
| Under 5 Years | 0 (0.0%) | 18 (11.4%) |
| 5 to 9 Years | 36 (19.9%) | 0 (0.0%) |
| 10 to 14 Years | 34 (18.8%) | 0 (0.0%) |
| 15 to 19 Years | 7 (3.9%) | 11 (7.0%) |
| 20 to 24 Years | 0 (0.0%) | 8 (5.1%) |
| 25 to 29 Years | 0 (0.0%) | 0 (0.0%) |
| 30 to 34 Years | 0 (0.0%) | 0 (0.0%) |
| 35 to 39 Years | 0 (0.0%) | 20 (12.7%) |
| 40 to 44 Years | 14 (7.7%) | 10 (6.3%) |
| 45 to 49 Years | 0 (0.0%) | 0 (0.0%) |
| 50 to 54 Years | 0 (0.0%) | 0 (0.0%) |
| 55 to 59 Years | 20 (11.1%) | 0 (0.0%) |
| 60 to 64 Years | 30 (16.6%) | 91 (57.6%) |
| 65 to 69 Years | 40 (22.1%) | 0 (0.0%) |
| 70 to 74 Years | 0 (0.0%) | 0 (0.0%) |
| 75 to 79 Years | 0 (0.0%) | 0 (0.0%) |
| 80 to 84 Years | 0 (0.0%) | 0 (0.0%) |
| 85 Years and over | 0 (0.0%) | 0 (0.0%) |
| Total | 181 (100.0%) | 158 (100.0%) |
Families and Households in Redfield
Median Family Size in Redfield
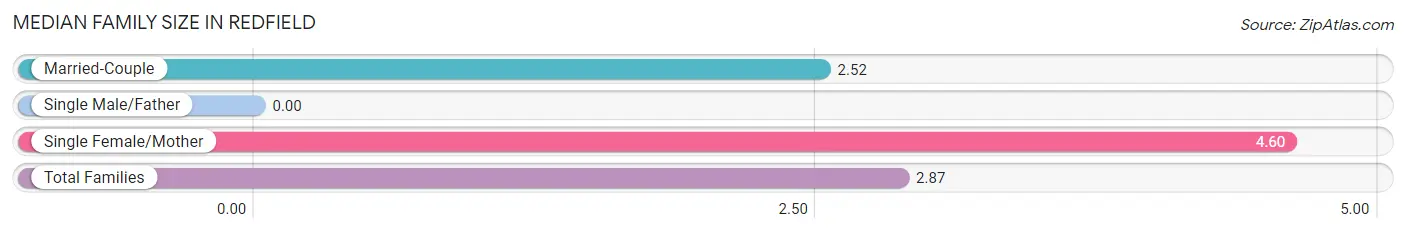
| Family Type | # Families | Family Size |
| Married-Couple | 98 (83.1%) | 2.52 |
| Single Male/Father | 0 (0.0%) | - |
| Single Female/Mother | 20 (17.0%) | 4.60 |
| Total Families | 118 (100.0%) | 2.87 |
Median Household Size in Redfield
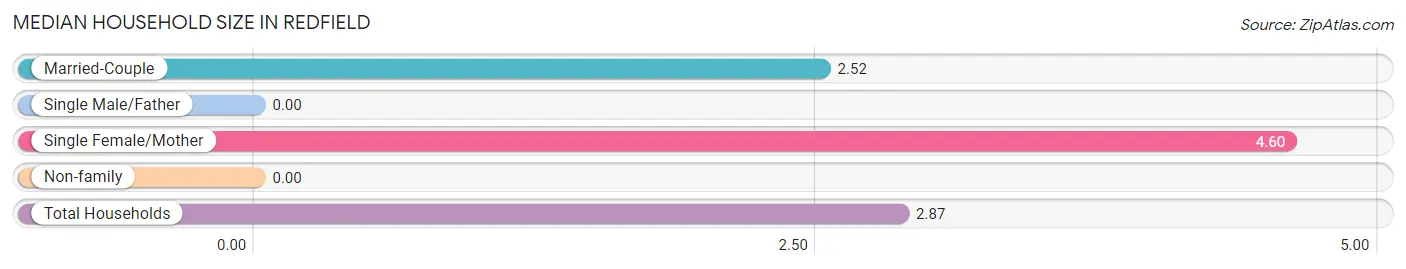
| Household Type | # Households | Household Size |
| Married-Couple | 98 (83.1%) | 2.52 |
| Single Male/Father | 0 (0.0%) | - |
| Single Female/Mother | 20 (17.0%) | 4.60 |
| Non-family | 0 (0.0%) | - |
| Total Households | 118 (100.0%) | 2.87 |
Household Size by Marriage Status in Redfield
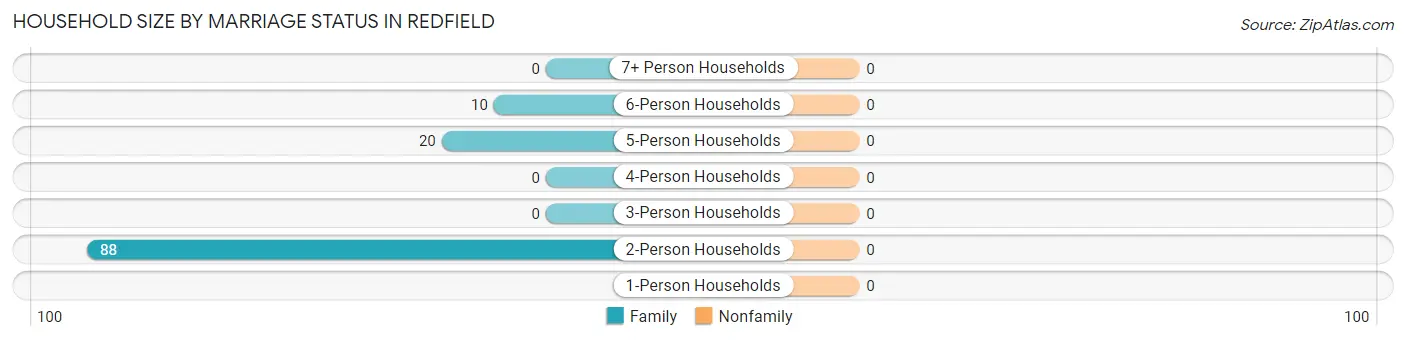
| Household Size | Family Households | Nonfamily Households |
| 1-Person Households | - | 0 (0.0%) |
| 2-Person Households | 88 (74.6%) | 0 (0.0%) |
| 3-Person Households | 0 (0.0%) | 0 (0.0%) |
| 4-Person Households | 0 (0.0%) | 0 (0.0%) |
| 5-Person Households | 20 (17.0%) | 0 (0.0%) |
| 6-Person Households | 10 (8.5%) | 0 (0.0%) |
| 7+ Person Households | 0 (0.0%) | 0 (0.0%) |
| Total | 118 (100.0%) | 0 (0.0%) |
Female Fertility in Redfield
Fertility by Age in Redfield
| Age Bracket | Women with Births | Births / 1,000 Women |
| 15 to 19 years | 0 (0.0%) | 0.0 |
| 20 to 34 years | 0 (0.0%) | 0.0 |
| 35 to 50 years | 0 (0.0%) | 0.0 |
| Total | 0 (0.0%) | 0.0 |
Fertility by Age by Marriage Status in Redfield
| Age Bracket | Married | Unmarried |
| 15 to 19 years | 0 (0.0%) | 0 (0.0%) |
| 20 to 34 years | 0 (0.0%) | 0 (0.0%) |
| 35 to 50 years | 0 (0.0%) | 0 (0.0%) |
| Total | 0 (0.0%) | 0 (0.0%) |
Fertility by Education in Redfield
| Educational Attainment | Women with Births | Births / 1,000 Women |
| Less than High School | 0 (0.0%) | 0.0 |
| High School Diploma | 0 (0.0%) | 0.0 |
| College or Associate's Degree | 0 (0.0%) | 0.0 |
| Bachelor's Degree | 0 (0.0%) | 0.0 |
| Graduate Degree | 0 (0.0%) | 0.0 |
| Total | 0 (0.0%) | 0.0 |
Fertility by Education by Marriage Status in Redfield
| Educational Attainment | Married | Unmarried |
| Less than High School | 0 (0.0%) | 0 (0.0%) |
| High School Diploma | 0 (0.0%) | 0 (0.0%) |
| College or Associate's Degree | 0 (0.0%) | 0 (0.0%) |
| Bachelor's Degree | 0 (0.0%) | 0 (0.0%) |
| Graduate Degree | 0 (0.0%) | 0 (0.0%) |
| Total | 0 (0.0%) | 0 (0.0%) |
Income in Redfield
Income Overview in Redfield
Per Capita Income in Redfield is $136,814, while median incomes of families and households are $89,000 and $89,000 respectively.
| Characteristic | Number | Measure |
| Per Capita Income | 339 | $136,814 |
| Median Family Income | 118 | $89,000 |
| Mean Family Income | 118 | $378,523 |
| Median Household Income | 118 | $89,000 |
| Mean Household Income | 118 | $378,523 |
| Income Deficit | 118 | $0 |
| Wage / Income Gap (%) | 339 | 0.00% |
| Wage / Income Gap ($) | 339 | 100.00¢ per $1 |
| Gini / Inequality Index | 339 | 0.56 |
Earnings by Sex in Redfield
| Sex | Number | Average Earnings |
| Male | 91 (48.7%) | $0 |
| Female | 96 (51.3%) | $0 |
| Total | 187 (100.0%) | $0 |
Earnings by Sex by Income Bracket in Redfield
The most common earnings brackets in Redfield are $100,000+ for men (40 | 44.0%) and $100,000+ for women (43 | 44.8%).
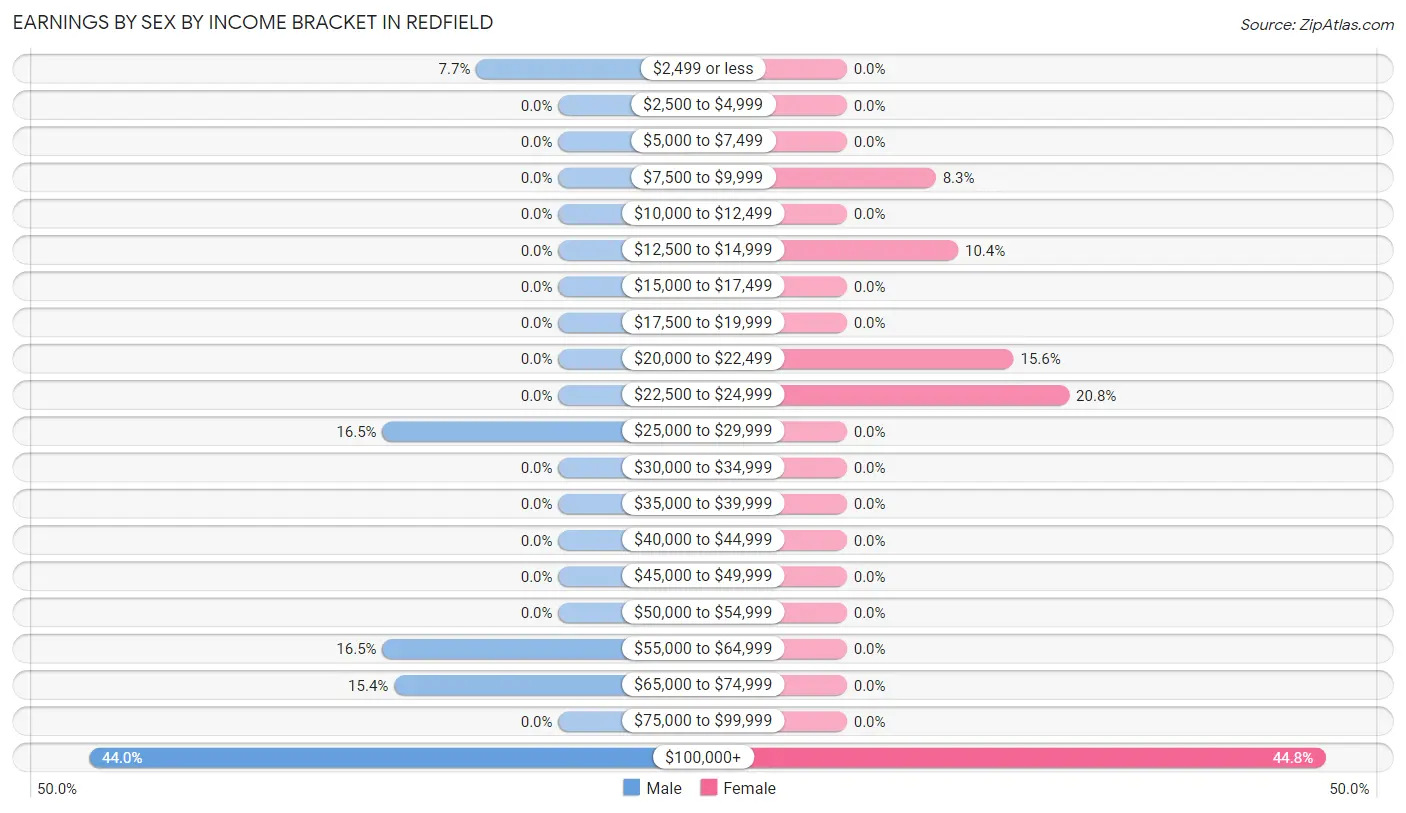
| Income | Male | Female |
| $2,499 or less | 7 (7.7%) | 0 (0.0%) |
| $2,500 to $4,999 | 0 (0.0%) | 0 (0.0%) |
| $5,000 to $7,499 | 0 (0.0%) | 0 (0.0%) |
| $7,500 to $9,999 | 0 (0.0%) | 8 (8.3%) |
| $10,000 to $12,499 | 0 (0.0%) | 0 (0.0%) |
| $12,500 to $14,999 | 0 (0.0%) | 10 (10.4%) |
| $15,000 to $17,499 | 0 (0.0%) | 0 (0.0%) |
| $17,500 to $19,999 | 0 (0.0%) | 0 (0.0%) |
| $20,000 to $22,499 | 0 (0.0%) | 15 (15.6%) |
| $22,500 to $24,999 | 0 (0.0%) | 20 (20.8%) |
| $25,000 to $29,999 | 15 (16.5%) | 0 (0.0%) |
| $30,000 to $34,999 | 0 (0.0%) | 0 (0.0%) |
| $35,000 to $39,999 | 0 (0.0%) | 0 (0.0%) |
| $40,000 to $44,999 | 0 (0.0%) | 0 (0.0%) |
| $45,000 to $49,999 | 0 (0.0%) | 0 (0.0%) |
| $50,000 to $54,999 | 0 (0.0%) | 0 (0.0%) |
| $55,000 to $64,999 | 15 (16.5%) | 0 (0.0%) |
| $65,000 to $74,999 | 14 (15.4%) | 0 (0.0%) |
| $75,000 to $99,999 | 0 (0.0%) | 0 (0.0%) |
| $100,000+ | 40 (44.0%) | 43 (44.8%) |
| Total | 91 (100.0%) | 96 (100.0%) |
Earnings by Sex by Educational Attainment in Redfield
| Educational Attainment | Male Income | Female Income |
| Less than High School | - | - |
| High School Diploma | - | - |
| College or Associate's Degree | - | - |
| Bachelor's Degree | - | - |
| Graduate Degree | - | - |
| Total | - | - |
Family Income in Redfield
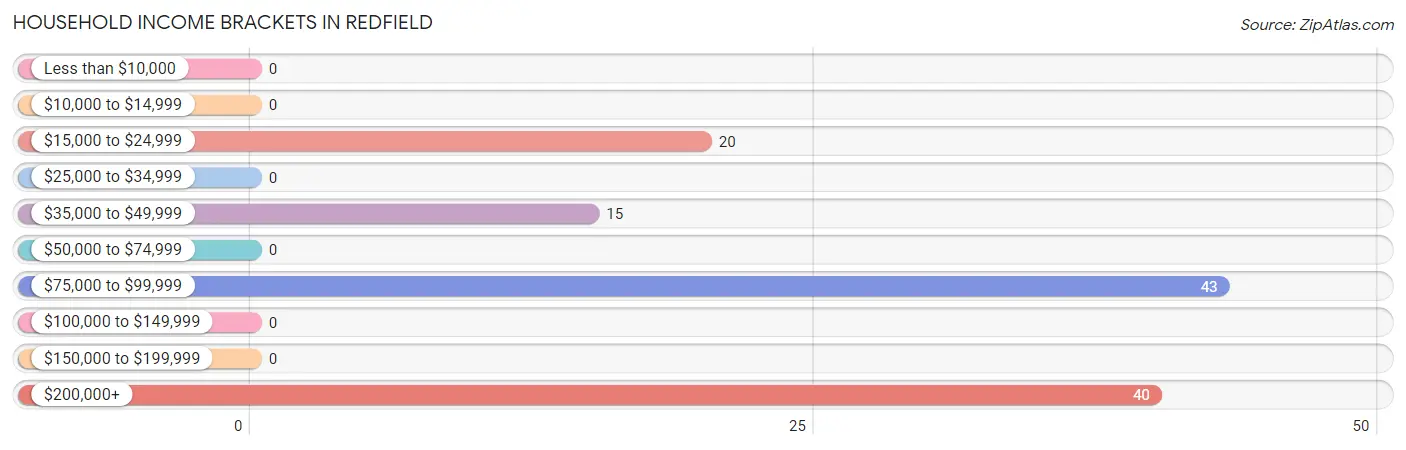
Family Income Brackets in Redfield
According to the Redfield family income data, there are 43 families falling into the $75,000 to $99,999 income range, which is the most common income bracket and makes up 36.4% of all families.
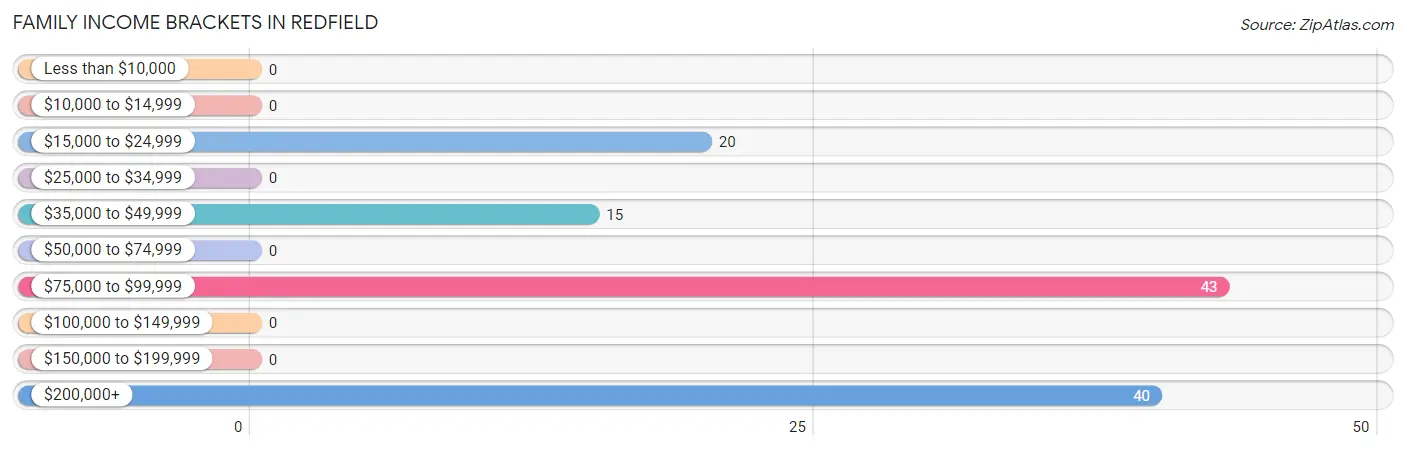
| Income Bracket | # Families | % Families |
| Less than $10,000 | 0 | 0.0% |
| $10,000 to $14,999 | 0 | 0.0% |
| $15,000 to $24,999 | 20 | 16.9% |
| $25,000 to $34,999 | 0 | 0.0% |
| $35,000 to $49,999 | 15 | 12.7% |
| $50,000 to $74,999 | 0 | 0.0% |
| $75,000 to $99,999 | 43 | 36.4% |
| $100,000 to $149,999 | 0 | 0.0% |
| $150,000 to $199,999 | 0 | 0.0% |
| $200,000+ | 40 | 33.9% |
Family Income by Famaliy Size in Redfield
| Income Bracket | # Families | Median Income |
| 2-Person Families | 88 (74.6%) | $0 |
| 3-Person Families | 0 (0.0%) | $0 |
| 4-Person Families | 0 (0.0%) | $0 |
| 5-Person Families | 20 (17.0%) | $0 |
| 6-Person Families | 10 (8.5%) | $0 |
| 7+ Person Families | 0 (0.0%) | $0 |
| Total | 118 (100.0%) | $89,000 |
Family Income by Number of Earners in Redfield
| Number of Earners | # Families | Median Income |
| No Earners | 18 (15.2%) | $0 |
| 1 Earner | 35 (29.7%) | $0 |
| 2 Earners | 55 (46.6%) | $0 |
| 3+ Earners | 10 (8.5%) | $0 |
| Total | 118 (100.0%) | $89,000 |
Household Income in Redfield
Household Income Brackets in Redfield
With 43 households falling in the category, the $75,000 to $99,999 income range is the most frequent in Redfield, accounting for 36.4% of all households.
| Income Bracket | # Households | % Households |
| Less than $10,000 | 0 | 0.0% |
| $10,000 to $14,999 | 0 | 0.0% |
| $15,000 to $24,999 | 20 | 16.9% |
| $25,000 to $34,999 | 0 | 0.0% |
| $35,000 to $49,999 | 15 | 12.7% |
| $50,000 to $74,999 | 0 | 0.0% |
| $75,000 to $99,999 | 43 | 36.4% |
| $100,000 to $149,999 | 0 | 0.0% |
| $150,000 to $199,999 | 0 | 0.0% |
| $200,000+ | 40 | 33.9% |
Household Income by Householder Age in Redfield
The median household income in Redfield is $89,000, with the highest median household income of $86,250 found in the 45 to 64 years age bracket for the primary householder. A total of 48 households (40.7%) fall into this category.
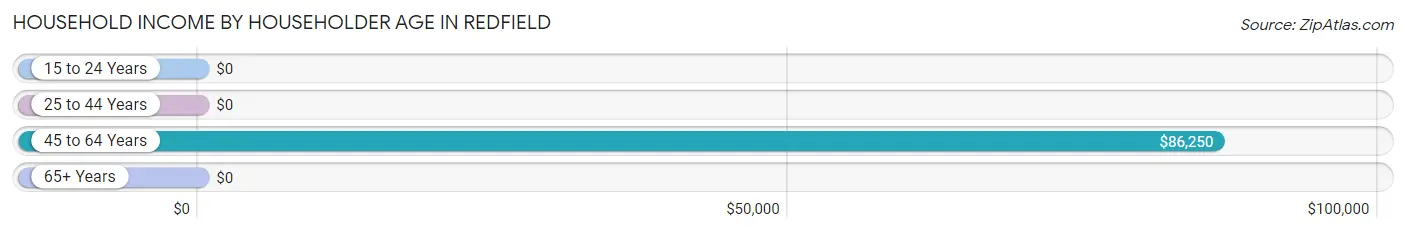
| Income Bracket | # Households | Median Income |
| 15 to 24 Years | 0 (0.0%) | $0 |
| 25 to 44 Years | 30 (25.4%) | $0 |
| 45 to 64 Years | 48 (40.7%) | $86,250 |
| 65+ Years | 40 (33.9%) | $0 |
| Total | 118 (100.0%) | $89,000 |
Poverty in Redfield
Income Below Poverty by Sex and Age in Redfield
With 29.8% poverty level for males and 24.0% for females among the residents of Redfield, 5 year old males and under 5 year old females are the most vulnerable to poverty, with 18 males (100.0%) and 18 females (100.0%) in their respective age groups living below the poverty level.
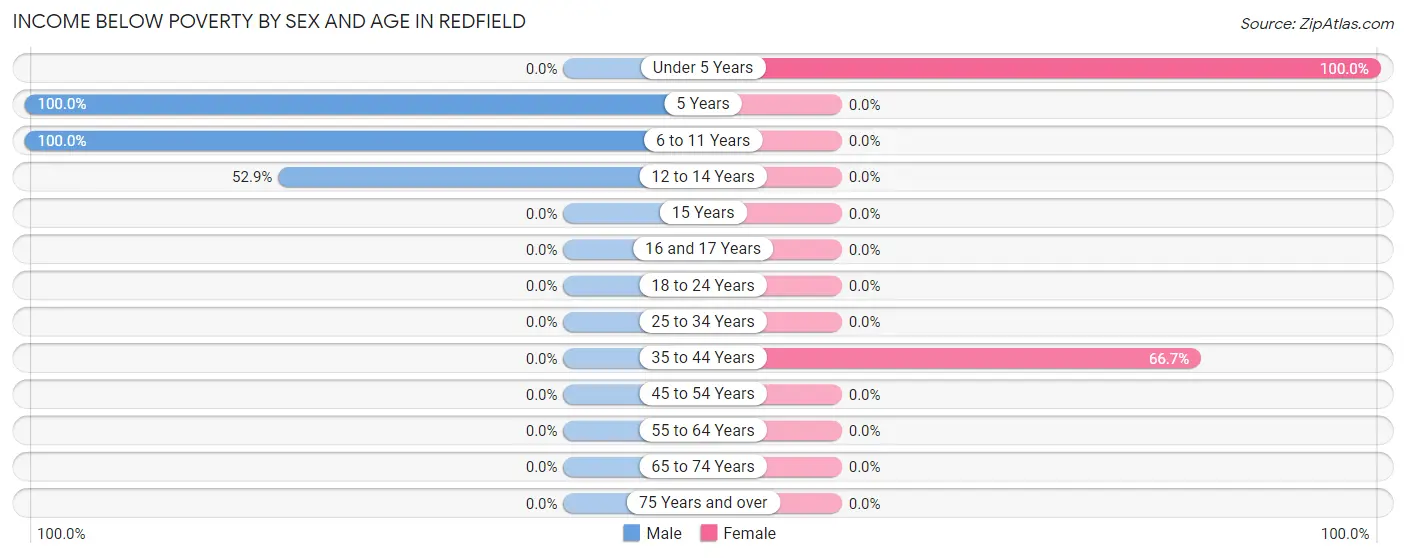
| Age Bracket | Male | Female |
| Under 5 Years | 0 (0.0%) | 18 (100.0%) |
| 5 Years | 18 (100.0%) | 0 (0.0%) |
| 6 to 11 Years | 18 (100.0%) | 0 (0.0%) |
| 12 to 14 Years | 18 (52.9%) | 0 (0.0%) |
| 15 Years | 0 (0.0%) | 0 (0.0%) |
| 16 and 17 Years | 0 (0.0%) | 0 (0.0%) |
| 18 to 24 Years | 0 (0.0%) | 0 (0.0%) |
| 25 to 34 Years | 0 (0.0%) | 0 (0.0%) |
| 35 to 44 Years | 0 (0.0%) | 20 (66.7%) |
| 45 to 54 Years | 0 (0.0%) | 0 (0.0%) |
| 55 to 64 Years | 0 (0.0%) | 0 (0.0%) |
| 65 to 74 Years | 0 (0.0%) | 0 (0.0%) |
| 75 Years and over | 0 (0.0%) | 0 (0.0%) |
| Total | 54 (29.8%) | 38 (24.0%) |
Income Above Poverty by Sex and Age in Redfield
According to the poverty statistics in Redfield, males aged 18 to 24 years and females aged 16 and 17 years are the age groups that are most secure financially, with 100.0% of males and 100.0% of females in these age groups living above the poverty line.
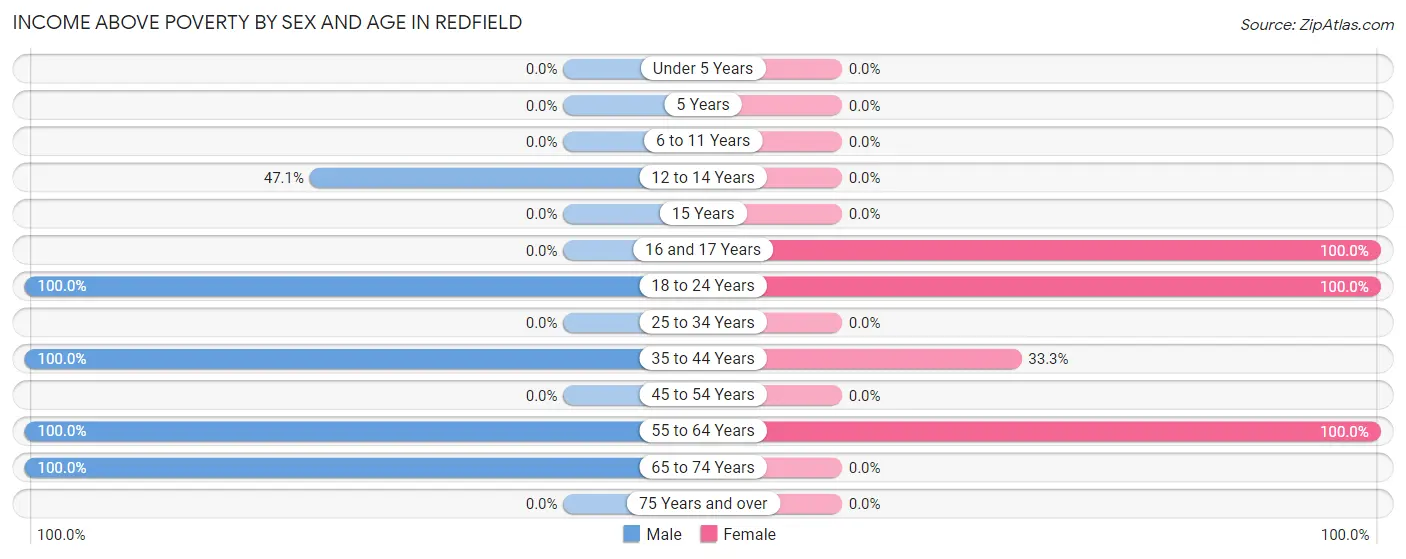
| Age Bracket | Male | Female |
| Under 5 Years | 0 (0.0%) | 0 (0.0%) |
| 5 Years | 0 (0.0%) | 0 (0.0%) |
| 6 to 11 Years | 0 (0.0%) | 0 (0.0%) |
| 12 to 14 Years | 16 (47.1%) | 0 (0.0%) |
| 15 Years | 0 (0.0%) | 0 (0.0%) |
| 16 and 17 Years | 0 (0.0%) | 11 (100.0%) |
| 18 to 24 Years | 7 (100.0%) | 8 (100.0%) |
| 25 to 34 Years | 0 (0.0%) | 0 (0.0%) |
| 35 to 44 Years | 14 (100.0%) | 10 (33.3%) |
| 45 to 54 Years | 0 (0.0%) | 0 (0.0%) |
| 55 to 64 Years | 50 (100.0%) | 91 (100.0%) |
| 65 to 74 Years | 40 (100.0%) | 0 (0.0%) |
| 75 Years and over | 0 (0.0%) | 0 (0.0%) |
| Total | 127 (70.2%) | 120 (75.9%) |
Income Below Poverty Among Married-Couple Families in Redfield
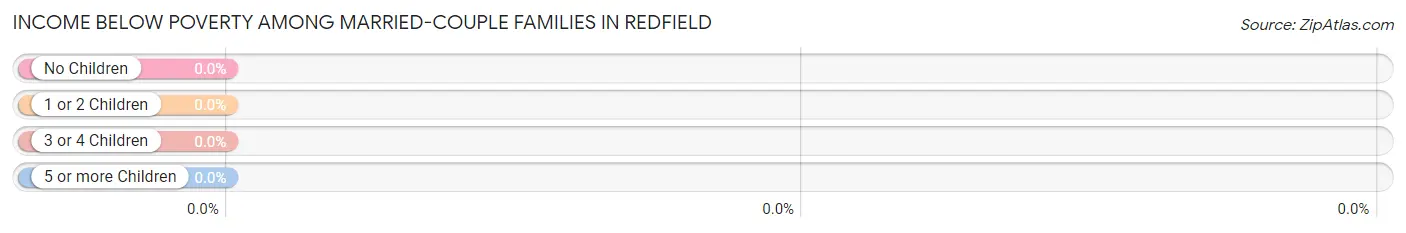
| Children | Above Poverty | Below Poverty |
| No Children | 88 (100.0%) | 0 (0.0%) |
| 1 or 2 Children | 10 (100.0%) | 0 (0.0%) |
| 3 or 4 Children | 0 (0.0%) | 0 (0.0%) |
| 5 or more Children | 0 (0.0%) | 0 (0.0%) |
| Total | 98 (100.0%) | 0 (0.0%) |
Income Below Poverty Among Single-Parent Households in Redfield
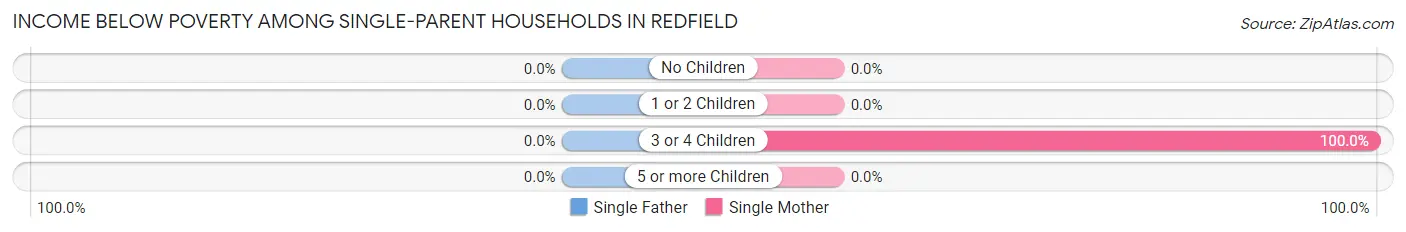
| Children | Single Father | Single Mother |
| No Children | 0 (0.0%) | 0 (0.0%) |
| 1 or 2 Children | 0 (0.0%) | 0 (0.0%) |
| 3 or 4 Children | 0 (0.0%) | 20 (100.0%) |
| 5 or more Children | 0 (0.0%) | 0 (0.0%) |
| Total | 0 (0.0%) | 20 (100.0%) |
Income Below Poverty Among Married-Couple vs Single-Parent Households in Redfield
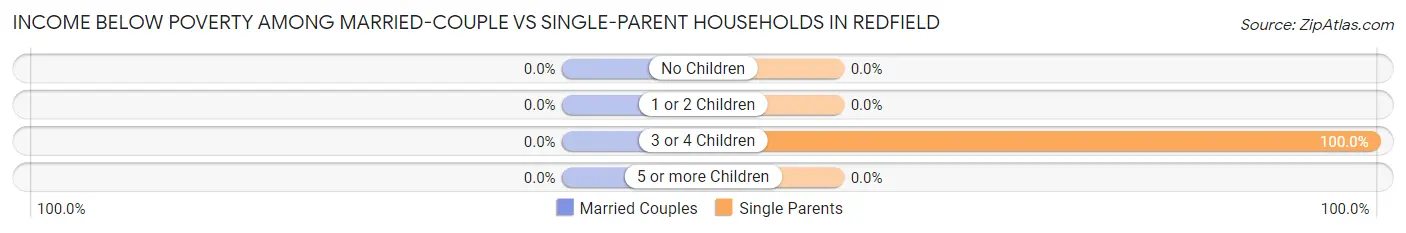
| Children | Married-Couple Families | Single-Parent Households |
| No Children | 0 (0.0%) | 0 (0.0%) |
| 1 or 2 Children | 0 (0.0%) | 0 (0.0%) |
| 3 or 4 Children | 0 (0.0%) | 20 (100.0%) |
| 5 or more Children | 0 (0.0%) | 0 (0.0%) |
| Total | 0 (0.0%) | 20 (100.0%) |
Employment Characteristics in Redfield
Employment by Class of Employer in Redfield
Among the 166 employed individuals in Redfield, private company employees (136 | 81.9%), self-employed (incorporated) (15 | 9.0%), and self-employed (not incorporated) (15 | 9.0%) make up the most common classes of employment.
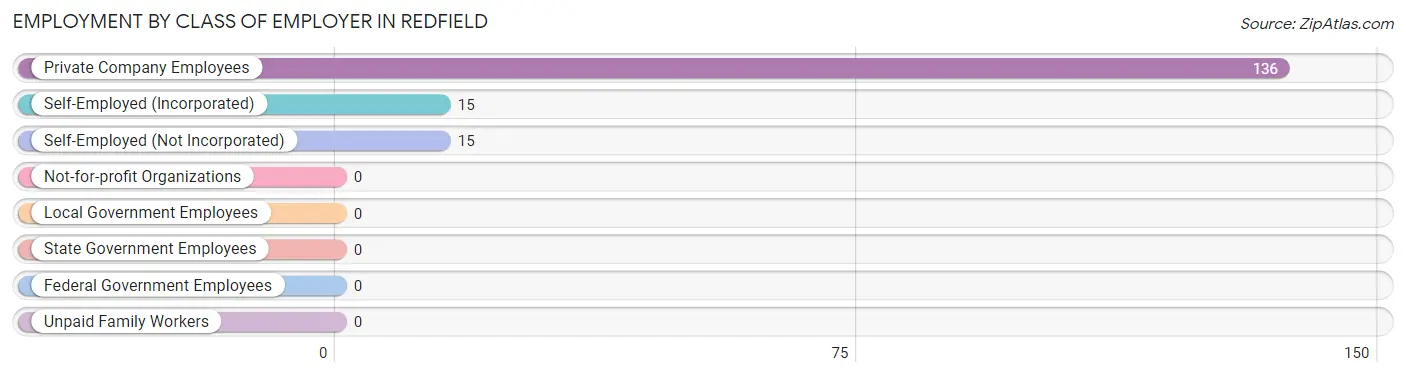
| Employer Class | # Employees | % Employees |
| Private Company Employees | 136 | 81.9% |
| Self-Employed (Incorporated) | 15 | 9.0% |
| Self-Employed (Not Incorporated) | 15 | 9.0% |
| Not-for-profit Organizations | 0 | 0.0% |
| Local Government Employees | 0 | 0.0% |
| State Government Employees | 0 | 0.0% |
| Federal Government Employees | 0 | 0.0% |
| Unpaid Family Workers | 0 | 0.0% |
| Total | 166 | 100.0% |
Employment Status by Age in Redfield
According to the labor force statistics for Redfield, out of the total population over 16 years of age (251), 74.5% or 187 individuals are in the labor force, with 3.7% or 7 of them unemployed. The age group with the highest labor force participation rate is 20 to 24 years, with 100.0% or 8 individuals in the labor force. Within the labor force, the 16 to 19 years age range has the highest percentage of unemployed individuals, with 100.0% or 7 of them being unemployed.
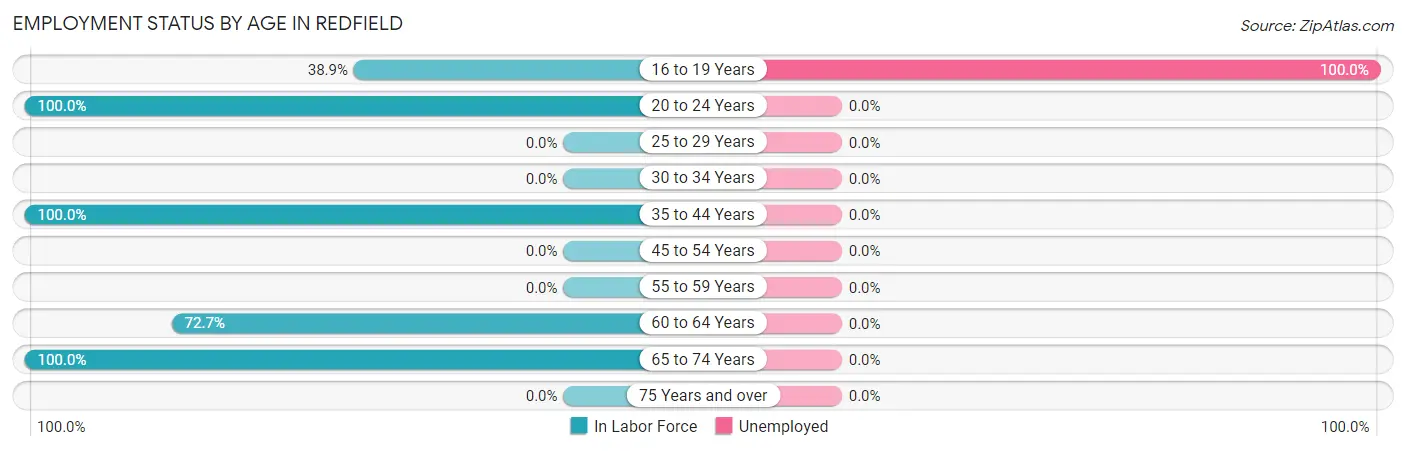
| Age Bracket | In Labor Force | Unemployed |
| 16 to 19 Years | 7 (38.9%) | 7 (100.0%) |
| 20 to 24 Years | 8 (100.0%) | 0 (0.0%) |
| 25 to 29 Years | 0 (0.0%) | 0 (0.0%) |
| 30 to 34 Years | 0 (0.0%) | 0 (0.0%) |
| 35 to 44 Years | 44 (100.0%) | 0 (0.0%) |
| 45 to 54 Years | 0 (0.0%) | 0 (0.0%) |
| 55 to 59 Years | 0 (0.0%) | 0 (0.0%) |
| 60 to 64 Years | 88 (72.7%) | 0 (0.0%) |
| 65 to 74 Years | 40 (100.0%) | 0 (0.0%) |
| 75 Years and over | 0 (0.0%) | 0 (0.0%) |
| Total | 187 (74.5%) | 7 (3.7%) |
Employment Status by Educational Attainment in Redfield
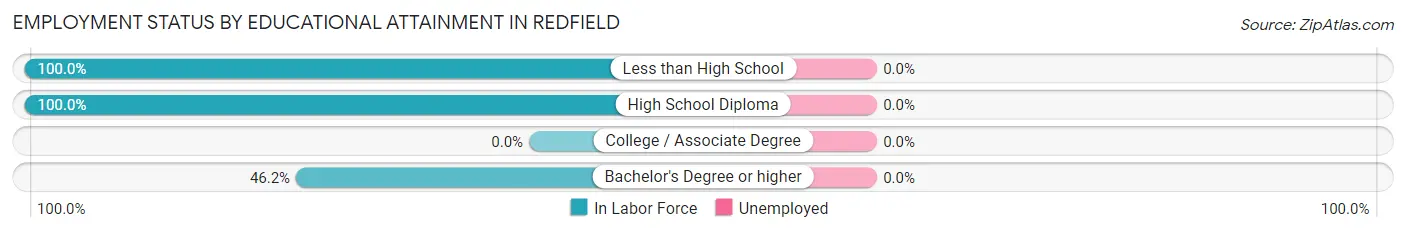
| Educational Attainment | In Labor Force | Unemployed |
| Less than High School | 24 (100.0%) | 0 (0.0%) |
| High School Diploma | 78 (100.0%) | 0 (0.0%) |
| College / Associate Degree | 0 (0.0%) | 0 (0.0%) |
| Bachelor's Degree or higher | 30 (46.2%) | 0 (0.0%) |
| Total | 132 (71.4%) | 0 (0.0%) |
Employment Occupations by Sex in Redfield
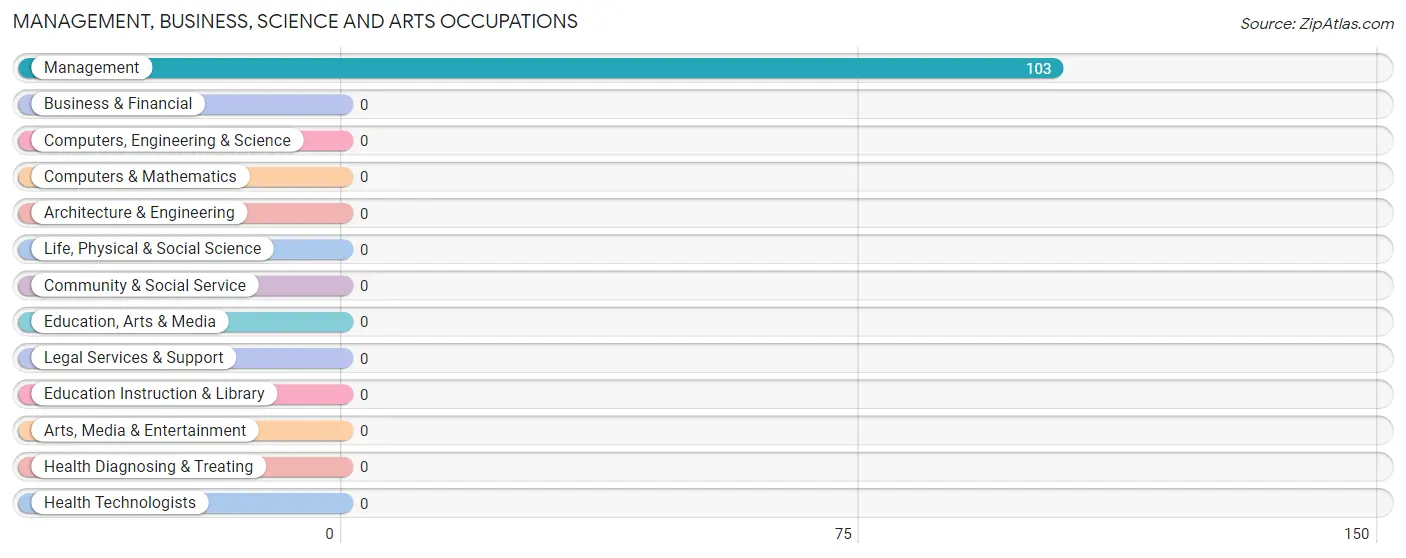
Management, Business, Science and Arts Occupations
The most common Management, Business, Science and Arts occupations in Redfield are , and Management (103 | 57.2%).
Management, Business, Science and Arts Occupations by Sex
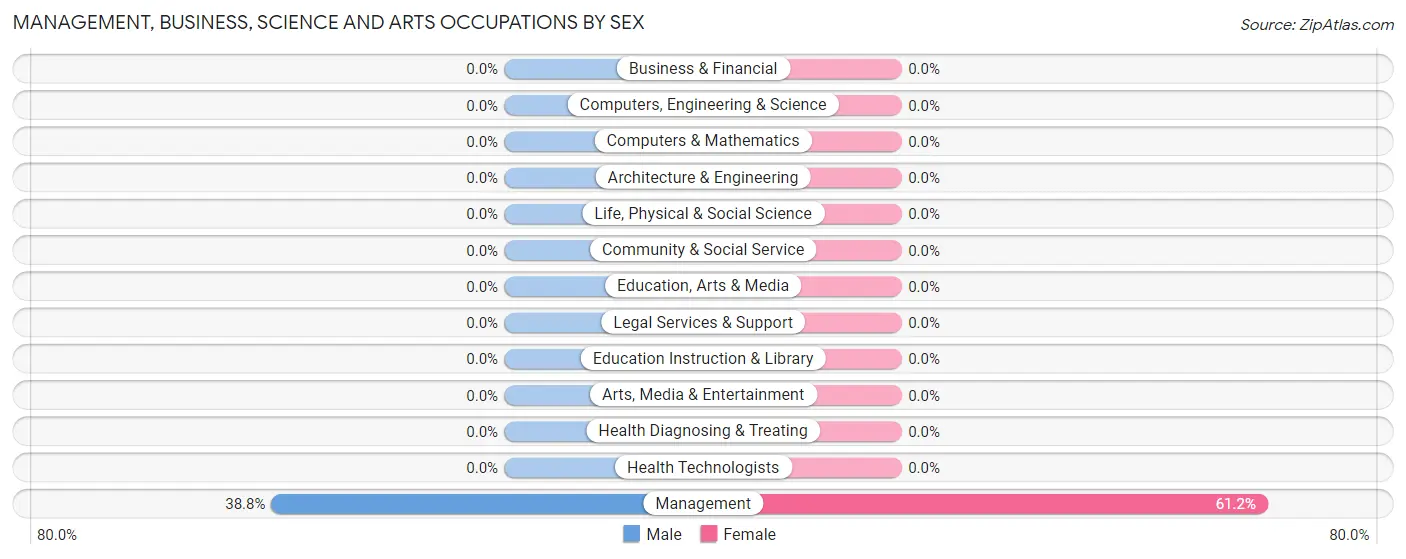
| Occupation | Male | Female |
| Management | 40 (38.8%) | 63 (61.2%) |
| Business & Financial | 0 (0.0%) | 0 (0.0%) |
| Computers, Engineering & Science | 0 (0.0%) | 0 (0.0%) |
| Computers & Mathematics | 0 (0.0%) | 0 (0.0%) |
| Architecture & Engineering | 0 (0.0%) | 0 (0.0%) |
| Life, Physical & Social Science | 0 (0.0%) | 0 (0.0%) |
| Community & Social Service | 0 (0.0%) | 0 (0.0%) |
| Education, Arts & Media | 0 (0.0%) | 0 (0.0%) |
| Legal Services & Support | 0 (0.0%) | 0 (0.0%) |
| Education Instruction & Library | 0 (0.0%) | 0 (0.0%) |
| Arts, Media & Entertainment | 0 (0.0%) | 0 (0.0%) |
| Health Diagnosing & Treating | 0 (0.0%) | 0 (0.0%) |
| Health Technologists | 0 (0.0%) | 0 (0.0%) |
| Total (Category) | 40 (38.8%) | 63 (61.2%) |
| Total (Overall) | 84 (46.7%) | 96 (53.3%) |
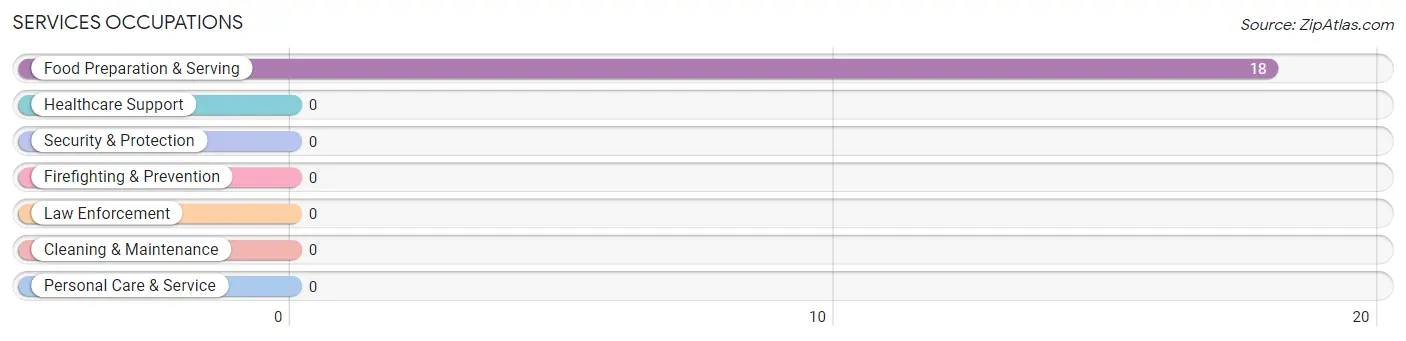
Services Occupations
The most common Services occupations in Redfield are , and Food Preparation & Serving (18 | 10.0%).
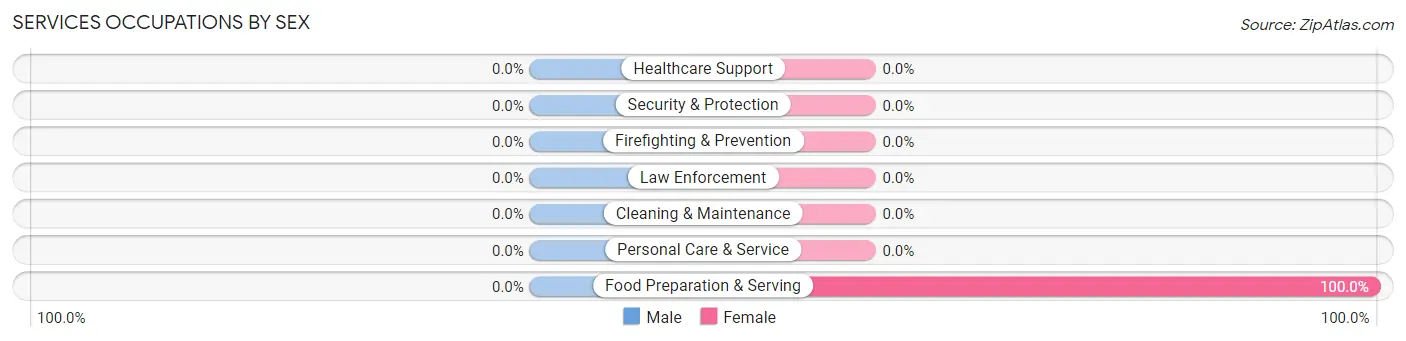
Services Occupations by Sex
| Occupation | Male | Female |
| Healthcare Support | 0 (0.0%) | 0 (0.0%) |
| Security & Protection | 0 (0.0%) | 0 (0.0%) |
| Firefighting & Prevention | 0 (0.0%) | 0 (0.0%) |
| Law Enforcement | 0 (0.0%) | 0 (0.0%) |
| Food Preparation & Serving | 0 (0.0%) | 18 (100.0%) |
| Cleaning & Maintenance | 0 (0.0%) | 0 (0.0%) |
| Personal Care & Service | 0 (0.0%) | 0 (0.0%) |
| Total (Category) | 0 (0.0%) | 18 (100.0%) |
| Total (Overall) | 84 (46.7%) | 96 (53.3%) |
Sales and Office Occupations
The most common Sales and Office occupations in Redfield are , and Sales & Related (30 | 16.7%).
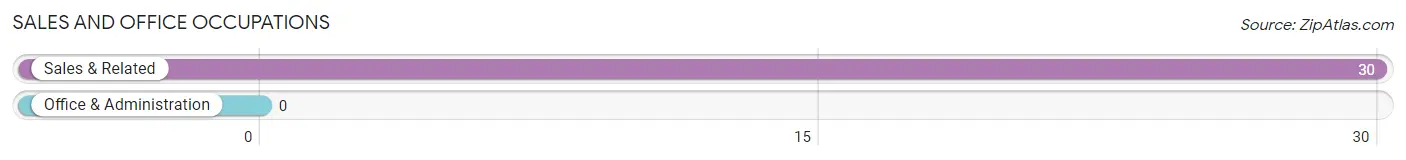
Sales and Office Occupations by Sex
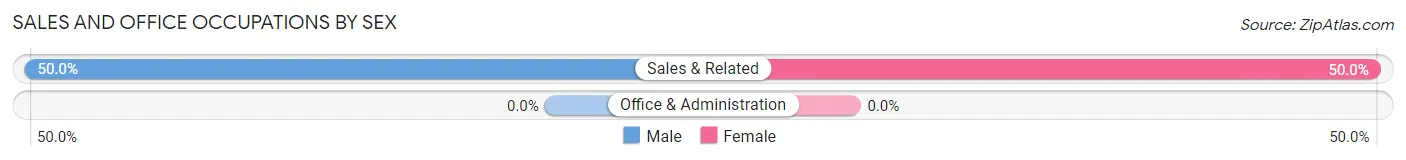
| Occupation | Male | Female |
| Sales & Related | 15 (50.0%) | 15 (50.0%) |
| Office & Administration | 0 (0.0%) | 0 (0.0%) |
| Total (Category) | 15 (50.0%) | 15 (50.0%) |
| Total (Overall) | 84 (46.7%) | 96 (53.3%) |
Natural Resources, Construction and Maintenance Occupations
The most common Natural Resources, Construction and Maintenance occupations in Redfield are , and Farming, Fishing & Forestry (14 | 7.8%).
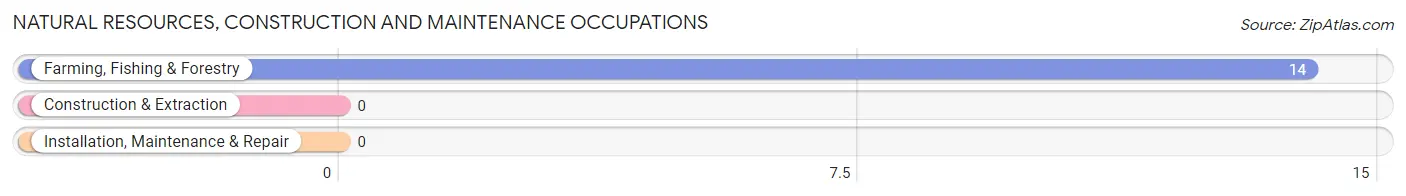
Natural Resources, Construction and Maintenance Occupations by Sex
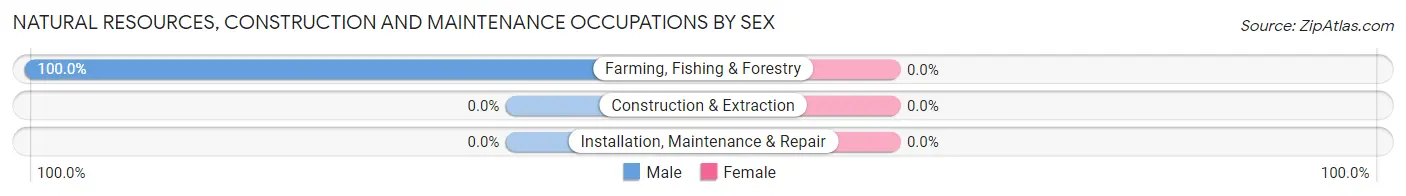
| Occupation | Male | Female |
| Farming, Fishing & Forestry | 14 (100.0%) | 0 (0.0%) |
| Construction & Extraction | 0 (0.0%) | 0 (0.0%) |
| Installation, Maintenance & Repair | 0 (0.0%) | 0 (0.0%) |
| Total (Category) | 14 (100.0%) | 0 (0.0%) |
| Total (Overall) | 84 (46.7%) | 96 (53.3%) |
Production, Transportation and Moving Occupations
The most common Production, Transportation and Moving occupations in Redfield are , and Material Moving (15 | 8.3%).
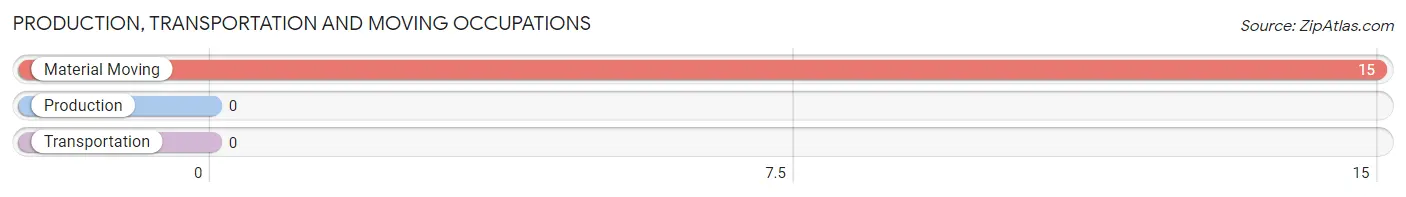
Production, Transportation and Moving Occupations by Sex
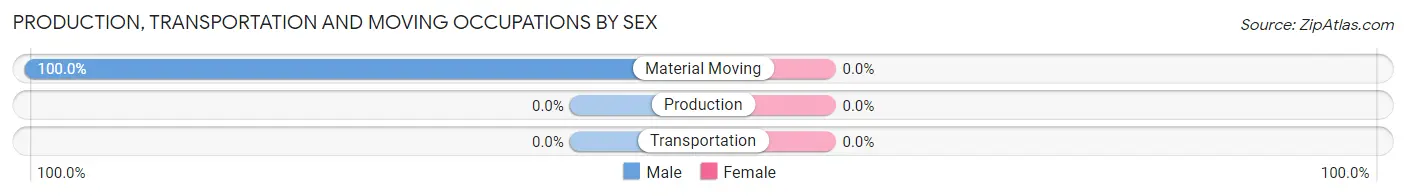
| Occupation | Male | Female |
| Production | 0 (0.0%) | 0 (0.0%) |
| Transportation | 0 (0.0%) | 0 (0.0%) |
| Material Moving | 15 (100.0%) | 0 (0.0%) |
| Total (Category) | 15 (100.0%) | 0 (0.0%) |
| Total (Overall) | 84 (46.7%) | 96 (53.3%) |
Employment Industries by Sex in Redfield
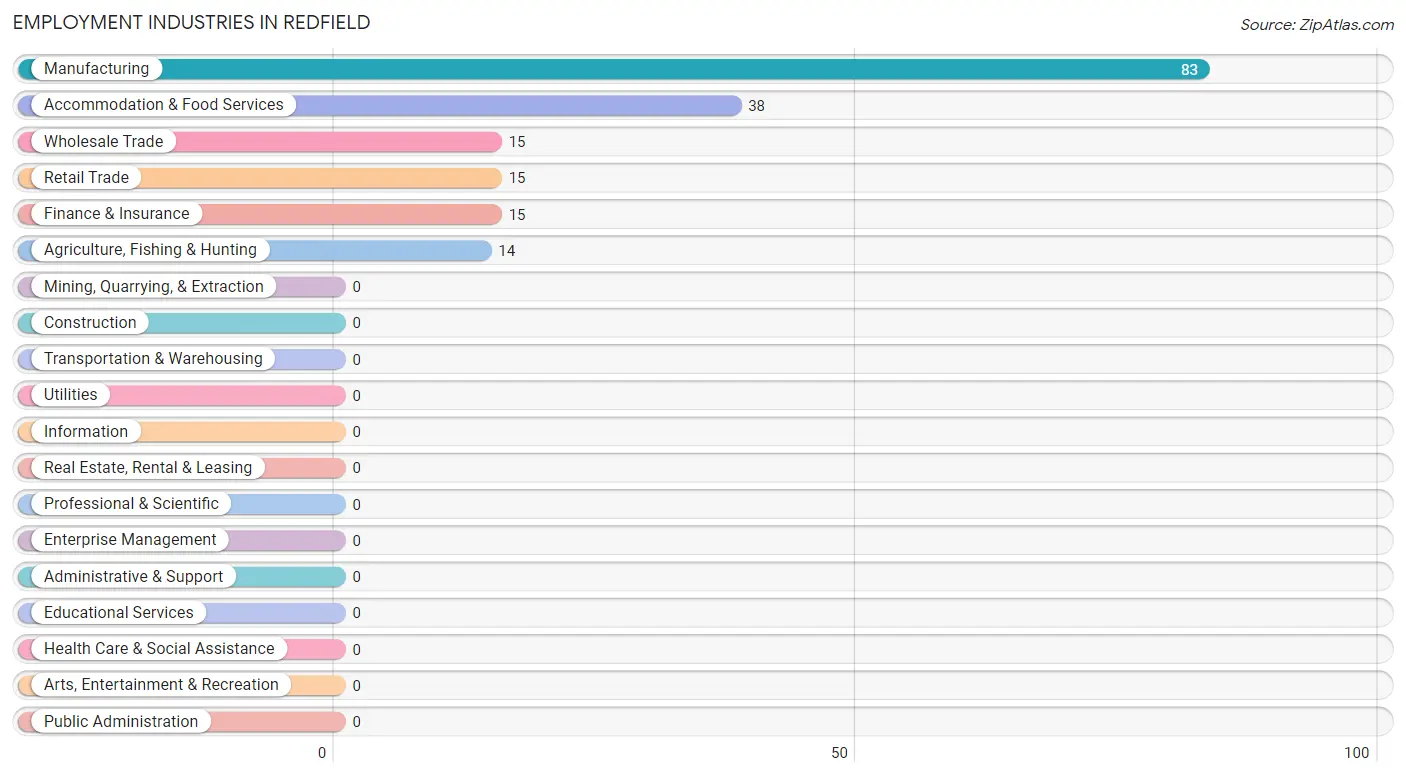
Employment Industries in Redfield
The major employment industries in Redfield include Manufacturing (83 | 46.1%), Accommodation & Food Services (38 | 21.1%), Wholesale Trade (15 | 8.3%), Retail Trade (15 | 8.3%), and Finance & Insurance (15 | 8.3%).
Employment Industries by Sex in Redfield
The Redfield industries that see more men than women are Agriculture, Fishing & Hunting (100.0%), Wholesale Trade (100.0%), and Retail Trade (100.0%), whereas the industries that tend to have a higher number of women are Finance & Insurance (100.0%), Accommodation & Food Services (100.0%), and Manufacturing (51.8%).
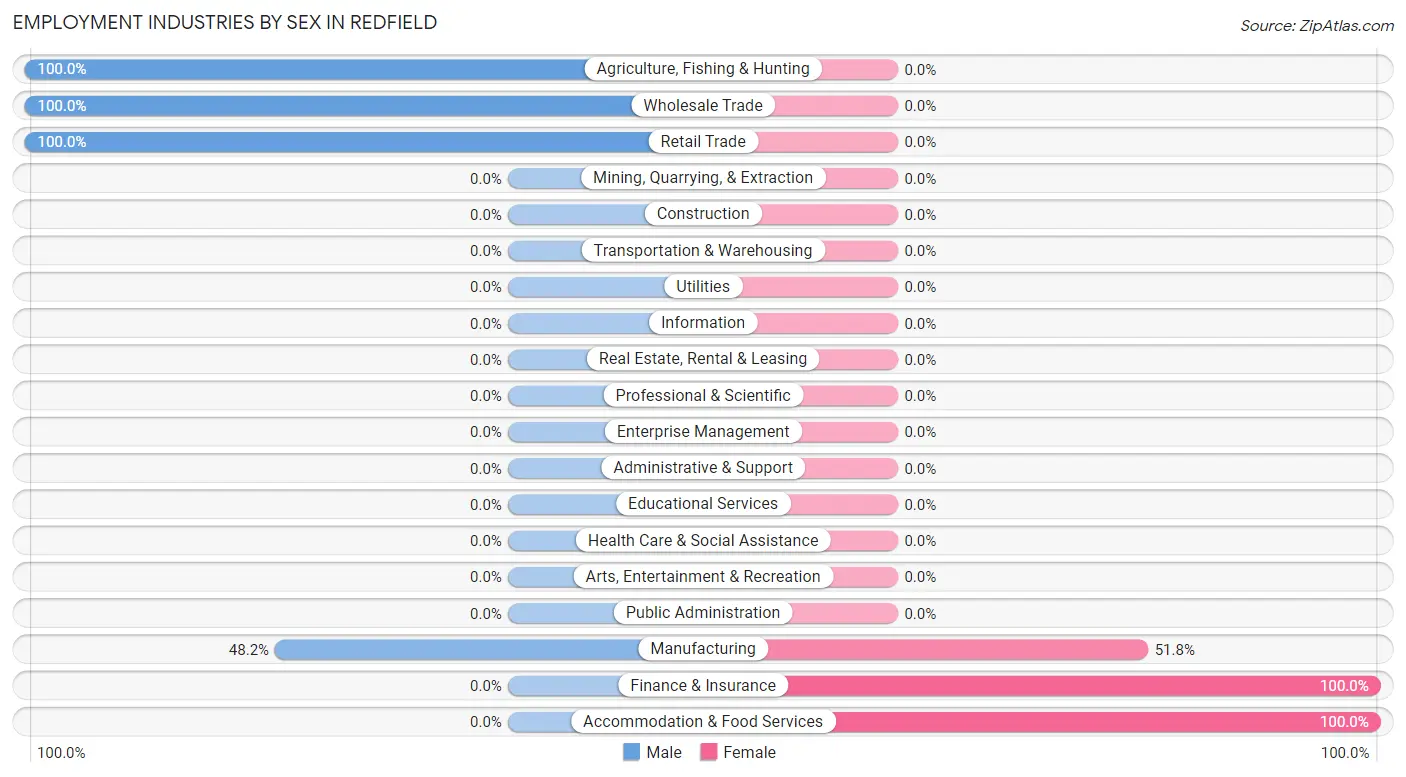
| Industry | Male | Female |
| Agriculture, Fishing & Hunting | 14 (100.0%) | 0 (0.0%) |
| Mining, Quarrying, & Extraction | 0 (0.0%) | 0 (0.0%) |
| Construction | 0 (0.0%) | 0 (0.0%) |
| Manufacturing | 40 (48.2%) | 43 (51.8%) |
| Wholesale Trade | 15 (100.0%) | 0 (0.0%) |
| Retail Trade | 15 (100.0%) | 0 (0.0%) |
| Transportation & Warehousing | 0 (0.0%) | 0 (0.0%) |
| Utilities | 0 (0.0%) | 0 (0.0%) |
| Information | 0 (0.0%) | 0 (0.0%) |
| Finance & Insurance | 0 (0.0%) | 15 (100.0%) |
| Real Estate, Rental & Leasing | 0 (0.0%) | 0 (0.0%) |
| Professional & Scientific | 0 (0.0%) | 0 (0.0%) |
| Enterprise Management | 0 (0.0%) | 0 (0.0%) |
| Administrative & Support | 0 (0.0%) | 0 (0.0%) |
| Educational Services | 0 (0.0%) | 0 (0.0%) |
| Health Care & Social Assistance | 0 (0.0%) | 0 (0.0%) |
| Arts, Entertainment & Recreation | 0 (0.0%) | 0 (0.0%) |
| Accommodation & Food Services | 0 (0.0%) | 38 (100.0%) |
| Public Administration | 0 (0.0%) | 0 (0.0%) |
| Total | 84 (46.7%) | 96 (53.3%) |
Education in Redfield
School Enrollment in Redfield
The most common levels of schooling among the 88 students in Redfield are high school (52 | 59.1%), nursery / preschool (18 | 20.4%), and middle school (18 | 20.4%).
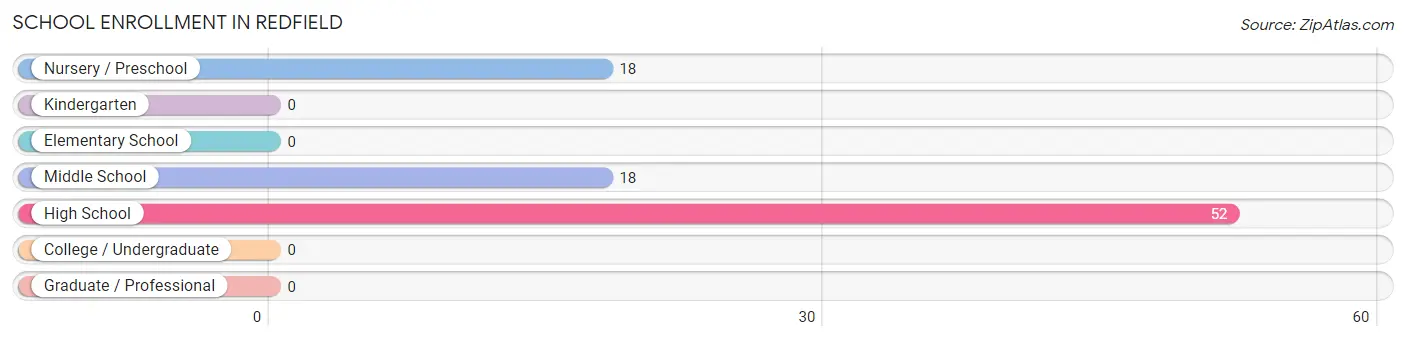
| School Level | # Students | % Students |
| Nursery / Preschool | 18 | 20.4% |
| Kindergarten | 0 | 0.0% |
| Elementary School | 0 | 0.0% |
| Middle School | 18 | 20.4% |
| High School | 52 | 59.1% |
| College / Undergraduate | 0 | 0.0% |
| Graduate / Professional | 0 | 0.0% |
| Total | 88 | 100.0% |
School Enrollment by Age by Funding Source in Redfield
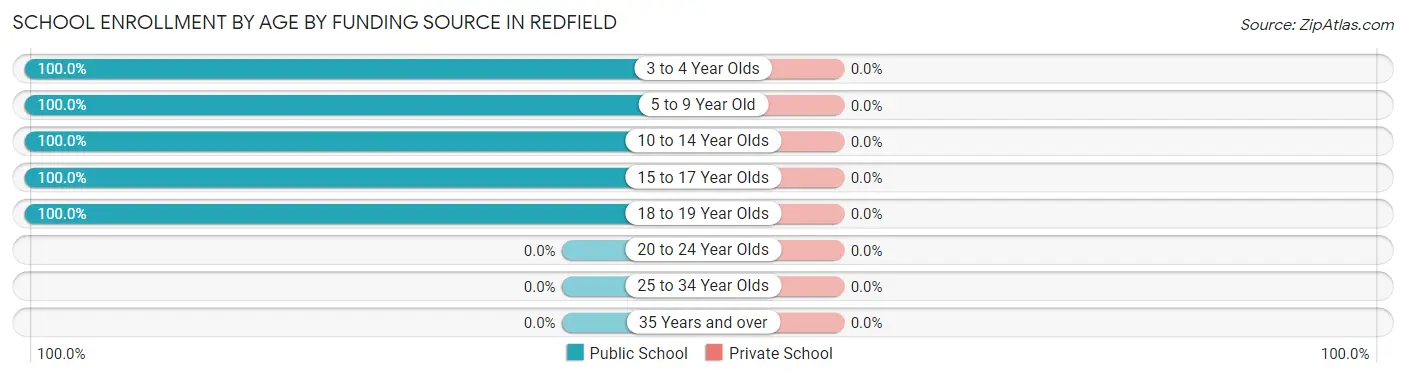
| Age Bracket | Public School | Private School |
| 3 to 4 Year Olds | 18 (100.0%) | 0 (0.0%) |
| 5 to 9 Year Old | 18 (100.0%) | 0 (0.0%) |
| 10 to 14 Year Olds | 34 (100.0%) | 0 (0.0%) |
| 15 to 17 Year Olds | 11 (100.0%) | 0 (0.0%) |
| 18 to 19 Year Olds | 7 (100.0%) | 0 (0.0%) |
| 20 to 24 Year Olds | 0 (0.0%) | 0 (0.0%) |
| 25 to 34 Year Olds | 0 (0.0%) | 0 (0.0%) |
| 35 Years and over | 0 (0.0%) | 0 (0.0%) |
| Total | 88 (100.0%) | 0 (0.0%) |
Educational Attainment by Field of Study in Redfield
Business (30 | 37.5%), visual & performing arts (20 | 25.0%), science & technology (15 | 18.8%), and education (15 | 18.8%) are the most common fields of study among 80 individuals in Redfield who have obtained a bachelor's degree or higher.
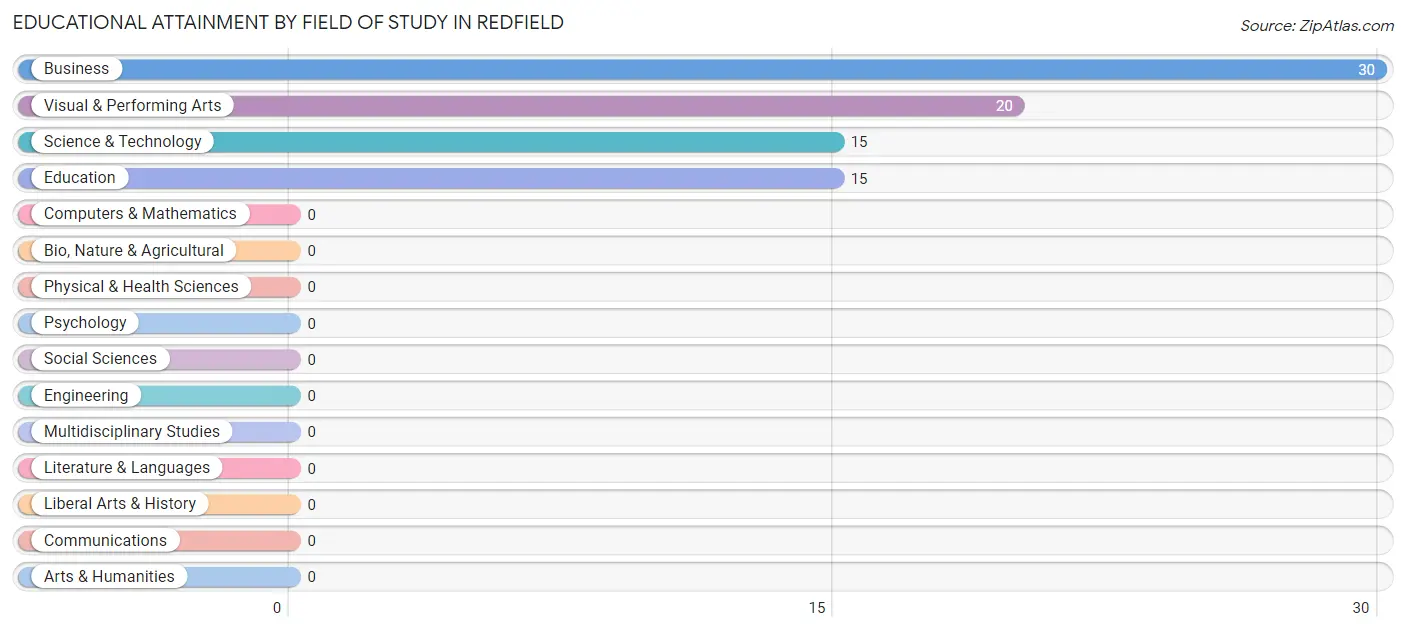
| Field of Study | # Graduates | % Graduates |
| Computers & Mathematics | 0 | 0.0% |
| Bio, Nature & Agricultural | 0 | 0.0% |
| Physical & Health Sciences | 0 | 0.0% |
| Psychology | 0 | 0.0% |
| Social Sciences | 0 | 0.0% |
| Engineering | 0 | 0.0% |
| Multidisciplinary Studies | 0 | 0.0% |
| Science & Technology | 15 | 18.8% |
| Business | 30 | 37.5% |
| Education | 15 | 18.8% |
| Literature & Languages | 0 | 0.0% |
| Liberal Arts & History | 0 | 0.0% |
| Visual & Performing Arts | 20 | 25.0% |
| Communications | 0 | 0.0% |
| Arts & Humanities | 0 | 0.0% |
| Total | 80 | 100.0% |
Transportation & Commute in Redfield
Vehicle Availability by Sex in Redfield
The most prevalent vehicle ownership categories in Redfield are males with 5 or more vehicles (40, accounting for 57.1%) and females with 5 or more vehicles (43, making up 41.7%).
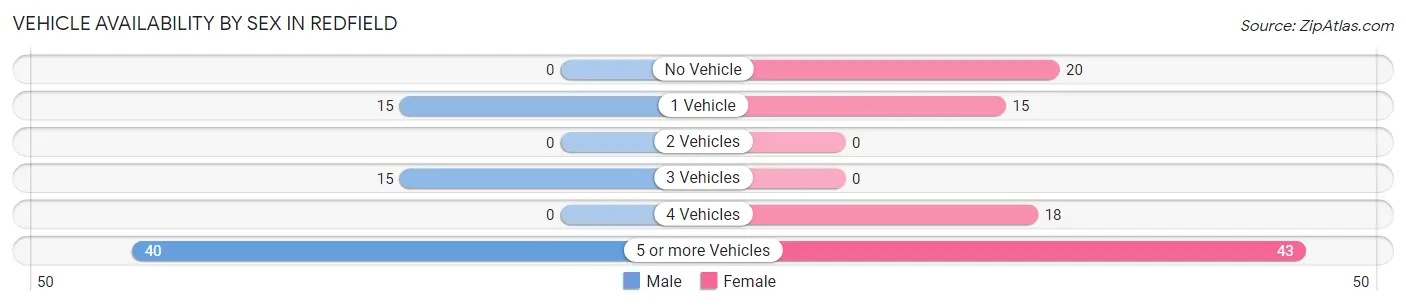
| Vehicles Available | Male | Female |
| No Vehicle | 0 (0.0%) | 20 (20.8%) |
| 1 Vehicle | 15 (21.4%) | 15 (15.6%) |
| 2 Vehicles | 0 (0.0%) | 0 (0.0%) |
| 3 Vehicles | 15 (21.4%) | 0 (0.0%) |
| 4 Vehicles | 0 (0.0%) | 18 (18.8%) |
| 5 or more Vehicles | 40 (57.1%) | 43 (44.8%) |
| Total | 70 (100.0%) | 96 (100.0%) |
Commute Time in Redfield
The most frequently occuring commute durations in Redfield are 10 to 14 minutes (83 commuters, 50.0%), 15 to 19 minutes (48 commuters, 28.9%), and 20 to 24 minutes (20 commuters, 12.0%).
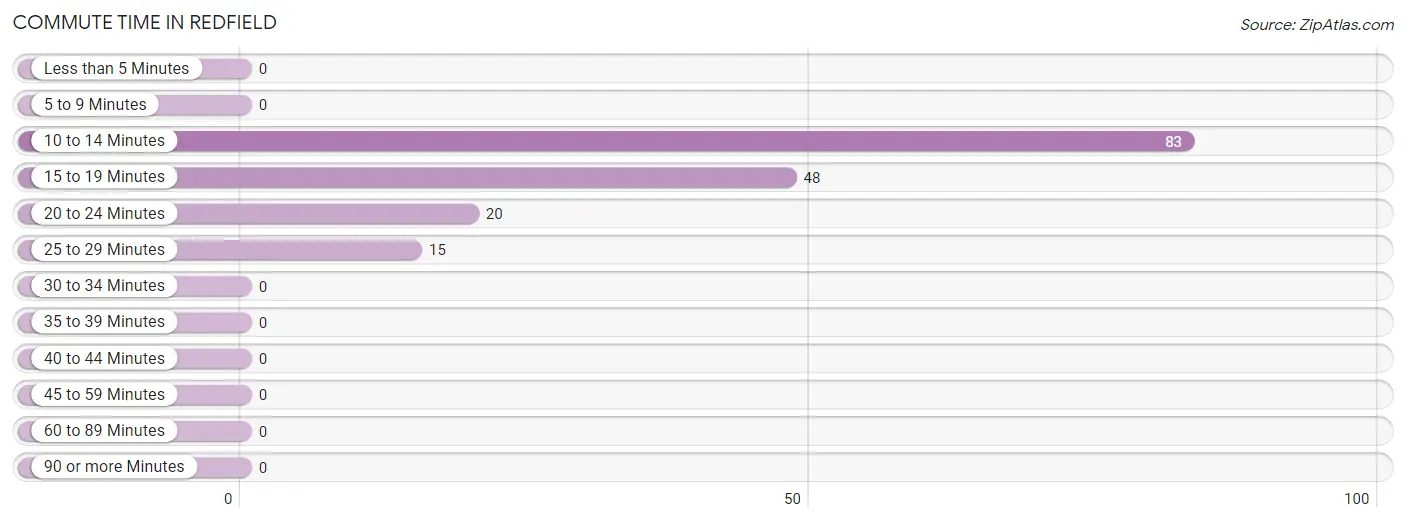
| Commute Time | # Commuters | % Commuters |
| Less than 5 Minutes | 0 | 0.0% |
| 5 to 9 Minutes | 0 | 0.0% |
| 10 to 14 Minutes | 83 | 50.0% |
| 15 to 19 Minutes | 48 | 28.9% |
| 20 to 24 Minutes | 20 | 12.0% |
| 25 to 29 Minutes | 15 | 9.0% |
| 30 to 34 Minutes | 0 | 0.0% |
| 35 to 39 Minutes | 0 | 0.0% |
| 40 to 44 Minutes | 0 | 0.0% |
| 45 to 59 Minutes | 0 | 0.0% |
| 60 to 89 Minutes | 0 | 0.0% |
| 90 or more Minutes | 0 | 0.0% |
Commute Time by Sex in Redfield
The most common commute times in Redfield are 10 to 14 minutes (40 commuters, 57.1%) for males and 10 to 14 minutes (43 commuters, 44.8%) for females.
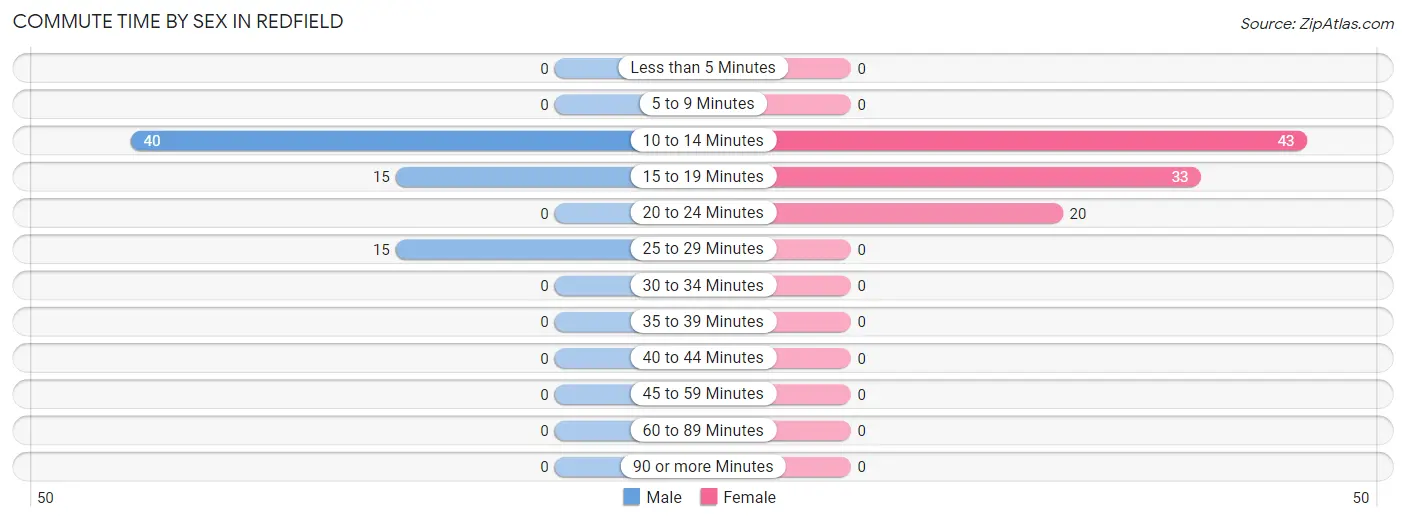
| Commute Time | Male | Female |
| Less than 5 Minutes | 0 (0.0%) | 0 (0.0%) |
| 5 to 9 Minutes | 0 (0.0%) | 0 (0.0%) |
| 10 to 14 Minutes | 40 (57.1%) | 43 (44.8%) |
| 15 to 19 Minutes | 15 (21.4%) | 33 (34.4%) |
| 20 to 24 Minutes | 0 (0.0%) | 20 (20.8%) |
| 25 to 29 Minutes | 15 (21.4%) | 0 (0.0%) |
| 30 to 34 Minutes | 0 (0.0%) | 0 (0.0%) |
| 35 to 39 Minutes | 0 (0.0%) | 0 (0.0%) |
| 40 to 44 Minutes | 0 (0.0%) | 0 (0.0%) |
| 45 to 59 Minutes | 0 (0.0%) | 0 (0.0%) |
| 60 to 89 Minutes | 0 (0.0%) | 0 (0.0%) |
| 90 or more Minutes | 0 (0.0%) | 0 (0.0%) |
Time of Departure to Work by Sex in Redfield
The most frequent times of departure to work in Redfield are 7:00 AM to 7:29 AM (55, 78.6%) for males and 8:00 AM to 8:29 AM (63, 65.6%) for females.
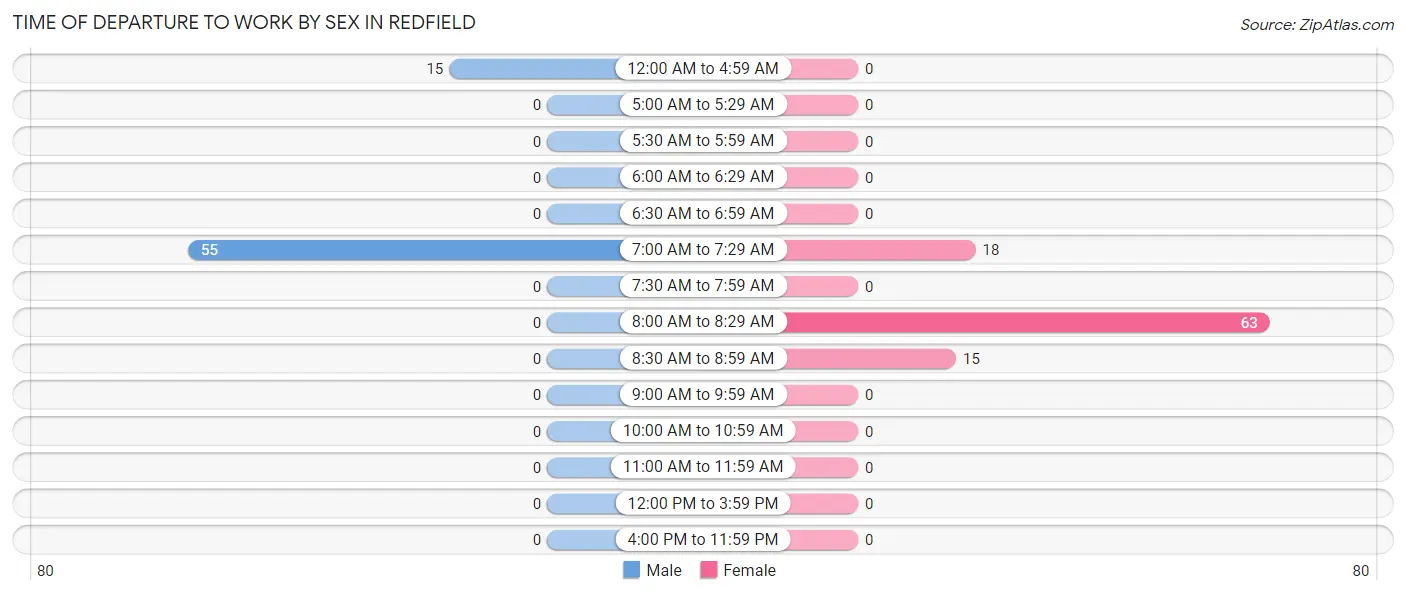
| Time of Departure | Male | Female |
| 12:00 AM to 4:59 AM | 15 (21.4%) | 0 (0.0%) |
| 5:00 AM to 5:29 AM | 0 (0.0%) | 0 (0.0%) |
| 5:30 AM to 5:59 AM | 0 (0.0%) | 0 (0.0%) |
| 6:00 AM to 6:29 AM | 0 (0.0%) | 0 (0.0%) |
| 6:30 AM to 6:59 AM | 0 (0.0%) | 0 (0.0%) |
| 7:00 AM to 7:29 AM | 55 (78.6%) | 18 (18.8%) |
| 7:30 AM to 7:59 AM | 0 (0.0%) | 0 (0.0%) |
| 8:00 AM to 8:29 AM | 0 (0.0%) | 63 (65.6%) |
| 8:30 AM to 8:59 AM | 0 (0.0%) | 15 (15.6%) |
| 9:00 AM to 9:59 AM | 0 (0.0%) | 0 (0.0%) |
| 10:00 AM to 10:59 AM | 0 (0.0%) | 0 (0.0%) |
| 11:00 AM to 11:59 AM | 0 (0.0%) | 0 (0.0%) |
| 12:00 PM to 3:59 PM | 0 (0.0%) | 0 (0.0%) |
| 4:00 PM to 11:59 PM | 0 (0.0%) | 0 (0.0%) |
| Total | 70 (100.0%) | 96 (100.0%) |
Housing Occupancy in Redfield
Occupancy by Ownership in Redfield
Of the total 118 dwellings in Redfield, owner-occupied units account for 98 (83.1%), while renter-occupied units make up 20 (17.0%).
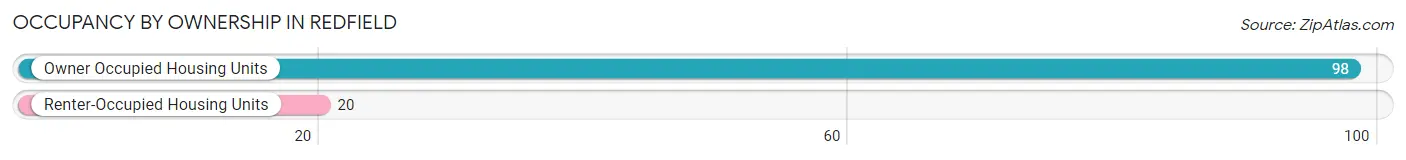
| Occupancy | # Housing Units | % Housing Units |
| Owner Occupied Housing Units | 98 | 83.1% |
| Renter-Occupied Housing Units | 20 | 17.0% |
| Total Occupied Housing Units | 118 | 100.0% |
Occupancy by Household Size in Redfield
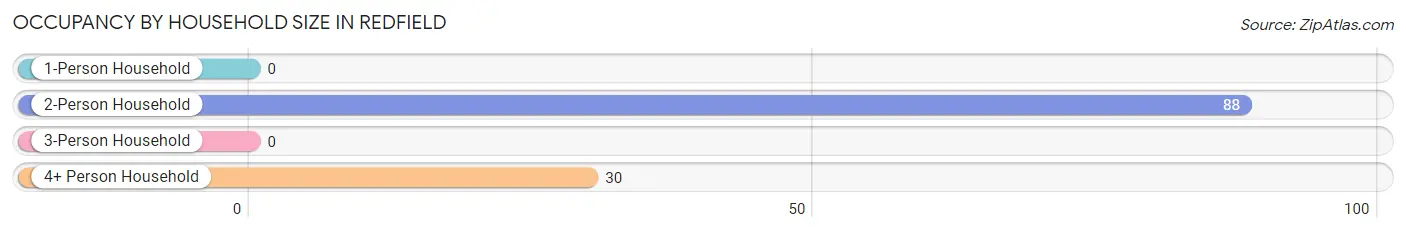
| Household Size | # Housing Units | % Housing Units |
| 1-Person Household | 0 | 0.0% |
| 2-Person Household | 88 | 74.6% |
| 3-Person Household | 0 | 0.0% |
| 4+ Person Household | 30 | 25.4% |
| Total Housing Units | 118 | 100.0% |
Occupancy by Ownership by Household Size in Redfield
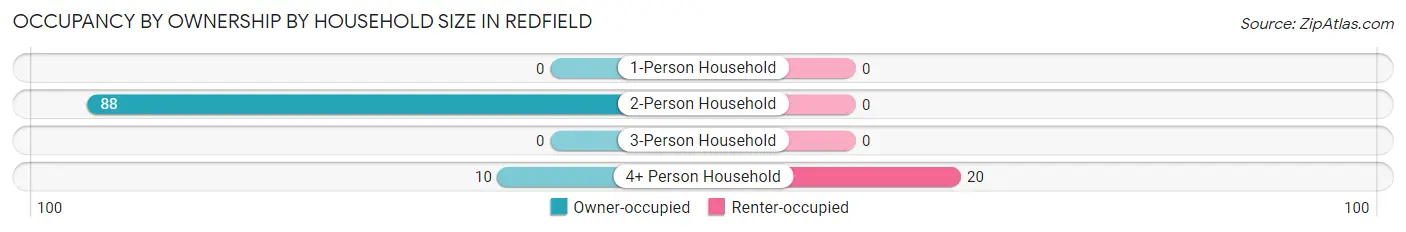
| Household Size | Owner-occupied | Renter-occupied |
| 1-Person Household | 0 (0.0%) | 0 (0.0%) |
| 2-Person Household | 88 (100.0%) | 0 (0.0%) |
| 3-Person Household | 0 (0.0%) | 0 (0.0%) |
| 4+ Person Household | 10 (33.3%) | 20 (66.7%) |
| Total Housing Units | 98 (83.1%) | 20 (17.0%) |
Occupancy by Educational Attainment in Redfield
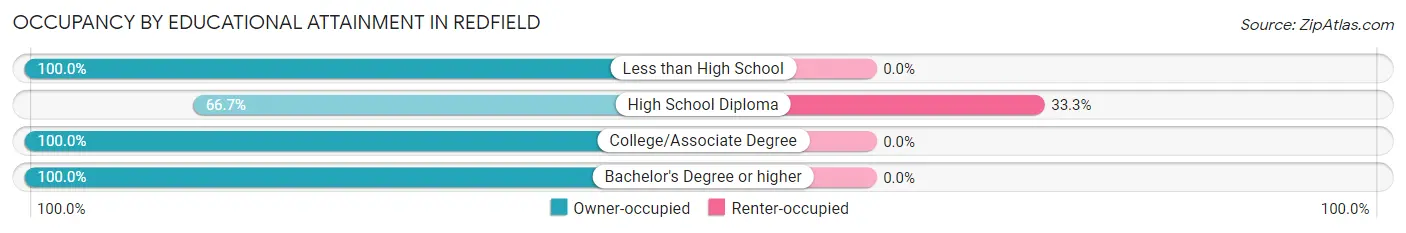
| Household Size | Owner-occupied | Renter-occupied |
| Less than High School | 10 (100.0%) | 0 (0.0%) |
| High School Diploma | 40 (66.7%) | 20 (33.3%) |
| College/Associate Degree | 18 (100.0%) | 0 (0.0%) |
| Bachelor's Degree or higher | 30 (100.0%) | 0 (0.0%) |
Occupancy by Age of Householder in Redfield
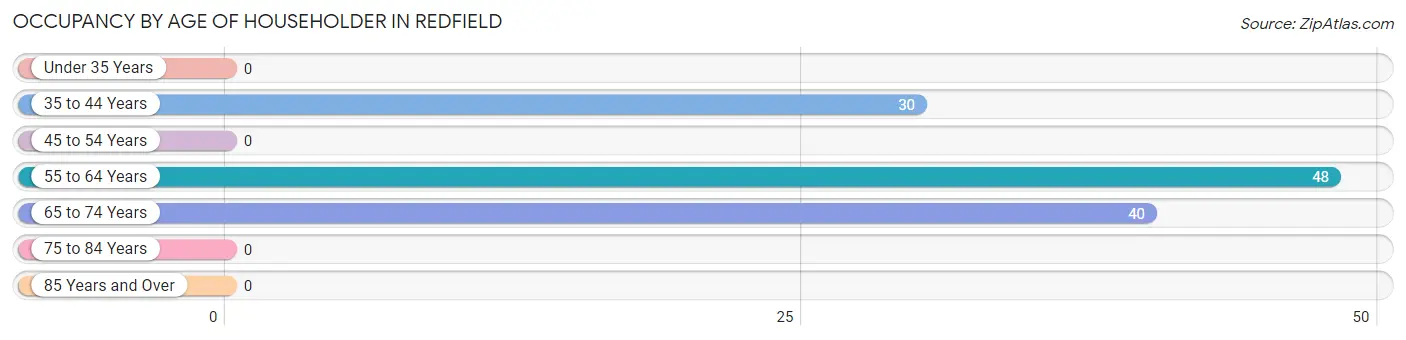
| Age Bracket | # Households | % Households |
| Under 35 Years | 0 | 0.0% |
| 35 to 44 Years | 30 | 25.4% |
| 45 to 54 Years | 0 | 0.0% |
| 55 to 64 Years | 48 | 40.7% |
| 65 to 74 Years | 40 | 33.9% |
| 75 to 84 Years | 0 | 0.0% |
| 85 Years and Over | 0 | 0.0% |
| Total | 118 | 100.0% |
Housing Finances in Redfield
Median Income by Occupancy in Redfield
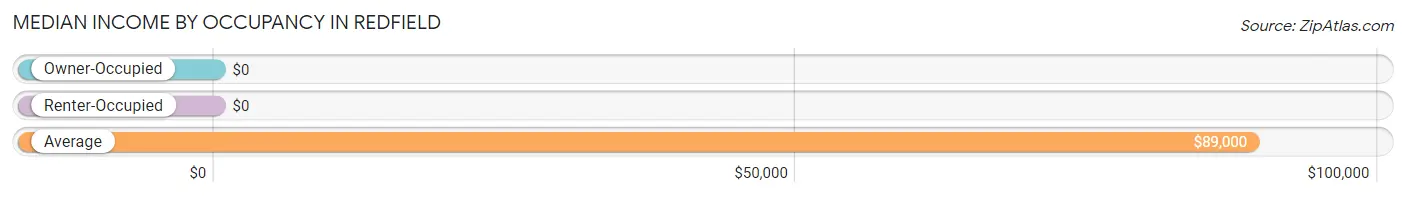
| Occupancy Type | # Households | Median Income |
| Owner-Occupied | 98 (83.1%) | $0 |
| Renter-Occupied | 20 (17.0%) | $0 |
| Average | 118 (100.0%) | $89,000 |
Occupancy by Householder Income Bracket in Redfield
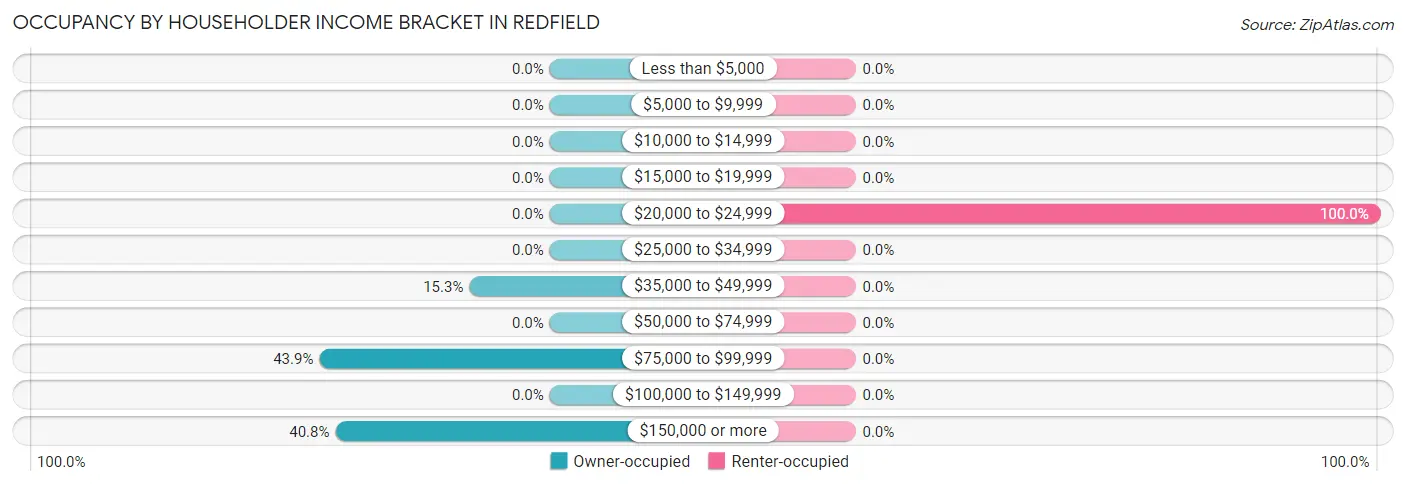
| Income Bracket | Owner-occupied | Renter-occupied |
| Less than $5,000 | 0 (0.0%) | 0 (0.0%) |
| $5,000 to $9,999 | 0 (0.0%) | 0 (0.0%) |
| $10,000 to $14,999 | 0 (0.0%) | 0 (0.0%) |
| $15,000 to $19,999 | 0 (0.0%) | 0 (0.0%) |
| $20,000 to $24,999 | 0 (0.0%) | 20 (100.0%) |
| $25,000 to $34,999 | 0 (0.0%) | 0 (0.0%) |
| $35,000 to $49,999 | 15 (15.3%) | 0 (0.0%) |
| $50,000 to $74,999 | 0 (0.0%) | 0 (0.0%) |
| $75,000 to $99,999 | 43 (43.9%) | 0 (0.0%) |
| $100,000 to $149,999 | 0 (0.0%) | 0 (0.0%) |
| $150,000 or more | 40 (40.8%) | 0 (0.0%) |
| Total | 98 (100.0%) | 20 (100.0%) |
Monthly Housing Cost Tiers in Redfield
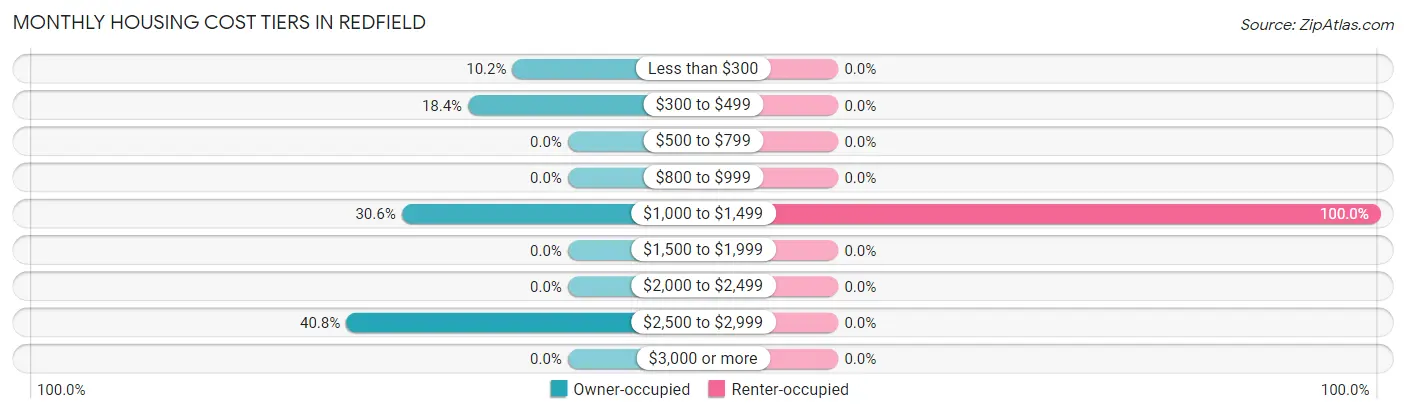
| Monthly Cost | Owner-occupied | Renter-occupied |
| Less than $300 | 10 (10.2%) | 0 (0.0%) |
| $300 to $499 | 18 (18.4%) | 0 (0.0%) |
| $500 to $799 | 0 (0.0%) | 0 (0.0%) |
| $800 to $999 | 0 (0.0%) | 0 (0.0%) |
| $1,000 to $1,499 | 30 (30.6%) | 20 (100.0%) |
| $1,500 to $1,999 | 0 (0.0%) | 0 (0.0%) |
| $2,000 to $2,499 | 0 (0.0%) | 0 (0.0%) |
| $2,500 to $2,999 | 40 (40.8%) | 0 (0.0%) |
| $3,000 or more | 0 (0.0%) | 0 (0.0%) |
| Total | 98 (100.0%) | 20 (100.0%) |
Physical Housing Characteristics in Redfield
Housing Structures in Redfield
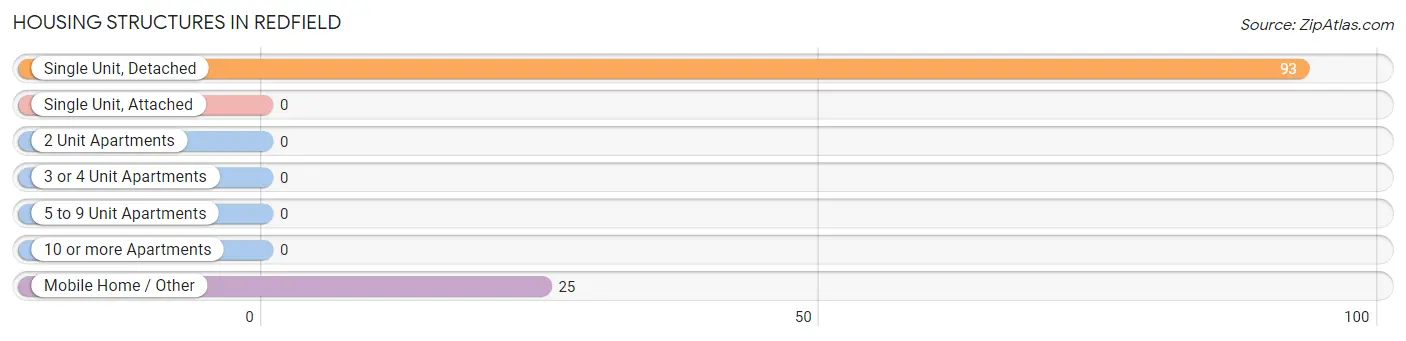
| Structure Type | # Housing Units | % Housing Units |
| Single Unit, Detached | 93 | 78.8% |
| Single Unit, Attached | 0 | 0.0% |
| 2 Unit Apartments | 0 | 0.0% |
| 3 or 4 Unit Apartments | 0 | 0.0% |
| 5 to 9 Unit Apartments | 0 | 0.0% |
| 10 or more Apartments | 0 | 0.0% |
| Mobile Home / Other | 25 | 21.2% |
| Total | 118 | 100.0% |
Housing Structures by Occupancy in Redfield
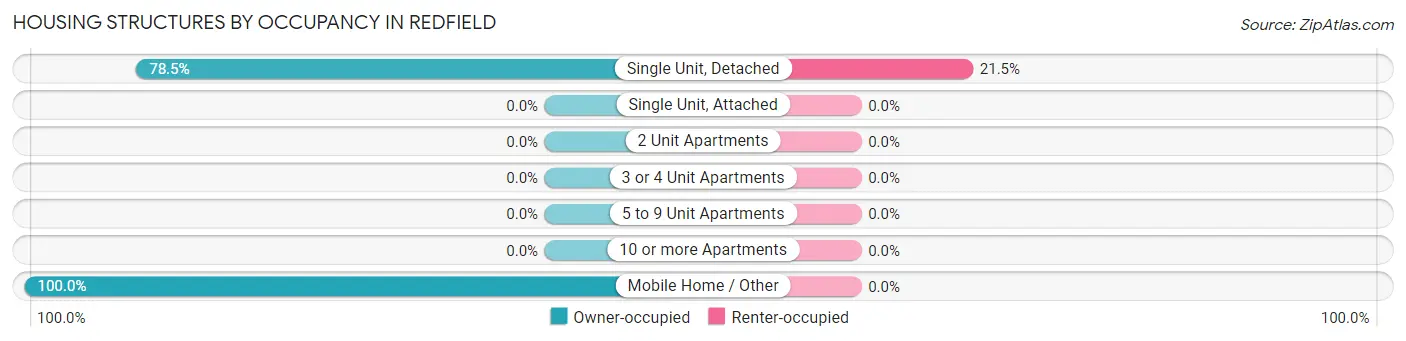
| Structure Type | Owner-occupied | Renter-occupied |
| Single Unit, Detached | 73 (78.5%) | 20 (21.5%) |
| Single Unit, Attached | 0 (0.0%) | 0 (0.0%) |
| 2 Unit Apartments | 0 (0.0%) | 0 (0.0%) |
| 3 or 4 Unit Apartments | 0 (0.0%) | 0 (0.0%) |
| 5 to 9 Unit Apartments | 0 (0.0%) | 0 (0.0%) |
| 10 or more Apartments | 0 (0.0%) | 0 (0.0%) |
| Mobile Home / Other | 25 (100.0%) | 0 (0.0%) |
| Total | 98 (83.1%) | 20 (17.0%) |
Housing Structures by Number of Rooms in Redfield
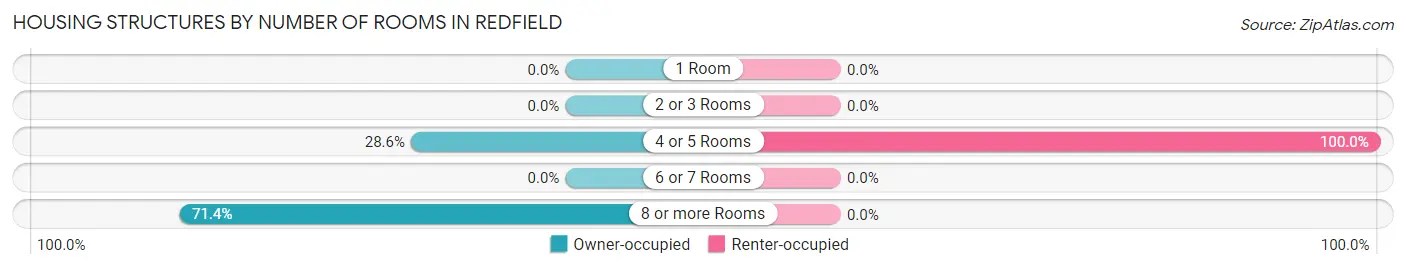
| Number of Rooms | Owner-occupied | Renter-occupied |
| 1 Room | 0 (0.0%) | 0 (0.0%) |
| 2 or 3 Rooms | 0 (0.0%) | 0 (0.0%) |
| 4 or 5 Rooms | 28 (28.6%) | 20 (100.0%) |
| 6 or 7 Rooms | 0 (0.0%) | 0 (0.0%) |
| 8 or more Rooms | 70 (71.4%) | 0 (0.0%) |
| Total | 98 (100.0%) | 20 (100.0%) |
Housing Structure by Heating Type in Redfield
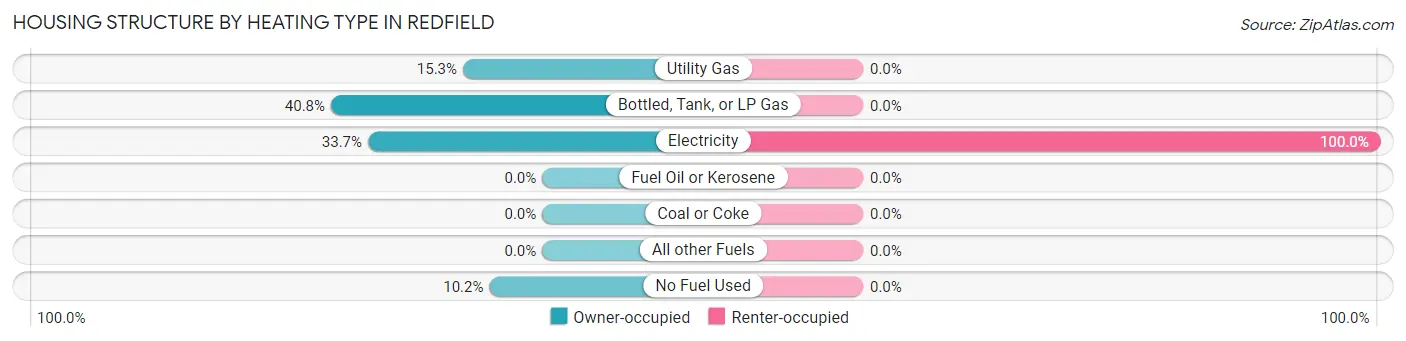
| Heating Type | Owner-occupied | Renter-occupied |
| Utility Gas | 15 (15.3%) | 0 (0.0%) |
| Bottled, Tank, or LP Gas | 40 (40.8%) | 0 (0.0%) |
| Electricity | 33 (33.7%) | 20 (100.0%) |
| Fuel Oil or Kerosene | 0 (0.0%) | 0 (0.0%) |
| Coal or Coke | 0 (0.0%) | 0 (0.0%) |
| All other Fuels | 0 (0.0%) | 0 (0.0%) |
| No Fuel Used | 10 (10.2%) | 0 (0.0%) |
| Total | 98 (100.0%) | 20 (100.0%) |
Household Vehicle Usage in Redfield
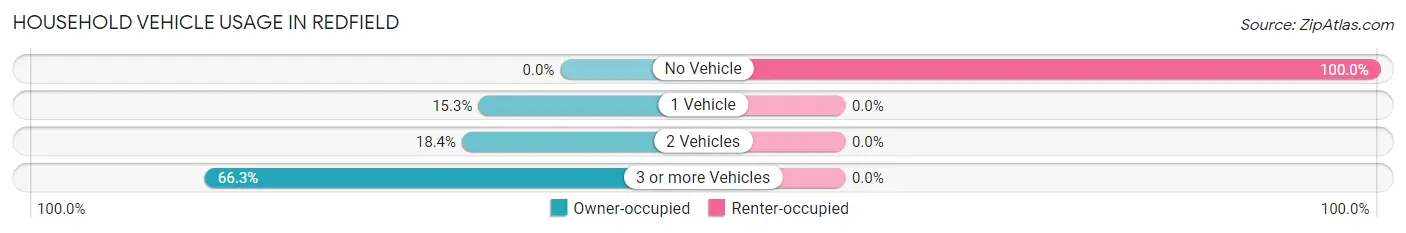
| Vehicles per Household | Owner-occupied | Renter-occupied |
| No Vehicle | 0 (0.0%) | 20 (100.0%) |
| 1 Vehicle | 15 (15.3%) | 0 (0.0%) |
| 2 Vehicles | 18 (18.4%) | 0 (0.0%) |
| 3 or more Vehicles | 65 (66.3%) | 0 (0.0%) |
| Total | 98 (100.0%) | 20 (100.0%) |
Real Estate & Mortgages in Redfield
Real Estate and Mortgage Overview in Redfield
| Characteristic | Without Mortgage | With Mortgage |
| Housing Units | 68 | 30 |
| Median Property Value | $2,000,001 | $0 |
| Median Household Income | $250,001 | $0 |
| Monthly Housing Costs | $1,501 | $0 |
| Real Estate Taxes | - | - |
Property Value by Mortgage Status in Redfield
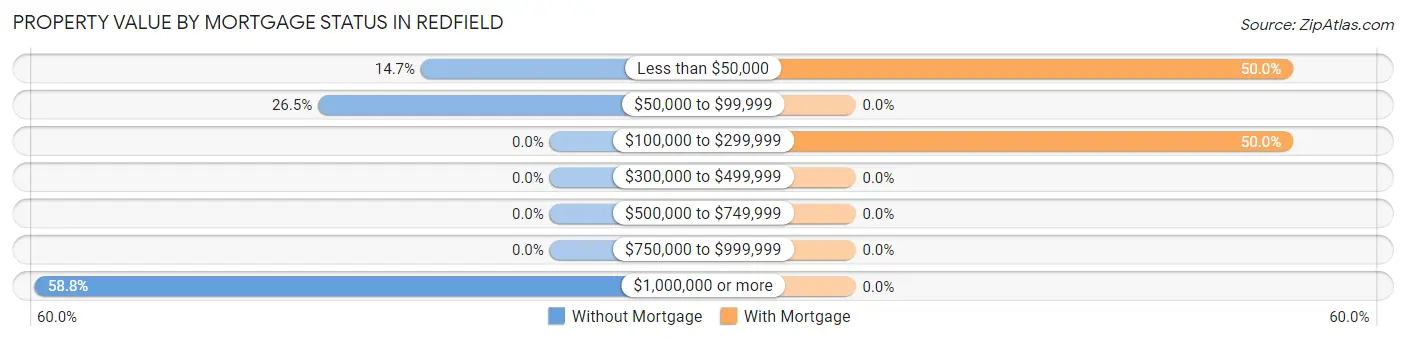
| Property Value | Without Mortgage | With Mortgage |
| Less than $50,000 | 10 (14.7%) | 15 (50.0%) |
| $50,000 to $99,999 | 18 (26.5%) | 0 (0.0%) |
| $100,000 to $299,999 | 0 (0.0%) | 15 (50.0%) |
| $300,000 to $499,999 | 0 (0.0%) | 0 (0.0%) |
| $500,000 to $749,999 | 0 (0.0%) | 0 (0.0%) |
| $750,000 to $999,999 | 0 (0.0%) | 0 (0.0%) |
| $1,000,000 or more | 40 (58.8%) | 0 (0.0%) |
| Total | 68 (100.0%) | 30 (100.0%) |
Household Income by Mortgage Status in Redfield
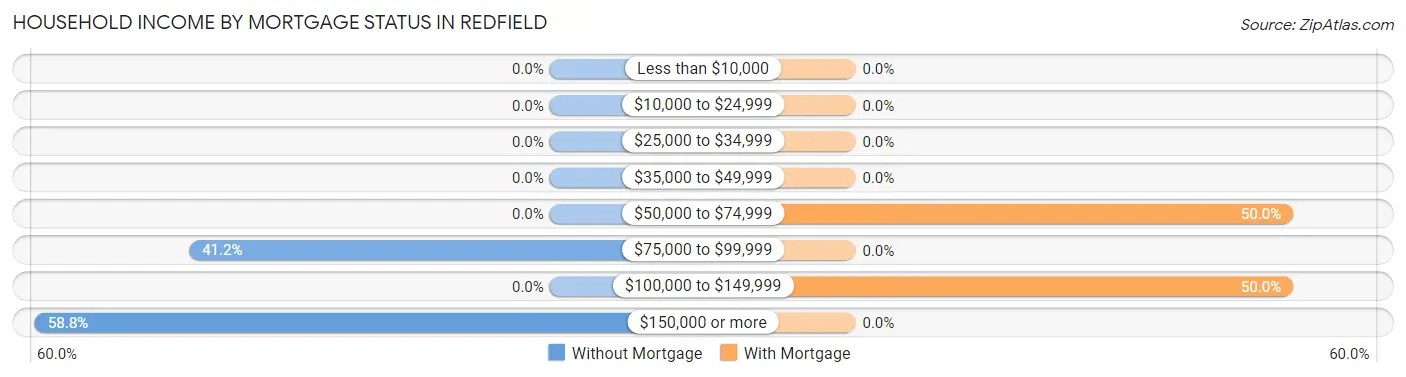
| Household Income | Without Mortgage | With Mortgage |
| Less than $10,000 | 0 (0.0%) | 0 (0.0%) |
| $10,000 to $24,999 | 0 (0.0%) | 0 (0.0%) |
| $25,000 to $34,999 | 0 (0.0%) | 0 (0.0%) |
| $35,000 to $49,999 | 0 (0.0%) | 0 (0.0%) |
| $50,000 to $74,999 | 0 (0.0%) | 15 (50.0%) |
| $75,000 to $99,999 | 28 (41.2%) | 0 (0.0%) |
| $100,000 to $149,999 | 0 (0.0%) | 15 (50.0%) |
| $150,000 or more | 40 (58.8%) | 0 (0.0%) |
| Total | 68 (100.0%) | 30 (100.0%) |
Property Value to Household Income Ratio in Redfield
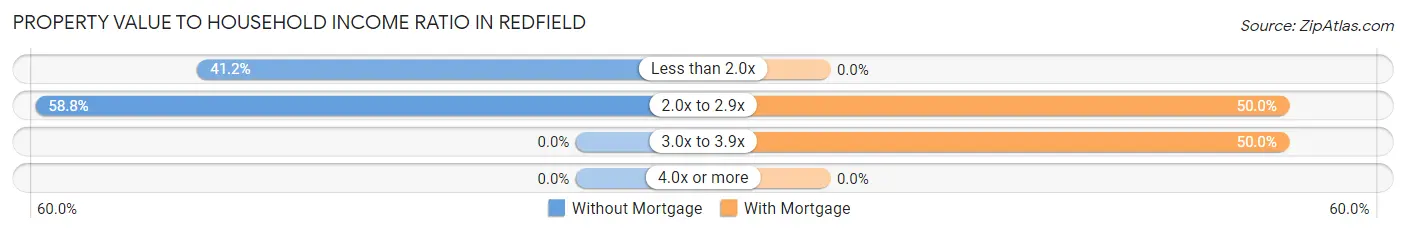
| Value-to-Income Ratio | Without Mortgage | With Mortgage |
| Less than 2.0x | 28 (41.2%) | 0 (0.0%) |
| 2.0x to 2.9x | 40 (58.8%) | 15 (50.0%) |
| 3.0x to 3.9x | 0 (0.0%) | 15 (50.0%) |
| 4.0x or more | 0 (0.0%) | 0 (0.0%) |
| Total | 68 (100.0%) | 30 (100.0%) |
Real Estate Taxes by Mortgage Status in Redfield
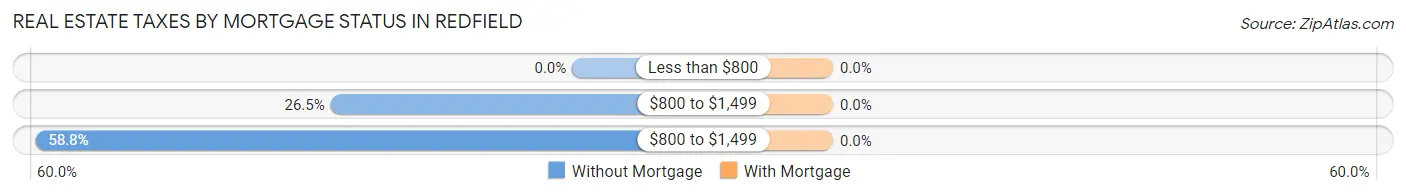
| Property Taxes | Without Mortgage | With Mortgage |
| Less than $800 | 0 (0.0%) | 0 (0.0%) |
| $800 to $1,499 | 18 (26.5%) | 0 (0.0%) |
| $800 to $1,499 | 40 (58.8%) | 0 (0.0%) |
| Total | 68 (100.0%) | 30 (100.0%) |
Health & Disability in Redfield
Health Insurance Coverage by Age in Redfield
| Age Bracket | With Coverage | Without Coverage |
| Under 6 Years | 36 (100.0%) | 0 (0.0%) |
| 6 to 18 Years | 52 (74.3%) | 18 (25.7%) |
| 19 to 25 Years | 0 (0.0%) | 8 (100.0%) |
| 26 to 34 Years | 0 (0.0%) | 0 (0.0%) |
| 35 to 44 Years | 0 (0.0%) | 44 (100.0%) |
| 45 to 54 Years | 0 (0.0%) | 0 (0.0%) |
| 55 to 64 Years | 141 (100.0%) | 0 (0.0%) |
| 65 to 74 Years | 40 (100.0%) | 0 (0.0%) |
| 75 Years and older | 0 (0.0%) | 0 (0.0%) |
| Total | 269 (79.3%) | 70 (20.6%) |
Health Insurance Coverage by Citizenship Status in Redfield
| Citizenship Status | With Coverage | Without Coverage |
| Native Born | 36 (100.0%) | 0 (0.0%) |
| Foreign Born, Citizen | 52 (74.3%) | 18 (25.7%) |
| Foreign Born, not a Citizen | 0 (0.0%) | 8 (100.0%) |
Health Insurance Coverage by Household Income in Redfield
| Household Income | With Coverage | Without Coverage |
| Under $25,000 | 72 (78.3%) | 20 (21.7%) |
| $25,000 to $49,999 | 30 (100.0%) | 0 (0.0%) |
| $50,000 to $74,999 | 0 (0.0%) | 0 (0.0%) |
| $75,000 to $99,999 | 84 (62.7%) | 50 (37.3%) |
| $100,000 and over | 83 (100.0%) | 0 (0.0%) |
Public vs Private Health Insurance Coverage by Age in Redfield
| Age Bracket | Public Insurance | Private Insurance |
| Under 6 | 36 (100.0%) | 0 (0.0%) |
| 6 to 18 Years | 52 (74.3%) | 0 (0.0%) |
| 19 to 25 Years | 0 (0.0%) | 0 (0.0%) |
| 25 to 34 Years | 0 (0.0%) | 0 (0.0%) |
| 35 to 44 Years | 0 (0.0%) | 0 (0.0%) |
| 45 to 54 Years | 0 (0.0%) | 0 (0.0%) |
| 55 to 64 Years | 0 (0.0%) | 141 (100.0%) |
| 65 to 74 Years | 0 (0.0%) | 40 (100.0%) |
| 75 Years and over | 0 (0.0%) | 0 (0.0%) |
| Total | 88 (26.0%) | 181 (53.4%) |
Disability Status by Sex by Age in Redfield
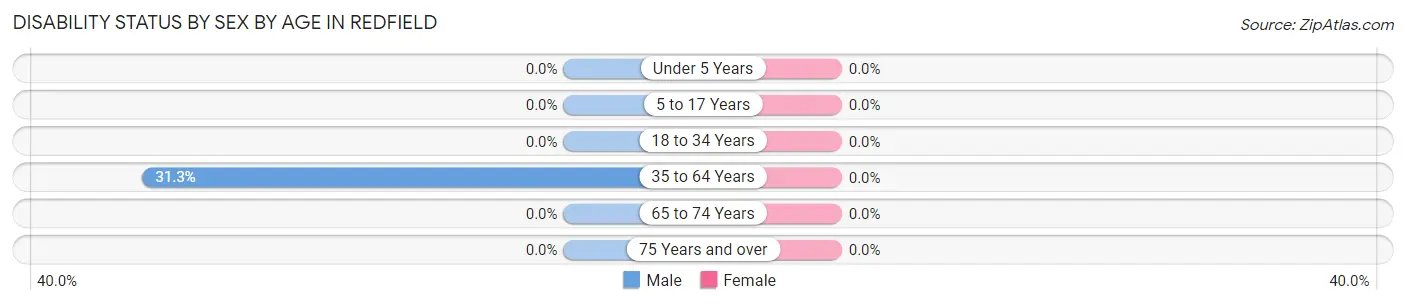
| Age Bracket | Male | Female |
| Under 5 Years | 0 (0.0%) | 0 (0.0%) |
| 5 to 17 Years | 0 (0.0%) | 0 (0.0%) |
| 18 to 34 Years | 0 (0.0%) | 0 (0.0%) |
| 35 to 64 Years | 20 (31.2%) | 0 (0.0%) |
| 65 to 74 Years | 0 (0.0%) | 0 (0.0%) |
| 75 Years and over | 0 (0.0%) | 0 (0.0%) |
Disability Class by Sex by Age in Redfield
Disability Class: Hearing Difficulty
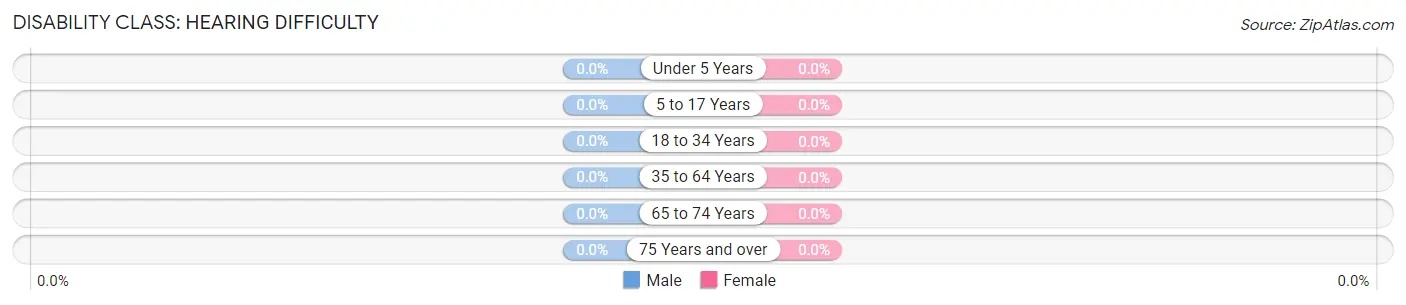
| Age Bracket | Male | Female |
| Under 5 Years | 0 (0.0%) | 0 (0.0%) |
| 5 to 17 Years | 0 (0.0%) | 0 (0.0%) |
| 18 to 34 Years | 0 (0.0%) | 0 (0.0%) |
| 35 to 64 Years | 0 (0.0%) | 0 (0.0%) |
| 65 to 74 Years | 0 (0.0%) | 0 (0.0%) |
| 75 Years and over | 0 (0.0%) | 0 (0.0%) |
Disability Class: Vision Difficulty
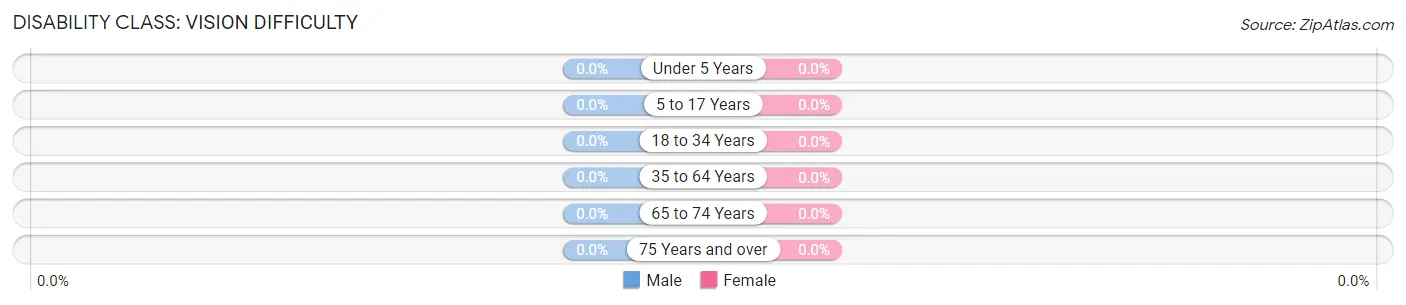
| Age Bracket | Male | Female |
| Under 5 Years | 0 (0.0%) | 0 (0.0%) |
| 5 to 17 Years | 0 (0.0%) | 0 (0.0%) |
| 18 to 34 Years | 0 (0.0%) | 0 (0.0%) |
| 35 to 64 Years | 0 (0.0%) | 0 (0.0%) |
| 65 to 74 Years | 0 (0.0%) | 0 (0.0%) |
| 75 Years and over | 0 (0.0%) | 0 (0.0%) |
Disability Class: Cognitive Difficulty
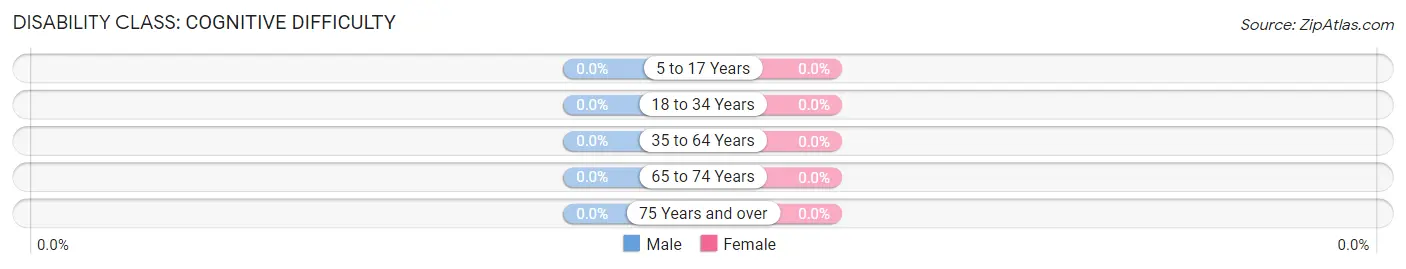
| Age Bracket | Male | Female |
| 5 to 17 Years | 0 (0.0%) | 0 (0.0%) |
| 18 to 34 Years | 0 (0.0%) | 0 (0.0%) |
| 35 to 64 Years | 0 (0.0%) | 0 (0.0%) |
| 65 to 74 Years | 0 (0.0%) | 0 (0.0%) |
| 75 Years and over | 0 (0.0%) | 0 (0.0%) |
Disability Class: Ambulatory Difficulty
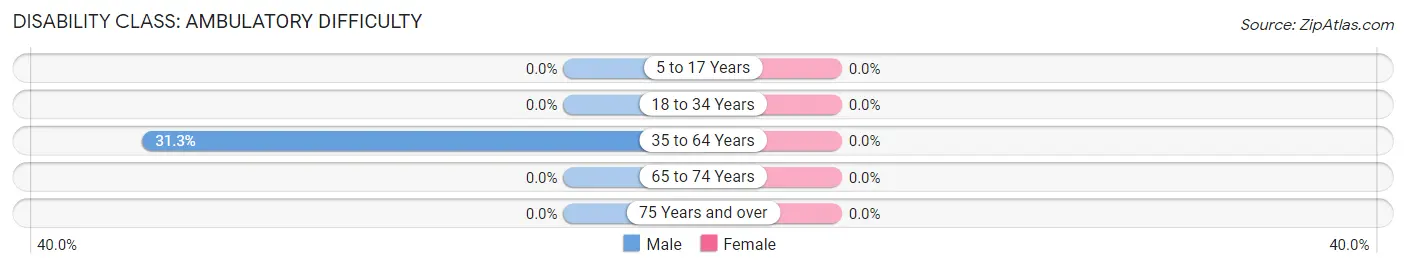
| Age Bracket | Male | Female |
| 5 to 17 Years | 0 (0.0%) | 0 (0.0%) |
| 18 to 34 Years | 0 (0.0%) | 0 (0.0%) |
| 35 to 64 Years | 20 (31.2%) | 0 (0.0%) |
| 65 to 74 Years | 0 (0.0%) | 0 (0.0%) |
| 75 Years and over | 0 (0.0%) | 0 (0.0%) |
Disability Class: Self-Care Difficulty
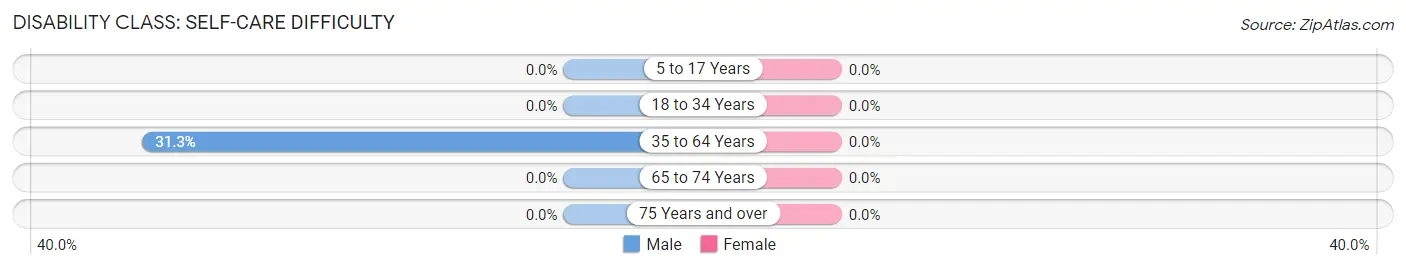
| Age Bracket | Male | Female |
| 5 to 17 Years | 0 (0.0%) | 0 (0.0%) |
| 18 to 34 Years | 0 (0.0%) | 0 (0.0%) |
| 35 to 64 Years | 20 (31.2%) | 0 (0.0%) |
| 65 to 74 Years | 0 (0.0%) | 0 (0.0%) |
| 75 Years and over | 0 (0.0%) | 0 (0.0%) |
Technology Access in Redfield
Computing Device Access in Redfield
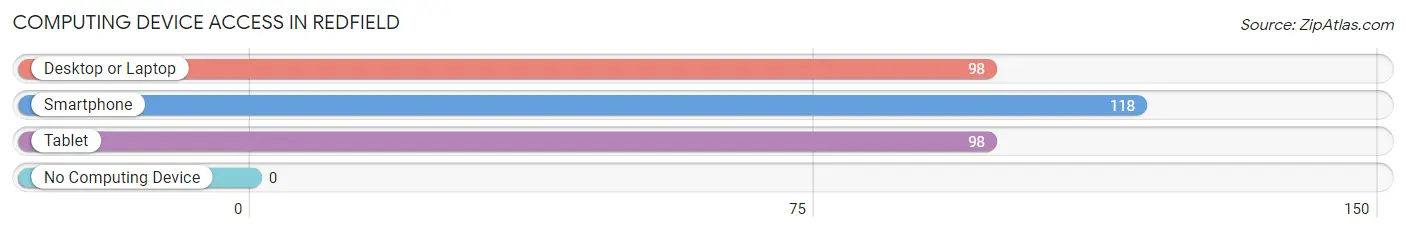
| Device Type | # Households | % Households |
| Desktop or Laptop | 98 | 83.1% |
| Smartphone | 118 | 100.0% |
| Tablet | 98 | 83.1% |
| No Computing Device | 0 | 0.0% |
| Total | 118 | 100.0% |
Internet Access in Redfield
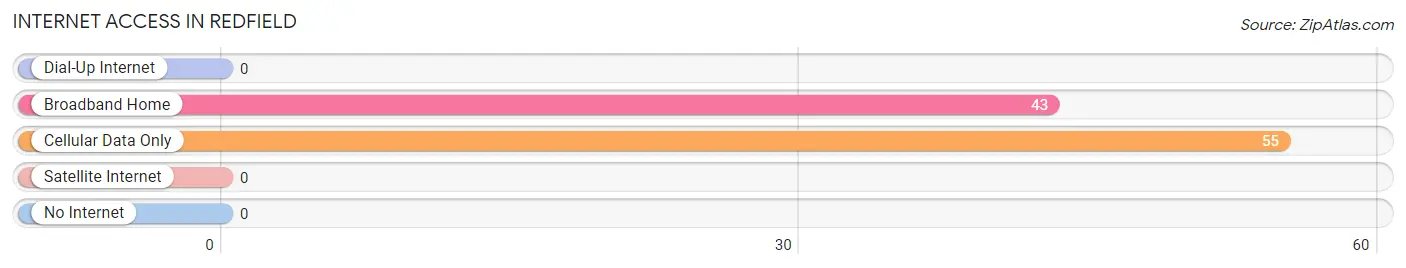
| Internet Type | # Households | % Households |
| Dial-Up Internet | 0 | 0.0% |
| Broadband Home | 43 | 36.4% |
| Cellular Data Only | 55 | 46.6% |
| Satellite Internet | 0 | 0.0% |
| No Internet | 0 | 0.0% |
| Total | 118 | 100.0% |
Redfield Summary
Redfield is a small town located in the state of Texas, in the United States. It is situated in the county of Jefferson, and is part of the Beaumont–Port Arthur Metropolitan Statistical Area. The town has a population of approximately 1,000 people, and is located about 25 miles east of Beaumont.
History
The area that is now Redfield was first settled in the late 1800s by a group of settlers from Louisiana. The town was originally known as “Redfield’s Switch”, named after the railroad switch that was located there. The town was officially incorporated in 1891, and the name was changed to Redfield.
In the early 1900s, the town was a thriving agricultural community, with cotton, corn, and other crops being grown in the area. The town also had a number of businesses, including a general store, a blacksmith shop, and a hotel.
In the 1920s, the town began to decline, as the railroad switch was moved to nearby Port Arthur. The town’s population began to decline, and by the 1940s, the town had become a virtual ghost town.
In the 1950s, the town began to experience a resurgence, as the oil industry began to boom in the area. The town’s population began to grow, and by the 1970s, the town had become a thriving community once again.
Geography
Redfield is located in the southeastern part of Jefferson County, in the state of Texas. The town is situated about 25 miles east of Beaumont, and is located on the banks of the Neches River. The town is surrounded by a number of small towns and communities, including Port Neches, Nederland, and Port Arthur.
The town has a total area of 1.2 square miles, all of which is land. The town is located at an elevation of about 30 feet above sea level.
Economy
The economy of Redfield is largely based on the oil and gas industry. The town is home to a number of oil and gas companies, as well as a number of related businesses. The town is also home to a number of small businesses, including restaurants, retail stores, and other services.
The town is also home to a number of manufacturing companies, including a paper mill and a chemical plant. The town is also home to a number of agricultural businesses, including farms and ranches.
Demographics
As of the 2010 census, the population of Redfield was 1,000 people. The town has a population density of 833 people per square mile. The median age of the town’s population is 37.7 years, and the median household income is $37,500.
The town is predominantly white, with about 90% of the population being white. The town also has a small Hispanic population, with about 5% of the population being Hispanic. The town also has a small African American population, with about 2% of the population being African American.
Conclusion
Redfield is a small town located in the state of Texas, in the United States. The town has a population of approximately 1,000 people, and is located about 25 miles east of Beaumont. The town’s economy is largely based on the oil and gas industry, and the town is also home to a number of small businesses, manufacturing companies, and agricultural businesses. The town is predominantly white, with about 90% of the population being white. The town also has a small Hispanic population, with about 5% of the population being Hispanic, and a small African American population, with about 2% of the population being African American.
Common Questions
What is the Total Population of Redfield?
Total Population of Redfield is 339.
What is the Total Male Population of Redfield?
Total Male Population of Redfield is 181.
What is the Total Female Population of Redfield?
Total Female Population of Redfield is 158.
What is the Ratio of Males per 100 Females in Redfield?
There are 114.56 Males per 100 Females in Redfield.
What is the Ratio of Females per 100 Males in Redfield?
There are 87.29 Females per 100 Males in Redfield.
What is the Median Population Age in Redfield?
Median Population Age in Redfield is 57.6 Years.
What is the Average Family Size in Redfield
Average Family Size in Redfield is 2.9 People.
What is the Average Household Size in Redfield
Average Household Size in Redfield is 2.9 People.
What is Per Capita Income in Redfield?
Per Capita income in Redfield is $136,814.
What is the Median Family Income in Redfield?
Median Family Income in Redfield is $89,000.
What is the Median Household income in Redfield?
Median Household Income in Redfield is $89,000.
What is Inequality or Gini Index in Redfield?
Inequality or Gini Index in Redfield is 0.56.
How Large is the Labor Force in Redfield?
There are 187 People in the Labor Forcein in Redfield.
What is the Percentage of People in the Labor Force in Redfield?
74.5% of People are in the Labor Force in Redfield.
What is the Unemployment Rate in Redfield?
Unemployment Rate in Redfield is 3.7%.