Cities with the Highest Percentage of Population with a Degree in Visual and Performing Arts in Kansas
RELATED REPORTS & OPTIONS
Visual and Performing Arts
Kansas
Compare Cities
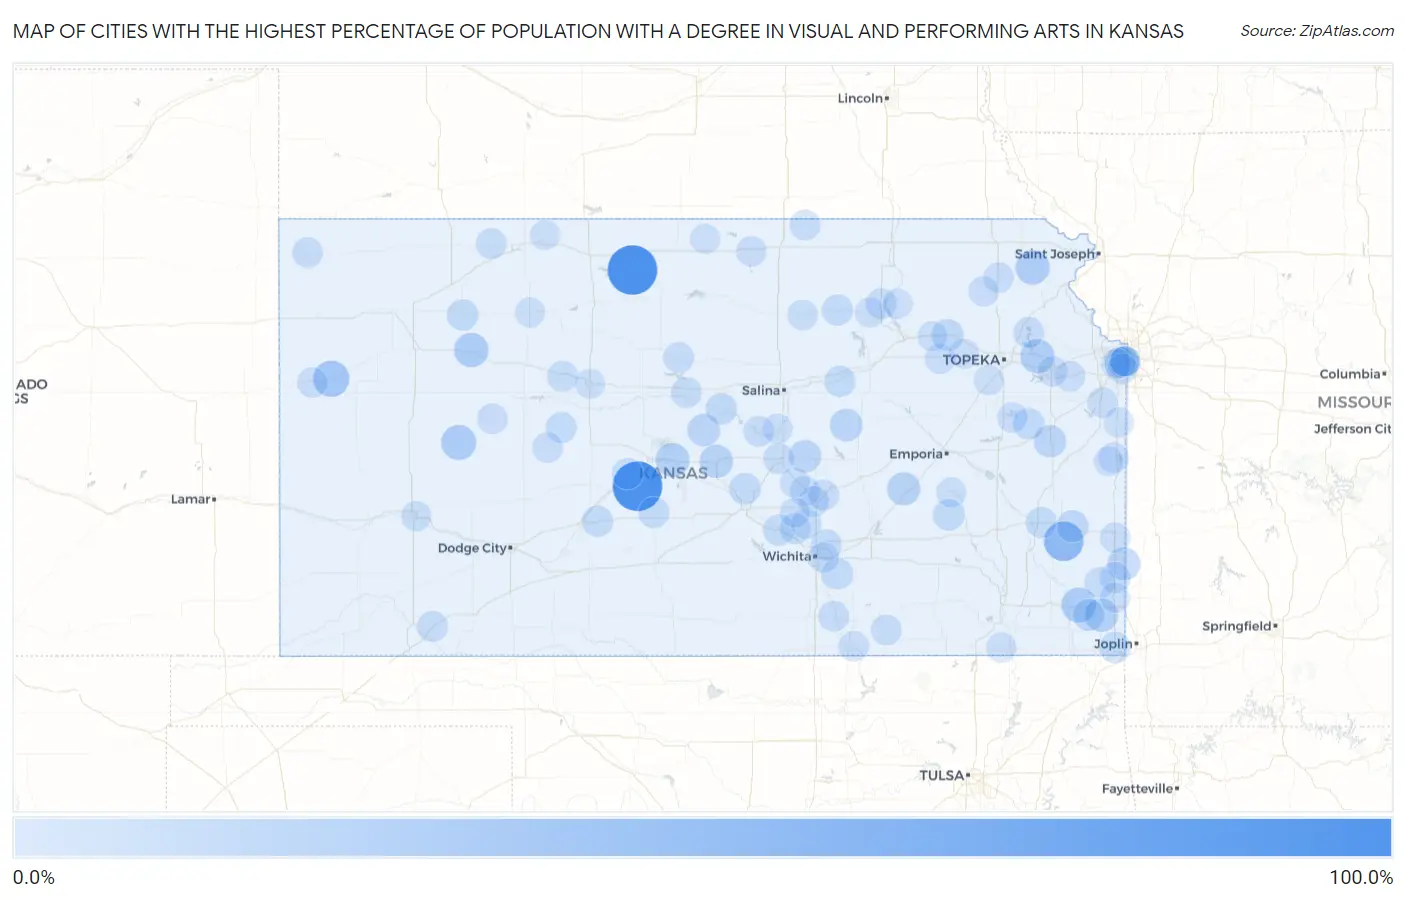
Map of Cities with the Highest Percentage of Population with a Degree in Visual and Performing Arts in Kansas
0.0%
100.0%
Cities with the Highest Percentage of Population with a Degree in Visual and Performing Arts in Kansas
| City | % Graduates | vs State | vs National | |
| 1. | Murdock | 100.0% | 3.4%(+96.6)#1 | 4.3%(+95.7)#36 |
| 2. | Cedar | 100.0% | 3.4%(+96.6)#3 | 4.3%(+95.7)#44 |
| 3. | Radium | 100.0% | 3.4%(+96.6)#4 | 4.3%(+95.7)#45 |
| 4. | Wabaunsee | 52.9% | 3.4%(+49.5)#5 | 4.3%(+48.7)#99 |
| 5. | Elsmore | 50.0% | 3.4%(+46.6)#6 | 4.3%(+45.7)#122 |
| 6. | Wallace | 33.3% | 3.4%(+29.9)#7 | 4.3%(+29.1)#271 |
| 7. | Dighton | 27.7% | 3.4%(+24.2)#8 | 4.3%(+23.4)#363 |
| 8. | Mccune | 27.3% | 3.4%(+23.9)#9 | 4.3%(+23.0)#371 |
| 9. | Park | 25.0% | 3.4%(+21.6)#10 | 4.3%(+20.7)#440 |
| 10. | Perry | 23.8% | 3.4%(+20.4)#11 | 4.3%(+19.5)#466 |
| 11. | Everest | 23.8% | 3.4%(+20.4)#12 | 4.3%(+19.5)#467 |
| 12. | Ellinwood | 22.8% | 3.4%(+19.4)#13 | 4.3%(+18.5)#495 |
| 13. | Scammon | 20.7% | 3.4%(+17.3)#14 | 4.3%(+16.4)#588 |
| 14. | Lyons | 19.9% | 3.4%(+16.5)#15 | 4.3%(+15.7)#645 |
| 15. | Matfield Green | 18.8% | 3.4%(+15.3)#16 | 4.3%(+14.5)#735 |
| 16. | Arcadia | 17.6% | 3.4%(+14.2)#17 | 4.3%(+13.4)#805 |
| 17. | Lorraine | 16.7% | 3.4%(+13.3)#18 | 4.3%(+12.4)#898 |
| 18. | Ramona | 16.7% | 3.4%(+13.3)#19 | 4.3%(+12.4)#905 |
| 19. | Canton | 16.3% | 3.4%(+12.9)#20 | 4.3%(+12.0)#932 |
| 20. | Princeton | 14.3% | 3.4%(+10.9)#21 | 4.3%(+10.0)#1,159 |
| 21. | Bronson | 13.5% | 3.4%(+10.1)#22 | 4.3%(+9.26)#1,263 |
| 22. | Belvue | 13.3% | 3.4%(+9.92)#23 | 4.3%(+9.08)#1,300 |
| 23. | West Mineral | 12.5% | 3.4%(+9.09)#24 | 4.3%(+8.25)#1,427 |
| 24. | The Highlands | 11.6% | 3.4%(+8.15)#25 | 4.3%(+7.31)#1,616 |
| 25. | Hamilton | 11.1% | 3.4%(+7.70)#26 | 4.3%(+6.86)#1,715 |
| 26. | Hoxie | 11.0% | 3.4%(+7.62)#27 | 4.3%(+6.78)#1,749 |
| 27. | Rose Hill | 10.9% | 3.4%(+7.51)#28 | 4.3%(+6.67)#1,768 |
| 28. | Kanopolis | 10.9% | 3.4%(+7.46)#29 | 4.3%(+6.62)#1,782 |
| 29. | Pomona | 10.5% | 3.4%(+7.11)#30 | 4.3%(+6.27)#1,885 |
| 30. | Enterprise | 10.2% | 3.4%(+6.76)#31 | 4.3%(+5.92)#2,008 |
| 31. | Pawnee Rock | 10.0% | 3.4%(+6.59)#32 | 4.3%(+5.75)#2,070 |
| 32. | Mount Hope | 9.8% | 3.4%(+6.36)#33 | 4.3%(+5.52)#2,144 |
| 33. | Lowell | 9.6% | 3.4%(+6.20)#34 | 4.3%(+5.36)#2,208 |
| 34. | Lewis | 9.5% | 3.4%(+6.11)#35 | 4.3%(+5.27)#2,237 |
| 35. | Gas | 9.5% | 3.4%(+6.05)#36 | 4.3%(+5.21)#2,263 |
| 36. | Clay Center | 9.4% | 3.4%(+5.99)#37 | 4.3%(+5.15)#2,284 |
| 37. | St John | 9.4% | 3.4%(+5.94)#38 | 4.3%(+5.10)#2,303 |
| 38. | Bel Aire | 9.2% | 3.4%(+5.80)#39 | 4.3%(+4.96)#2,349 |
| 39. | Mccracken | 9.1% | 3.4%(+5.68)#40 | 4.3%(+4.84)#2,424 |
| 40. | Arma | 8.8% | 3.4%(+5.35)#41 | 4.3%(+4.51)#2,569 |
| 41. | Girard | 8.7% | 3.4%(+5.25)#42 | 4.3%(+4.41)#2,621 |
| 42. | Bentley | 8.5% | 3.4%(+5.10)#43 | 4.3%(+4.26)#2,694 |
| 43. | Mcpherson | 8.5% | 3.4%(+5.08)#44 | 4.3%(+4.24)#2,701 |
| 44. | Kismet | 8.4% | 3.4%(+5.02)#45 | 4.3%(+4.18)#2,727 |
| 45. | Ellis | 8.3% | 3.4%(+4.90)#46 | 4.3%(+4.06)#2,809 |
| 46. | Roeland Park | 8.3% | 3.4%(+4.86)#47 | 4.3%(+4.02)#2,825 |
| 47. | Marquette | 8.2% | 3.4%(+4.81)#48 | 4.3%(+3.97)#2,859 |
| 48. | Lucas | 8.2% | 3.4%(+4.75)#49 | 4.3%(+3.91)#2,886 |
| 49. | Norcatur | 8.0% | 3.4%(+4.59)#50 | 4.3%(+3.75)#2,975 |
| 50. | Wilson | 8.0% | 3.4%(+4.55)#51 | 4.3%(+3.71)#2,996 |
| 51. | Fairway | 7.9% | 3.4%(+4.44)#52 | 4.3%(+3.60)#3,056 |
| 52. | Mission | 7.8% | 3.4%(+4.40)#53 | 4.3%(+3.57)#3,077 |
| 53. | Oxford | 7.8% | 3.4%(+4.37)#54 | 4.3%(+3.53)#3,100 |
| 54. | Ozawkie | 7.7% | 3.4%(+4.28)#55 | 4.3%(+3.44)#3,149 |
| 55. | Narka | 7.7% | 3.4%(+4.28)#56 | 4.3%(+3.44)#3,174 |
| 56. | St Francis | 7.6% | 3.4%(+4.21)#57 | 4.3%(+3.37)#3,215 |
| 57. | Dexter | 7.4% | 3.4%(+3.99)#58 | 4.3%(+3.16)#3,356 |
| 58. | Walton | 7.4% | 3.4%(+3.99)#59 | 4.3%(+3.16)#3,364 |
| 59. | Randolph | 7.4% | 3.4%(+3.99)#60 | 4.3%(+3.16)#3,368 |
| 60. | Hesston | 7.2% | 3.4%(+3.75)#61 | 4.3%(+2.91)#3,544 |
| 61. | Sharon Springs | 7.1% | 3.4%(+3.73)#62 | 4.3%(+2.89)#3,567 |
| 62. | Bazine | 7.0% | 3.4%(+3.56)#63 | 4.3%(+2.72)#3,730 |
| 63. | Eudora | 6.8% | 3.4%(+3.41)#64 | 4.3%(+2.57)#3,862 |
| 64. | Lawrence | 6.7% | 3.4%(+3.25)#65 | 4.3%(+2.42)#4,019 |
| 65. | Netawaka | 6.7% | 3.4%(+3.25)#66 | 4.3%(+2.41)#4,055 |
| 66. | Utica | 6.7% | 3.4%(+3.25)#67 | 4.3%(+2.41)#4,057 |
| 67. | Vassar | 6.6% | 3.4%(+3.21)#68 | 4.3%(+2.37)#4,093 |
| 68. | Linn Valley | 6.6% | 3.4%(+3.21)#69 | 4.3%(+2.37)#4,096 |
| 69. | North Newton | 6.6% | 3.4%(+3.18)#70 | 4.3%(+2.34)#4,118 |
| 70. | Westwood Hills | 6.6% | 3.4%(+3.17)#71 | 4.3%(+2.33)#4,133 |
| 71. | Spring Hill | 6.5% | 3.4%(+3.13)#72 | 4.3%(+2.29)#4,154 |
| 72. | Courtland | 6.5% | 3.4%(+3.04)#73 | 4.3%(+2.20)#4,244 |
| 73. | Parkerfield | 6.3% | 3.4%(+2.90)#74 | 4.3%(+2.06)#4,376 |
| 74. | Circleville | 6.2% | 3.4%(+2.84)#75 | 4.3%(+2.00)#4,460 |
| 75. | Eastborough | 6.1% | 3.4%(+2.73)#76 | 4.3%(+1.89)#4,545 |
| 76. | Sedgwick | 6.1% | 3.4%(+2.68)#77 | 4.3%(+1.84)#4,603 |
| 77. | Mcfarland | 6.1% | 3.4%(+2.65)#78 | 4.3%(+1.81)#4,657 |
| 78. | Prairie Village | 5.9% | 3.4%(+2.51)#79 | 4.3%(+1.67)#4,792 |
| 79. | Garden City | 5.8% | 3.4%(+2.42)#80 | 4.3%(+1.58)#4,903 |
| 80. | Fort Scott | 5.8% | 3.4%(+2.38)#81 | 4.3%(+1.54)#4,953 |
| 81. | Miltonvale | 5.8% | 3.4%(+2.36)#82 | 4.3%(+1.52)#4,981 |
| 82. | Auburn | 5.8% | 3.4%(+2.34)#83 | 4.3%(+1.50)#4,995 |
| 83. | Maple Hill | 5.7% | 3.4%(+2.33)#84 | 4.3%(+1.50)#5,009 |
| 84. | Merriam | 5.6% | 3.4%(+2.22)#85 | 4.3%(+1.38)#5,143 |
| 85. | Halstead | 5.6% | 3.4%(+2.14)#86 | 4.3%(+1.30)#5,224 |
| 86. | Burr Oak | 5.6% | 3.4%(+2.14)#87 | 4.3%(+1.30)#5,257 |
| 87. | Lindsborg | 5.5% | 3.4%(+2.09)#88 | 4.3%(+1.25)#5,312 |
| 88. | Dearing | 5.4% | 3.4%(+1.99)#89 | 4.3%(+1.15)#5,436 |
| 89. | Pittsburg | 5.4% | 3.4%(+1.98)#90 | 4.3%(+1.14)#5,457 |
| 90. | Madison | 5.4% | 3.4%(+1.97)#91 | 4.3%(+1.13)#5,468 |
| 91. | Westwood | 5.4% | 3.4%(+1.96)#92 | 4.3%(+1.12)#5,481 |
| 92. | Leonardville | 5.4% | 3.4%(+1.94)#93 | 4.3%(+1.11)#5,509 |
| 93. | Olsburg | 5.4% | 3.4%(+1.94)#94 | 4.3%(+1.11)#5,513 |
| 94. | Wamego | 5.3% | 3.4%(+1.86)#95 | 4.3%(+1.02)#5,602 |
| 95. | Almena | 5.3% | 3.4%(+1.85)#96 | 4.3%(+1.01)#5,633 |
| 96. | Louisburg | 5.2% | 3.4%(+1.74)#97 | 4.3%(+0.902)#5,774 |
| 97. | Hill City | 5.1% | 3.4%(+1.70)#98 | 4.3%(+0.866)#5,827 |
| 98. | La Cygne | 5.1% | 3.4%(+1.67)#99 | 4.3%(+0.833)#5,868 |
| 99. | Moundridge | 5.1% | 3.4%(+1.66)#100 | 4.3%(+0.817)#5,895 |
| 100. | Hays | 5.0% | 3.4%(+1.56)#101 | 4.3%(+0.719)#6,045 |
Common Questions
What are the Top 10 Cities with the Highest Percentage of Population with a Degree in Visual and Performing Arts in Kansas?
Top 10 Cities with the Highest Percentage of Population with a Degree in Visual and Performing Arts in Kansas are:
What city has the Highest Percentage of Population with a Degree in Visual and Performing Arts in Kansas?
Cedar has the Highest Percentage of Population with a Degree in Visual and Performing Arts in Kansas with 100.0%.
What is the Percentage of Population with a Degree in Visual and Performing Arts in the State of Kansas?
Percentage of Population with a Degree in Visual and Performing Arts in Kansas is 3.4%.
What is the Percentage of Population with a Degree in Visual and Performing Arts in the United States?
Percentage of Population with a Degree in Visual and Performing Arts in the United States is 4.3%.