Cities with the Most Immigrants from Eastern Africa in Texas
RELATED REPORTS & OPTIONS
Eastern Africa
Texas
Compare Cities
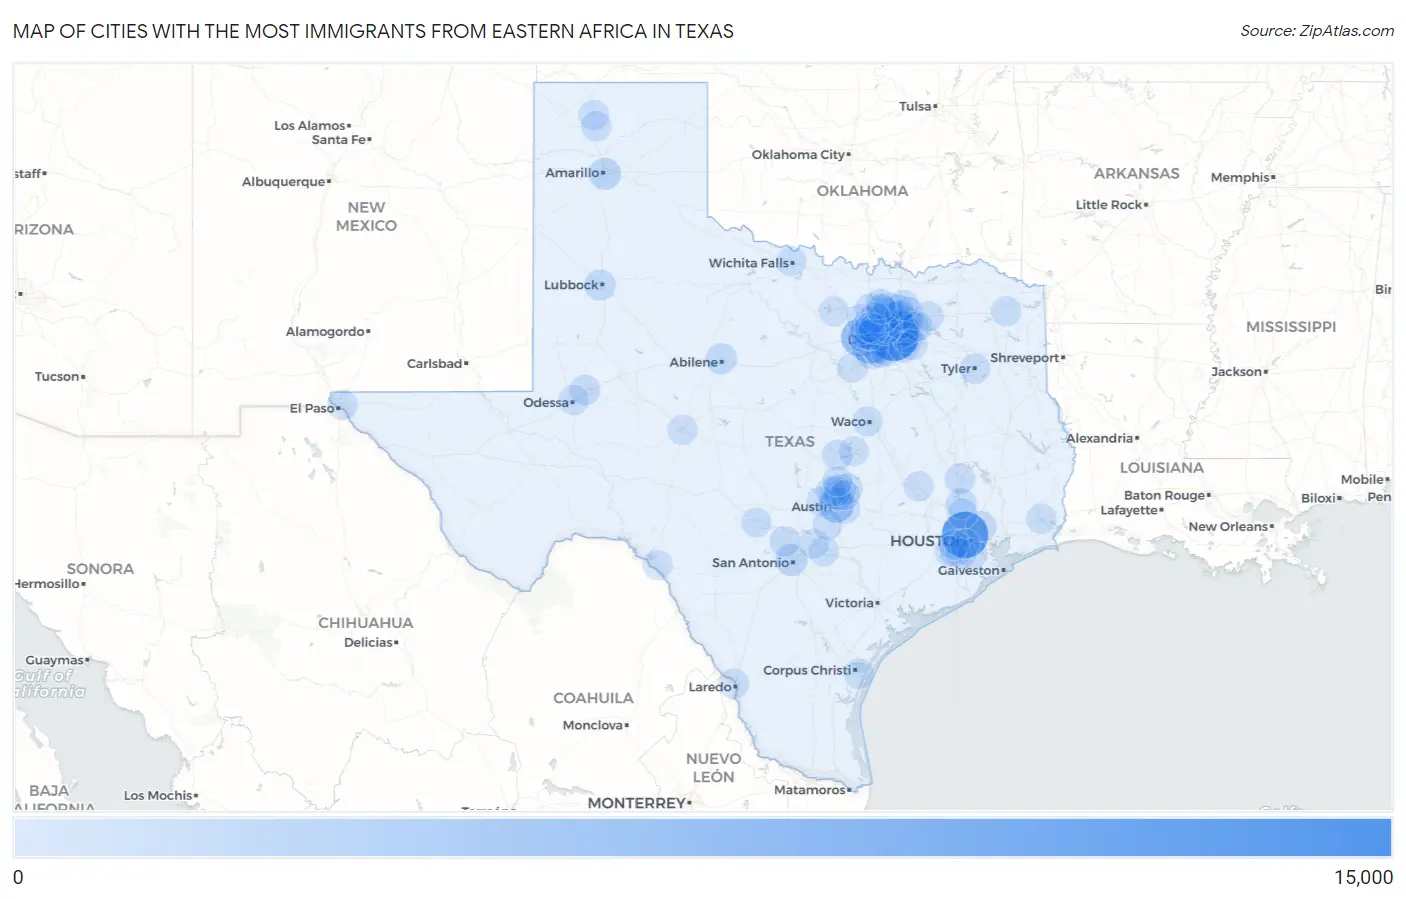
Map of Cities with the Most Immigrants from Eastern Africa in Texas
0
15,000
Cities with the Most Immigrants from Eastern Africa in Texas
| City | Eastern Africa | vs State | vs National | |
| 1. | Dallas | 10,650 | 75,503(14.11%)#1 | 752,337(1.42%)#5 |
| 2. | Houston | 9,011 | 75,503(11.93%)#2 | 752,337(1.20%)#7 |
| 3. | Fort Worth | 4,180 | 75,503(5.54%)#3 | 752,337(0.56%)#23 |
| 4. | Arlington | 3,827 | 75,503(5.07%)#4 | 752,337(0.51%)#27 |
| 5. | Garland | 3,780 | 75,503(5.01%)#5 | 752,337(0.50%)#28 |
| 6. | Austin | 2,856 | 75,503(3.78%)#6 | 752,337(0.38%)#40 |
| 7. | Irving | 2,423 | 75,503(3.21%)#7 | 752,337(0.32%)#46 |
| 8. | Plano | 2,073 | 75,503(2.75%)#8 | 752,337(0.28%)#56 |
| 9. | Rowlett | 1,407 | 75,503(1.86%)#9 | 752,337(0.19%)#89 |
| 10. | Wylie | 1,124 | 75,503(1.49%)#10 | 752,337(0.15%)#107 |
| 11. | Richardson | 1,108 | 75,503(1.47%)#11 | 752,337(0.15%)#111 |
| 12. | Grand Prairie | 1,089 | 75,503(1.44%)#12 | 752,337(0.14%)#115 |
| 13. | Amarillo | 1,030 | 75,503(1.36%)#13 | 752,337(0.14%)#123 |
| 14. | San Antonio | 974 | 75,503(1.29%)#14 | 752,337(0.13%)#128 |
| 15. | Princeton | 647 | 75,503(0.86%)#15 | 752,337(0.09%)#195 |
| 16. | Round Rock | 644 | 75,503(0.85%)#16 | 752,337(0.09%)#196 |
| 17. | Mckinney | 635 | 75,503(0.84%)#17 | 752,337(0.08%)#197 |
| 18. | Abilene | 631 | 75,503(0.84%)#18 | 752,337(0.08%)#199 |
| 19. | Lubbock | 624 | 75,503(0.83%)#19 | 752,337(0.08%)#205 |
| 20. | Euless | 597 | 75,503(0.79%)#20 | 752,337(0.08%)#212 |
| 21. | Conroe | 574 | 75,503(0.76%)#21 | 752,337(0.08%)#216 |
| 22. | Frisco | 559 | 75,503(0.74%)#22 | 752,337(0.07%)#227 |
| 23. | Little Elm | 541 | 75,503(0.72%)#23 | 752,337(0.07%)#232 |
| 24. | Sachse | 402 | 75,503(0.53%)#24 | 752,337(0.05%)#286 |
| 25. | Allen | 392 | 75,503(0.52%)#25 | 752,337(0.05%)#291 |
| 26. | Sugar Land | 384 | 75,503(0.51%)#26 | 752,337(0.05%)#295 |
| 27. | Lewisville | 361 | 75,503(0.48%)#27 | 752,337(0.05%)#313 |
| 28. | Mansfield | 335 | 75,503(0.44%)#28 | 752,337(0.04%)#339 |
| 29. | Midland | 329 | 75,503(0.44%)#29 | 752,337(0.04%)#346 |
| 30. | Fair Oaks Ranch | 316 | 75,503(0.42%)#30 | 752,337(0.04%)#358 |
| 31. | Huntsville | 314 | 75,503(0.42%)#31 | 752,337(0.04%)#363 |
| 32. | Carrollton | 313 | 75,503(0.41%)#32 | 752,337(0.04%)#364 |
| 33. | Pearland | 295 | 75,503(0.39%)#33 | 752,337(0.04%)#386 |
| 34. | Killeen | 286 | 75,503(0.38%)#34 | 752,337(0.04%)#392 |
| 35. | Hutto | 278 | 75,503(0.37%)#35 | 752,337(0.04%)#404 |
| 36. | Atascocita | 272 | 75,503(0.36%)#36 | 752,337(0.04%)#416 |
| 37. | Fate | 265 | 75,503(0.35%)#37 | 752,337(0.04%)#425 |
| 38. | Hurst | 248 | 75,503(0.33%)#38 | 752,337(0.03%)#444 |
| 39. | Murphy | 247 | 75,503(0.33%)#39 | 752,337(0.03%)#448 |
| 40. | Cactus | 244 | 75,503(0.32%)#40 | 752,337(0.03%)#451 |
| 41. | Travis Ranch | 236 | 75,503(0.31%)#41 | 752,337(0.03%)#464 |
| 42. | The Woodlands | 233 | 75,503(0.31%)#42 | 752,337(0.03%)#471 |
| 43. | Dumas | 230 | 75,503(0.30%)#43 | 752,337(0.03%)#478 |
| 44. | El Paso | 227 | 75,503(0.30%)#44 | 752,337(0.03%)#484 |
| 45. | Cedar Hill | 221 | 75,503(0.29%)#45 | 752,337(0.03%)#493 |
| 46. | Denton | 219 | 75,503(0.29%)#46 | 752,337(0.03%)#498 |
| 47. | Haltom City | 217 | 75,503(0.29%)#47 | 752,337(0.03%)#504 |
| 48. | Odessa | 200 | 75,503(0.26%)#48 | 752,337(0.03%)#532 |
| 49. | Tyler | 184 | 75,503(0.24%)#49 | 752,337(0.02%)#567 |
| 50. | Seguin | 182 | 75,503(0.24%)#50 | 752,337(0.02%)#575 |
| 51. | Keller | 180 | 75,503(0.24%)#51 | 752,337(0.02%)#577 |
| 52. | Missouri City | 179 | 75,503(0.24%)#52 | 752,337(0.02%)#578 |
| 53. | Desoto | 178 | 75,503(0.24%)#53 | 752,337(0.02%)#583 |
| 54. | Farmers Branch | 165 | 75,503(0.22%)#54 | 752,337(0.02%)#611 |
| 55. | Addison | 160 | 75,503(0.21%)#55 | 752,337(0.02%)#628 |
| 56. | The Colony | 158 | 75,503(0.21%)#56 | 752,337(0.02%)#635 |
| 57. | Beaumont | 156 | 75,503(0.21%)#57 | 752,337(0.02%)#646 |
| 58. | Flower Mound | 156 | 75,503(0.21%)#58 | 752,337(0.02%)#647 |
| 59. | North Richland Hills | 156 | 75,503(0.21%)#59 | 752,337(0.02%)#648 |
| 60. | Richmond | 142 | 75,503(0.19%)#60 | 752,337(0.02%)#695 |
| 61. | Omaha | 142 | 75,503(0.19%)#61 | 752,337(0.02%)#697 |
| 62. | Sienna | 135 | 75,503(0.18%)#62 | 752,337(0.02%)#718 |
| 63. | Hornsby Bend | 134 | 75,503(0.18%)#63 | 752,337(0.02%)#725 |
| 64. | Wells Branch | 132 | 75,503(0.17%)#64 | 752,337(0.02%)#740 |
| 65. | Wichita Falls | 125 | 75,503(0.17%)#65 | 752,337(0.02%)#768 |
| 66. | Prosper | 124 | 75,503(0.16%)#66 | 752,337(0.02%)#774 |
| 67. | Brushy Creek | 122 | 75,503(0.16%)#67 | 752,337(0.02%)#783 |
| 68. | Kerrville | 115 | 75,503(0.15%)#68 | 752,337(0.02%)#808 |
| 69. | Laredo | 113 | 75,503(0.15%)#69 | 752,337(0.02%)#817 |
| 70. | Greenville | 113 | 75,503(0.15%)#70 | 752,337(0.02%)#823 |
| 71. | Fairview | 112 | 75,503(0.15%)#71 | 752,337(0.01%)#829 |
| 72. | Royse City | 107 | 75,503(0.14%)#72 | 752,337(0.01%)#858 |
| 73. | Heartland | 106 | 75,503(0.14%)#73 | 752,337(0.01%)#867 |
| 74. | Corpus Christi | 94 | 75,503(0.12%)#74 | 752,337(0.01%)#924 |
| 75. | Waco | 90 | 75,503(0.12%)#75 | 752,337(0.01%)#943 |
| 76. | Seagoville | 90 | 75,503(0.12%)#76 | 752,337(0.01%)#947 |
| 77. | Del Rio | 88 | 75,503(0.12%)#77 | 752,337(0.01%)#962 |
| 78. | Melissa | 87 | 75,503(0.12%)#78 | 752,337(0.01%)#973 |
| 79. | Justin | 87 | 75,503(0.12%)#79 | 752,337(0.01%)#974 |
| 80. | College Station | 80 | 75,503(0.11%)#80 | 752,337(0.01%)#1,021 |
| 81. | Temple | 78 | 75,503(0.10%)#81 | 752,337(0.01%)#1,042 |
| 82. | Cedar Park | 75 | 75,503(0.10%)#82 | 752,337(0.01%)#1,066 |
| 83. | Highland Village | 75 | 75,503(0.10%)#83 | 752,337(0.01%)#1,070 |
| 84. | Mission Bend | 71 | 75,503(0.09%)#84 | 752,337(0.01%)#1,110 |
| 85. | New Braunfels | 69 | 75,503(0.09%)#85 | 752,337(0.01%)#1,131 |
| 86. | Lakeway | 69 | 75,503(0.09%)#86 | 752,337(0.01%)#1,137 |
| 87. | Bedford | 68 | 75,503(0.09%)#87 | 752,337(0.01%)#1,145 |
| 88. | San Angelo | 67 | 75,503(0.09%)#88 | 752,337(0.01%)#1,152 |
| 89. | Kyle | 66 | 75,503(0.09%)#89 | 752,337(0.01%)#1,164 |
| 90. | Poetry | 62 | 75,503(0.08%)#90 | 752,337(0.01%)#1,209 |
| 91. | Pflugerville | 60 | 75,503(0.08%)#91 | 752,337(0.01%)#1,221 |
| 92. | Talty | 60 | 75,503(0.08%)#92 | 752,337(0.01%)#1,234 |
| 93. | Georgetown | 59 | 75,503(0.08%)#93 | 752,337(0.01%)#1,239 |
| 94. | Bellaire | 59 | 75,503(0.08%)#94 | 752,337(0.01%)#1,247 |
| 95. | Southlake | 57 | 75,503(0.08%)#95 | 752,337(0.01%)#1,272 |
| 96. | Grapevine | 55 | 75,503(0.07%)#96 | 752,337(0.01%)#1,299 |
| 97. | Bridgeport | 55 | 75,503(0.07%)#97 | 752,337(0.01%)#1,312 |
| 98. | Aubrey | 55 | 75,503(0.07%)#98 | 752,337(0.01%)#1,313 |
| 99. | Paloma Creek | 54 | 75,503(0.07%)#99 | 752,337(0.01%)#1,326 |
| 100. | Cleburne | 53 | 75,503(0.07%)#100 | 752,337(0.01%)#1,335 |
Common Questions
What are the Top 10 Cities with the Most Immigrants from Eastern Africa in Texas?
Top 10 Cities with the Most Immigrants from Eastern Africa in Texas are:
What city has the Most Immigrants from Eastern Africa in Texas?
Dallas has the Most Immigrants from Eastern Africa in Texas with 10,650.
What is the Total Immigrants from Eastern Africa in the State of Texas?
Total Immigrants from Eastern Africa in Texas is 75,503.
What is the Total Immigrants from Eastern Africa in the United States?
Total Immigrants from Eastern Africa in the United States is 752,337.