Cities with the Most Immigrants from Ethiopia in Texas
RELATED REPORTS & OPTIONS
Ethiopia
Texas
Compare Cities
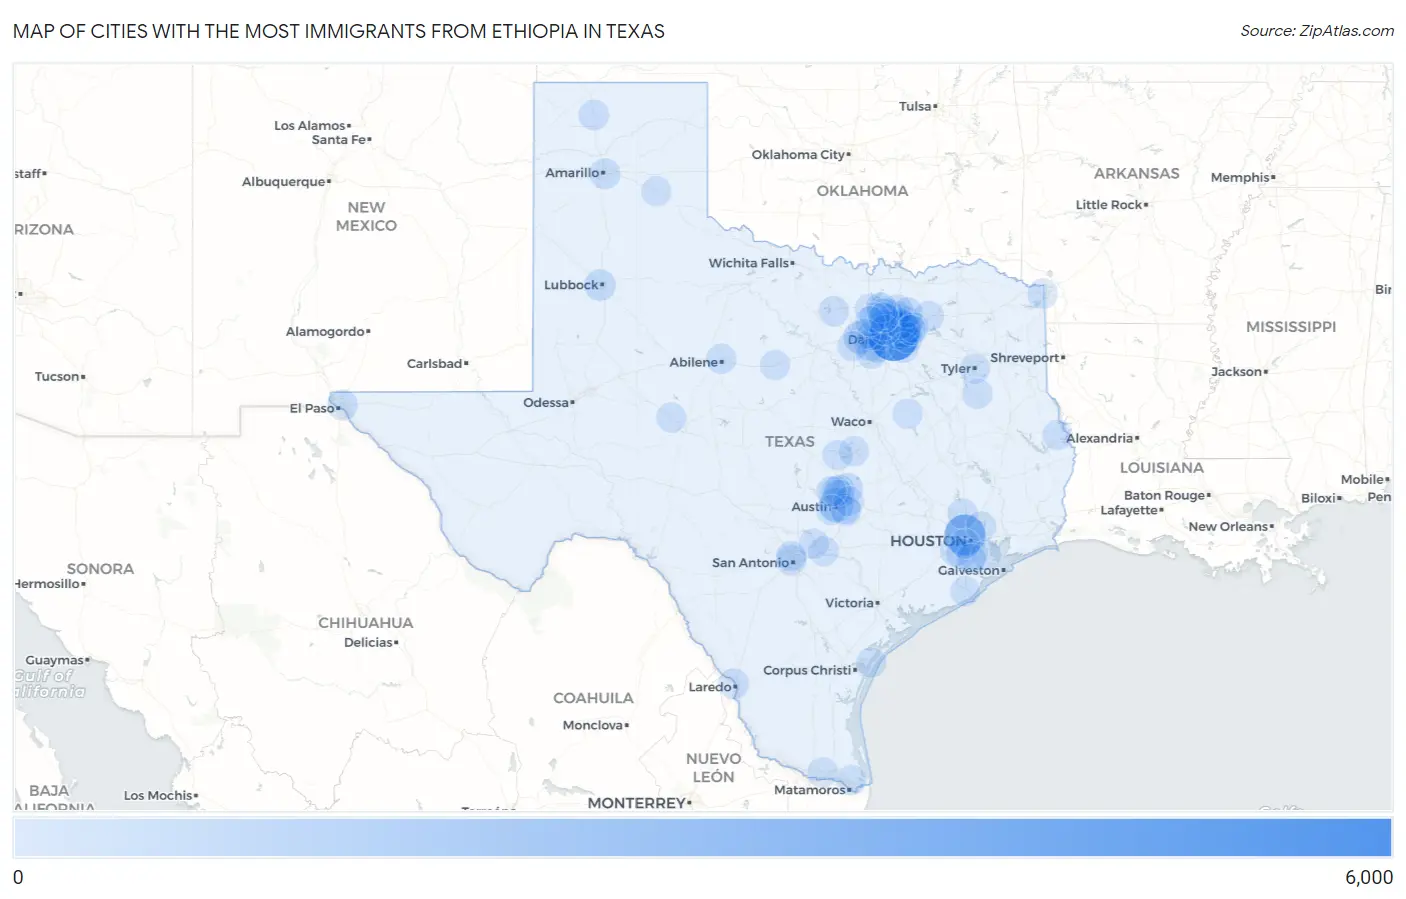
Map of Cities with the Most Immigrants from Ethiopia in Texas
0
6,000
Cities with the Most Immigrants from Ethiopia in Texas
| City | Ethiopia | vs State | vs National | |
| 1. | Dallas | 5,441 | 24,705(22.02%)#1 | 275,476(1.98%)#5 |
| 2. | Houston | 2,964 | 24,705(12.00%)#2 | 275,476(1.08%)#14 |
| 3. | Garland | 2,626 | 24,705(10.63%)#3 | 275,476(0.95%)#19 |
| 4. | Rowlett | 1,335 | 24,705(5.40%)#4 | 275,476(0.48%)#39 |
| 5. | Austin | 1,126 | 24,705(4.56%)#5 | 275,476(0.41%)#42 |
| 6. | Richardson | 859 | 24,705(3.48%)#6 | 275,476(0.31%)#57 |
| 7. | Fort Worth | 779 | 24,705(3.15%)#7 | 275,476(0.28%)#63 |
| 8. | Plano | 702 | 24,705(2.84%)#8 | 275,476(0.25%)#68 |
| 9. | Irving | 667 | 24,705(2.70%)#9 | 275,476(0.24%)#74 |
| 10. | Wylie | 563 | 24,705(2.28%)#10 | 275,476(0.20%)#90 |
| 11. | Arlington | 412 | 24,705(1.67%)#11 | 275,476(0.15%)#118 |
| 12. | Lubbock | 360 | 24,705(1.46%)#12 | 275,476(0.13%)#131 |
| 13. | Hutto | 278 | 24,705(1.13%)#13 | 275,476(0.10%)#162 |
| 14. | Allen | 271 | 24,705(1.10%)#14 | 275,476(0.10%)#169 |
| 15. | Sachse | 238 | 24,705(0.96%)#15 | 275,476(0.09%)#183 |
| 16. | Mckinney | 214 | 24,705(0.87%)#16 | 275,476(0.08%)#198 |
| 17. | Murphy | 213 | 24,705(0.86%)#17 | 275,476(0.08%)#199 |
| 18. | Round Rock | 188 | 24,705(0.76%)#18 | 275,476(0.07%)#220 |
| 19. | Grand Prairie | 166 | 24,705(0.67%)#19 | 275,476(0.06%)#248 |
| 20. | Little Elm | 165 | 24,705(0.67%)#20 | 275,476(0.06%)#253 |
| 21. | Travis Ranch | 156 | 24,705(0.63%)#21 | 275,476(0.06%)#266 |
| 22. | Amarillo | 142 | 24,705(0.57%)#22 | 275,476(0.05%)#290 |
| 23. | Hornsby Bend | 134 | 24,705(0.54%)#23 | 275,476(0.05%)#301 |
| 24. | Cactus | 126 | 24,705(0.51%)#24 | 275,476(0.05%)#313 |
| 25. | Frisco | 120 | 24,705(0.49%)#25 | 275,476(0.04%)#322 |
| 26. | Greenville | 113 | 24,705(0.46%)#26 | 275,476(0.04%)#345 |
| 27. | El Paso | 109 | 24,705(0.44%)#27 | 275,476(0.04%)#358 |
| 28. | Carrollton | 107 | 24,705(0.43%)#28 | 275,476(0.04%)#365 |
| 29. | Laredo | 104 | 24,705(0.42%)#29 | 275,476(0.04%)#370 |
| 30. | Pearland | 90 | 24,705(0.36%)#30 | 275,476(0.03%)#413 |
| 31. | Seagoville | 90 | 24,705(0.36%)#31 | 275,476(0.03%)#416 |
| 32. | Princeton | 87 | 24,705(0.35%)#32 | 275,476(0.03%)#421 |
| 33. | San Antonio | 75 | 24,705(0.30%)#33 | 275,476(0.03%)#456 |
| 34. | Wells Branch | 64 | 24,705(0.26%)#34 | 275,476(0.02%)#506 |
| 35. | The Woodlands | 60 | 24,705(0.24%)#35 | 275,476(0.02%)#523 |
| 36. | Euless | 59 | 24,705(0.24%)#36 | 275,476(0.02%)#532 |
| 37. | Abilene | 57 | 24,705(0.23%)#37 | 275,476(0.02%)#546 |
| 38. | Bridgeport | 55 | 24,705(0.22%)#38 | 275,476(0.02%)#566 |
| 39. | Brushy Creek | 48 | 24,705(0.19%)#39 | 275,476(0.02%)#610 |
| 40. | Seguin | 45 | 24,705(0.18%)#40 | 275,476(0.02%)#633 |
| 41. | Atascocita | 42 | 24,705(0.17%)#41 | 275,476(0.02%)#652 |
| 42. | Heartland | 42 | 24,705(0.17%)#42 | 275,476(0.02%)#658 |
| 43. | Sugar Land | 38 | 24,705(0.15%)#43 | 275,476(0.01%)#685 |
| 44. | Denton | 37 | 24,705(0.15%)#44 | 275,476(0.01%)#698 |
| 45. | New Braunfels | 36 | 24,705(0.15%)#45 | 275,476(0.01%)#712 |
| 46. | Missouri City | 33 | 24,705(0.13%)#46 | 275,476(0.01%)#750 |
| 47. | Weslaco | 33 | 24,705(0.13%)#47 | 275,476(0.01%)#755 |
| 48. | Fate | 32 | 24,705(0.13%)#48 | 275,476(0.01%)#769 |
| 49. | Rockwall | 30 | 24,705(0.12%)#49 | 275,476(0.01%)#788 |
| 50. | Killeen | 29 | 24,705(0.12%)#50 | 275,476(0.01%)#801 |
| 51. | North Richland Hills | 28 | 24,705(0.11%)#51 | 275,476(0.01%)#816 |
| 52. | Texarkana | 28 | 24,705(0.11%)#52 | 275,476(0.01%)#817 |
| 53. | Jones Creek | 27 | 24,705(0.11%)#53 | 275,476(0.01%)#847 |
| 54. | Garfield | 26 | 24,705(0.11%)#54 | 275,476(0.01%)#860 |
| 55. | Temple | 25 | 24,705(0.10%)#55 | 275,476(0.01%)#862 |
| 56. | Hackberry | 25 | 24,705(0.10%)#56 | 275,476(0.01%)#867 |
| 57. | Mansfield | 24 | 24,705(0.10%)#57 | 275,476(0.01%)#872 |
| 58. | Farmers Branch | 23 | 24,705(0.09%)#58 | 275,476(0.01%)#893 |
| 59. | Nassau Bay | 21 | 24,705(0.09%)#59 | 275,476(0.01%)#943 |
| 60. | Manor | 20 | 24,705(0.08%)#60 | 275,476(0.01%)#959 |
| 61. | Jacksonville | 17 | 24,705(0.07%)#61 | 275,476(0.01%)#1,012 |
| 62. | Cedar Park | 16 | 24,705(0.06%)#62 | 275,476(0.01%)#1,023 |
| 63. | Providence Village | 15 | 24,705(0.06%)#63 | 275,476(0.01%)#1,055 |
| 64. | Castle Hills | 14 | 24,705(0.06%)#64 | 275,476(0.01%)#1,089 |
| 65. | Highland Village | 13 | 24,705(0.05%)#65 | 275,476(0.00%)#1,105 |
| 66. | Tyler | 12 | 24,705(0.05%)#66 | 275,476(0.00%)#1,121 |
| 67. | Brownsville | 11 | 24,705(0.04%)#67 | 275,476(0.00%)#1,152 |
| 68. | Manvel | 10 | 24,705(0.04%)#68 | 275,476(0.00%)#1,191 |
| 69. | Bellaire | 9 | 24,705(0.04%)#69 | 275,476(0.00%)#1,233 |
| 70. | Benbrook | 8 | 24,705(0.03%)#70 | 275,476(0.00%)#1,271 |
| 71. | Flower Mound | 7 | 24,705(0.03%)#71 | 275,476(0.00%)#1,286 |
| 72. | Carlsbad | 7 | 24,705(0.03%)#72 | 275,476(0.00%)#1,318 |
| 73. | The Colony | 6 | 24,705(0.02%)#73 | 275,476(0.00%)#1,322 |
| 74. | Sunset Valley | 3 | 24,705(0.01%)#74 | 275,476(0.00%)#1,434 |
| 75. | Mexia | 2 | 24,705(0.01%)#75 | 275,476(0.00%)#1,448 |
| 76. | Hemphill | 2 | 24,705(0.01%)#76 | 275,476(0.00%)#1,454 |
| 77. | Aransas Pass | 1 | 24,705(0.00%)#77 | 275,476(0.00%)#1,491 |
| 78. | Eastland | 1 | 24,705(0.00%)#78 | 275,476(0.00%)#1,504 |
| 79. | Clarendon | 1 | 24,705(0.00%)#79 | 275,476(0.00%)#1,510 |
Common Questions
What are the Top 10 Cities with the Most Immigrants from Ethiopia in Texas?
Top 10 Cities with the Most Immigrants from Ethiopia in Texas are:
#1
5,441
#2
2,964
#3
2,626
#4
1,335
#5
1,126
#6
859
#7
779
#8
702
#9
667
#10
563
What city has the Most Immigrants from Ethiopia in Texas?
Dallas has the Most Immigrants from Ethiopia in Texas with 5,441.
What is the Total Immigrants from Ethiopia in the State of Texas?
Total Immigrants from Ethiopia in Texas is 24,705.
What is the Total Immigrants from Ethiopia in the United States?
Total Immigrants from Ethiopia in the United States is 275,476.