Cities with the Highest Percentage of Immigrants from Canada in Texas
RELATED REPORTS & OPTIONS
Canada
Texas
Compare Cities
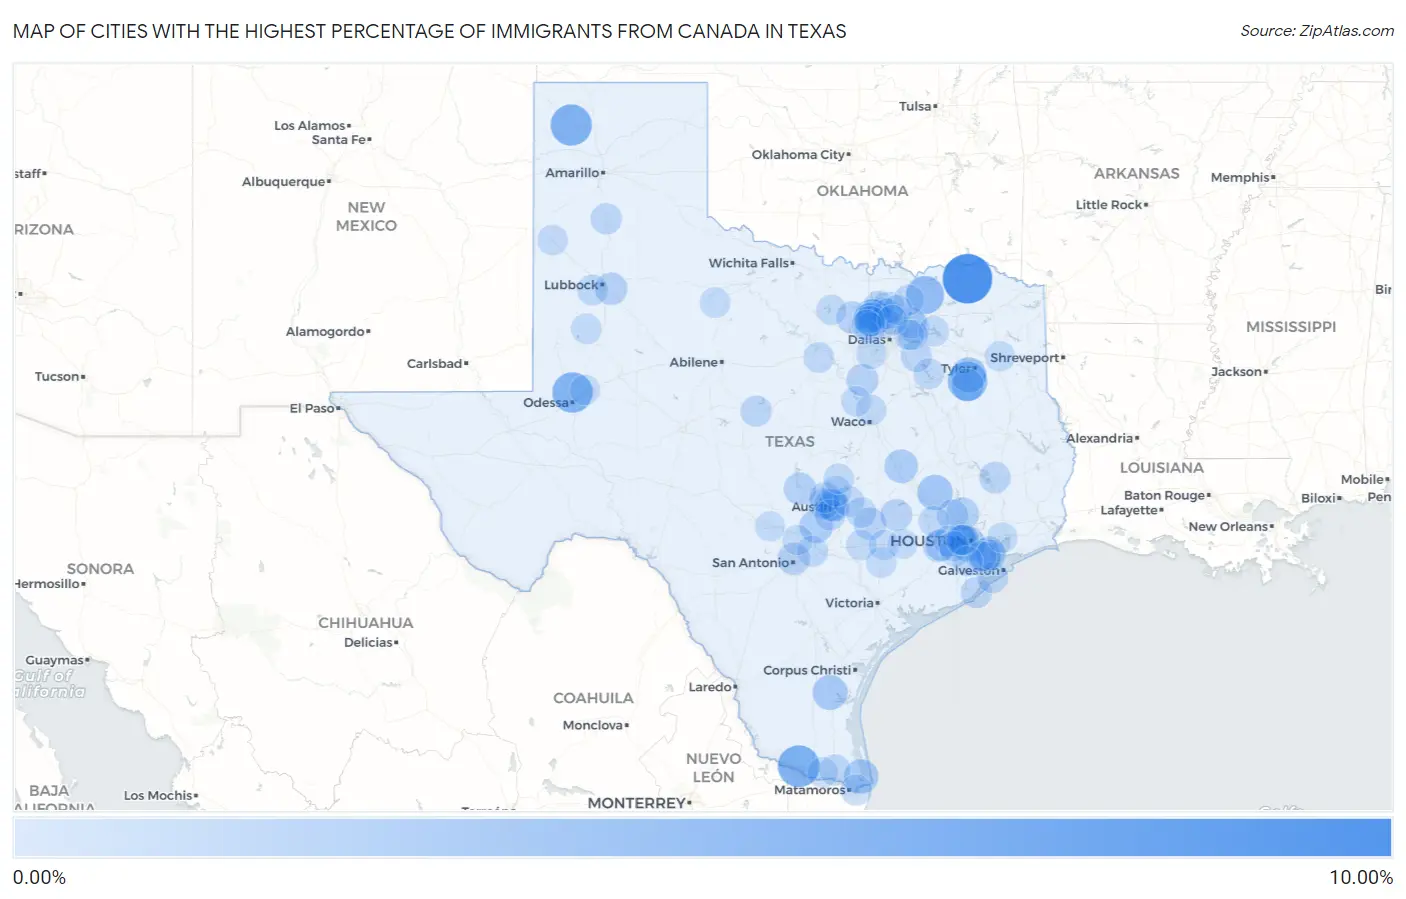
Map of Cities with the Highest Percentage of Immigrants from Canada in Texas
0.00%
10.00%
Cities with the Highest Percentage of Immigrants from Canada in Texas
| City | Canada | vs State | vs National | |
| 1. | Sun Valley | 9.33% | 0.19%(+9.14)#-1 | 0.25%(+9.09)#0 |
| 2. | Perezville | 5.77% | 0.19%(+5.58)#0 | 0.25%(+5.52)#1 |
| 3. | Hartley | 5.45% | 0.19%(+5.26)#1 | 0.25%(+5.20)#2 |
| 4. | Gardendale | 5.08% | 0.19%(+4.89)#2 | 0.25%(+4.83)#3 |
| 5. | Emerald Bay | 4.64% | 0.19%(+4.45)#3 | 0.25%(+4.40)#4 |
| 6. | Bailey | 4.02% | 0.19%(+3.83)#4 | 0.25%(+3.77)#5 |
| 7. | Copper Canyon | 3.53% | 0.19%(+3.34)#5 | 0.25%(+3.28)#6 |
| 8. | Anderson | 2.77% | 0.19%(+2.58)#6 | 0.25%(+2.52)#7 |
| 9. | Noonday | 2.75% | 0.19%(+2.56)#7 | 0.25%(+2.50)#8 |
| 10. | West University Place | 2.69% | 0.19%(+2.50)#53 | 0.25%(+2.44)#1,435 |
| 11. | Ricardo | 2.56% | 0.19%(+2.37)#54 | 0.25%(+2.32)#1,436 |
| 12. | Laguna Vista | 2.28% | 0.19%(+2.09)#55 | 0.25%(+2.03)#1,437 |
| 13. | Wimberley | 2.03% | 0.19%(+1.84)#56 | 0.25%(+1.78)#1,438 |
| 14. | Hearne | 2.01% | 0.19%(+1.82)#57 | 0.25%(+1.76)#1,439 |
| 15. | The Woodlands | 1.68% | 0.19%(+1.50)#75 | 0.25%(+1.44)#2,144 |
| 16. | Shadybrook | 1.51% | 0.19%(+1.32)#76 | 0.25%(+1.26)#2,145 |
| 17. | Hedwig Village | 1.51% | 0.19%(+1.32)#77 | 0.25%(+1.26)#2,146 |
| 18. | Webster | 1.50% | 0.19%(+1.32)#78 | 0.25%(+1.26)#2,147 |
| 19. | Ransom Canyon | 1.49% | 0.19%(+1.30)#79 | 0.25%(+1.24)#2,148 |
| 20. | El Lago | 1.48% | 0.19%(+1.29)#80 | 0.25%(+1.23)#2,149 |
| 21. | Horseshoe Bay | 1.48% | 0.19%(+1.29)#81 | 0.25%(+1.23)#2,150 |
| 22. | Smithville | 1.46% | 0.19%(+1.27)#82 | 0.25%(+1.21)#2,151 |
| 23. | New Fairview | 1.41% | 0.19%(+1.22)#83 | 0.25%(+1.16)#2,152 |
| 24. | Alamo Heights | 1.38% | 0.19%(+1.19)#84 | 0.25%(+1.13)#2,153 |
| 25. | Covington | 1.34% | 0.19%(+1.15)#85 | 0.25%(+1.09)#2,154 |
| 26. | Hackberry | 1.33% | 0.19%(+1.14)#86 | 0.25%(+1.08)#2,155 |
| 27. | Carmine | 1.30% | 0.19%(+1.11)#87 | 0.25%(+1.05)#2,156 |
| 28. | Weston Lakes | 1.23% | 0.19%(+1.04)#88 | 0.25%(+0.980)#2,157 |
| 29. | Fulshear | 1.19% | 0.19%(+1.00)#115 | 0.25%(+0.944)#2,832 |
| 30. | Lost Creek | 1.12% | 0.19%(+0.932)#116 | 0.25%(+0.873)#2,833 |
| 31. | Rockwell Place | 1.12% | 0.19%(+0.930)#117 | 0.25%(+0.871)#2,834 |
| 32. | Livingston | 1.11% | 0.19%(+0.921)#118 | 0.25%(+0.863)#2,835 |
| 33. | Prosper | 1.10% | 0.19%(+0.915)#120 | 0.25%(+0.856)#2,883 |
| 34. | West Lake Hills | 1.07% | 0.19%(+0.882)#121 | 0.25%(+0.823)#2,884 |
| 35. | Rollingwood | 0.99% | 0.19%(+0.801)#122 | 0.25%(+0.743)#2,885 |
| 36. | Surfside Beach | 0.97% | 0.19%(+0.783)#123 | 0.25%(+0.724)#2,886 |
| 37. | Oak Grove | 0.97% | 0.19%(+0.778)#124 | 0.25%(+0.720)#2,887 |
| 38. | Palm Valley | 0.96% | 0.19%(+0.770)#125 | 0.25%(+0.711)#2,888 |
| 39. | Bangs | 0.94% | 0.19%(+0.753)#126 | 0.25%(+0.695)#2,889 |
| 40. | Corinth | 0.93% | 0.19%(+0.739)#127 | 0.25%(+0.681)#2,890 |
| 41. | Tulia | 0.93% | 0.19%(+0.736)#128 | 0.25%(+0.677)#2,891 |
| 42. | Bee Cave | 0.92% | 0.19%(+0.734)#129 | 0.25%(+0.675)#2,892 |
| 43. | Jamaica Beach | 0.91% | 0.19%(+0.717)#130 | 0.25%(+0.658)#2,893 |
| 44. | Fate | 0.90% | 0.19%(+0.715)#131 | 0.25%(+0.657)#2,894 |
| 45. | Stagecoach | 0.90% | 0.19%(+0.713)#132 | 0.25%(+0.654)#2,895 |
| 46. | League City | 0.90% | 0.19%(+0.712)#133 | 0.25%(+0.653)#2,896 |
| 47. | Piney Point Village | 0.90% | 0.19%(+0.710)#134 | 0.25%(+0.651)#2,897 |
| 48. | South Point | 0.90% | 0.19%(+0.706)#135 | 0.25%(+0.647)#2,898 |
| 49. | Hebron | 0.88% | 0.19%(+0.690)#136 | 0.25%(+0.632)#2,899 |
| 50. | Hudson Bend | 0.87% | 0.19%(+0.682)#137 | 0.25%(+0.623)#2,900 |
| 51. | Santa Clara | 0.84% | 0.19%(+0.652)#138 | 0.25%(+0.593)#2,901 |
| 52. | Manchaca | 0.83% | 0.19%(+0.644)#139 | 0.25%(+0.585)#2,902 |
| 53. | Manor | 0.81% | 0.19%(+0.625)#140 | 0.25%(+0.567)#2,903 |
| 54. | Lavon | 0.81% | 0.19%(+0.621)#141 | 0.25%(+0.562)#2,904 |
| 55. | Wolfforth | 0.80% | 0.19%(+0.607)#142 | 0.25%(+0.548)#2,905 |
| 56. | Enchanted Oaks | 0.79% | 0.19%(+0.604)#143 | 0.25%(+0.545)#2,906 |
| 57. | Westminster | 0.76% | 0.19%(+0.570)#144 | 0.25%(+0.511)#2,907 |
| 58. | Cinco Ranch | 0.75% | 0.19%(+0.564)#145 | 0.25%(+0.505)#2,908 |
| 59. | Lipan | 0.72% | 0.19%(+0.530)#146 | 0.25%(+0.471)#2,909 |
| 60. | Mclendon Chisholm | 0.72% | 0.19%(+0.530)#147 | 0.25%(+0.471)#2,910 |
| 61. | Pine Island | 0.72% | 0.19%(+0.526)#148 | 0.25%(+0.467)#2,911 |
| 62. | Bartonville | 0.72% | 0.19%(+0.526)#149 | 0.25%(+0.467)#2,912 |
| 63. | Mansfield | 0.69% | 0.19%(+0.506)#150 | 0.25%(+0.447)#2,913 |
| 64. | Krugerville | 0.69% | 0.19%(+0.502)#151 | 0.25%(+0.443)#2,914 |
| 65. | Welch | 0.68% | 0.19%(+0.491)#152 | 0.25%(+0.432)#2,915 |
| 66. | Steiner Ranch | 0.68% | 0.19%(+0.487)#153 | 0.25%(+0.429)#2,916 |
| 67. | Frisco | 0.67% | 0.19%(+0.481)#154 | 0.25%(+0.422)#2,917 |
| 68. | Weslaco | 0.67% | 0.19%(+0.479)#155 | 0.25%(+0.420)#2,918 |
| 69. | Sugar Land | 0.66% | 0.19%(+0.475)#156 | 0.25%(+0.416)#2,919 |
| 70. | Hallettsville | 0.66% | 0.19%(+0.470)#157 | 0.25%(+0.411)#2,920 |
| 71. | Southlake | 0.66% | 0.19%(+0.467)#158 | 0.25%(+0.408)#2,921 |
| 72. | Camp Swift | 0.65% | 0.19%(+0.462)#159 | 0.25%(+0.403)#2,922 |
| 73. | Lantana | 0.65% | 0.19%(+0.460)#160 | 0.25%(+0.401)#2,923 |
| 74. | Brushy Creek | 0.65% | 0.19%(+0.457)#161 | 0.25%(+0.398)#2,924 |
| 75. | Rochester | 0.65% | 0.19%(+0.456)#162 | 0.25%(+0.397)#2,925 |
| 76. | Flower Mound | 0.63% | 0.19%(+0.436)#163 | 0.25%(+0.377)#2,926 |
| 77. | Muleshoe | 0.62% | 0.19%(+0.427)#164 | 0.25%(+0.368)#2,927 |
| 78. | Ross | 0.61% | 0.19%(+0.420)#165 | 0.25%(+0.362)#2,928 |
| 79. | West Tawakoni | 0.60% | 0.19%(+0.408)#166 | 0.25%(+0.349)#2,929 |
| 80. | Hunters Creek Village | 0.59% | 0.19%(+0.404)#167 | 0.25%(+0.345)#2,930 |
| 81. | Serenada | 0.59% | 0.19%(+0.401)#168 | 0.25%(+0.342)#2,931 |
| 82. | Laguna Park | 0.59% | 0.19%(+0.397)#169 | 0.25%(+0.338)#2,932 |
| 83. | Heath | 0.58% | 0.19%(+0.394)#170 | 0.25%(+0.335)#2,933 |
| 84. | Four Corners | 0.58% | 0.19%(+0.393)#171 | 0.25%(+0.334)#2,934 |
| 85. | Midland | 0.57% | 0.19%(+0.385)#172 | 0.25%(+0.326)#2,935 |
| 86. | Lake Bridgeport | 0.57% | 0.19%(+0.384)#173 | 0.25%(+0.325)#2,936 |
| 87. | Kemah | 0.57% | 0.19%(+0.376)#174 | 0.25%(+0.317)#2,937 |
| 88. | Waelder | 0.57% | 0.19%(+0.376)#175 | 0.25%(+0.317)#2,938 |
| 89. | Friendswood | 0.56% | 0.19%(+0.373)#176 | 0.25%(+0.314)#3,110 |
| 90. | Iowa Colony | 0.55% | 0.19%(+0.358)#177 | 0.25%(+0.299)#3,111 |
| 91. | Westlake | 0.54% | 0.19%(+0.349)#178 | 0.25%(+0.290)#3,112 |
| 92. | Bulverde | 0.53% | 0.19%(+0.343)#179 | 0.25%(+0.284)#3,113 |
| 93. | White Oak | 0.53% | 0.19%(+0.341)#180 | 0.25%(+0.282)#3,114 |
| 94. | Mckinney | 0.53% | 0.19%(+0.338)#181 | 0.25%(+0.279)#3,115 |
| 95. | Schulenburg | 0.52% | 0.19%(+0.333)#182 | 0.25%(+0.274)#3,116 |
| 96. | Columbus | 0.52% | 0.19%(+0.326)#183 | 0.25%(+0.267)#3,117 |
| 97. | Plano | 0.51% | 0.19%(+0.318)#184 | 0.25%(+0.259)#3,118 |
| 98. | Comfort | 0.50% | 0.19%(+0.314)#185 | 0.25%(+0.255)#3,119 |
| 99. | Cove | 0.50% | 0.19%(+0.312)#186 | 0.25%(+0.253)#3,120 |
| 100. | Bunker Hill Village | 0.50% | 0.19%(+0.308)#187 | 0.25%(+0.249)#3,121 |
Common Questions
What are the Top 10 Cities with the Highest Percentage of Immigrants from Canada in Texas?
Top 10 Cities with the Highest Percentage of Immigrants from Canada in Texas are:
#1
9.33%
#2
5.77%
#3
5.45%
#4
5.08%
#5
4.64%
#6
4.02%
#7
3.53%
#8
2.77%
#9
2.75%
#10
2.69%
What city has the Highest Percentage of Immigrants from Canada in Texas?
Sun Valley has the Highest Percentage of Immigrants from Canada in Texas with 9.33%.
What is the Percentage of Immigrants from Canada in the State of Texas?
Percentage of Immigrants from Canada in Texas is 0.19%.
What is the Percentage of Immigrants from Canada in the United States?
Percentage of Immigrants from Canada in the United States is 0.25%.