Zip Codes with the Highest Percentage of Population with a Degree in Visual and Performing Arts in Wichita Falls, TX
RELATED REPORTS & OPTIONS
Visual and Performing Arts
Wichita Falls
Compare Zip Codes
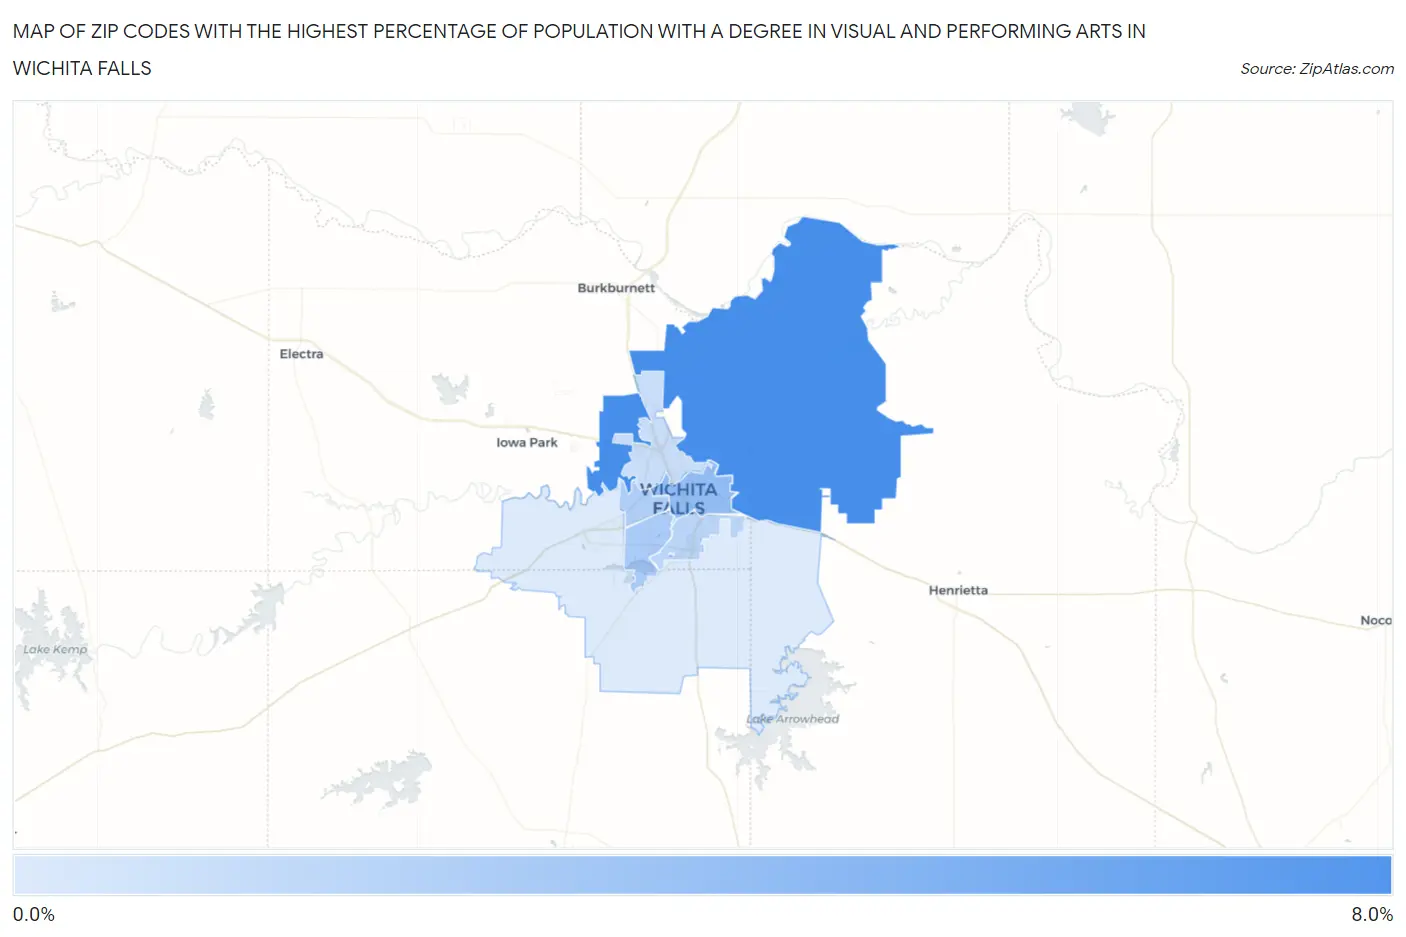
Map of Zip Codes with the Highest Percentage of Population with a Degree in Visual and Performing Arts in Wichita Falls
0.0%
8.0%
Zip Codes with the Highest Percentage of Population with a Degree in Visual and Performing Arts in Wichita Falls, TX
| Zip Code | % Graduates | vs State | vs National | |
| 1. | 76305 | 7.3% | 3.2%(+4.12)#116 | 4.3%(+3.08)#3,344 |
| 2. | 76301 | 4.2% | 3.2%(+0.992)#376 | 4.3%(-0.051)#8,621 |
| 3. | 76308 | 3.2% | 3.2%(+0.014)#553 | 4.3%(-1.03)#11,897 |
| 4. | 76309 | 3.0% | 3.2%(-0.211)#612 | 4.3%(-1.25)#12,734 |
| 5. | 76302 | 2.6% | 3.2%(-0.594)#691 | 4.3%(-1.64)#14,205 |
| 6. | 76306 | 2.0% | 3.2%(-1.22)#870 | 4.3%(-2.27)#16,506 |
| 7. | 76310 | 1.2% | 3.2%(-2.01)#1,063 | 4.3%(-3.06)#19,100 |
1
Common Questions
What are the Top 5 Zip Codes with the Highest Percentage of Population with a Degree in Visual and Performing Arts in Wichita Falls, TX?
Top 5 Zip Codes with the Highest Percentage of Population with a Degree in Visual and Performing Arts in Wichita Falls, TX are:
What zip code has the Highest Percentage of Population with a Degree in Visual and Performing Arts in Wichita Falls, TX?
76305 has the Highest Percentage of Population with a Degree in Visual and Performing Arts in Wichita Falls, TX with 7.3%.
What is the Percentage of Population with a Degree in Visual and Performing Arts in Wichita Falls, TX?
Percentage of Population with a Degree in Visual and Performing Arts in Wichita Falls is 2.6%.
What is the Percentage of Population with a Degree in Visual and Performing Arts in Texas?
Percentage of Population with a Degree in Visual and Performing Arts in Texas is 3.2%.
What is the Percentage of Population with a Degree in Visual and Performing Arts in the United States?
Percentage of Population with a Degree in Visual and Performing Arts in the United States is 4.3%.