Cities with the Highest Percentage of Immigrants from Pakistan in Texas
RELATED REPORTS & OPTIONS
Pakistan
Texas
Compare Cities
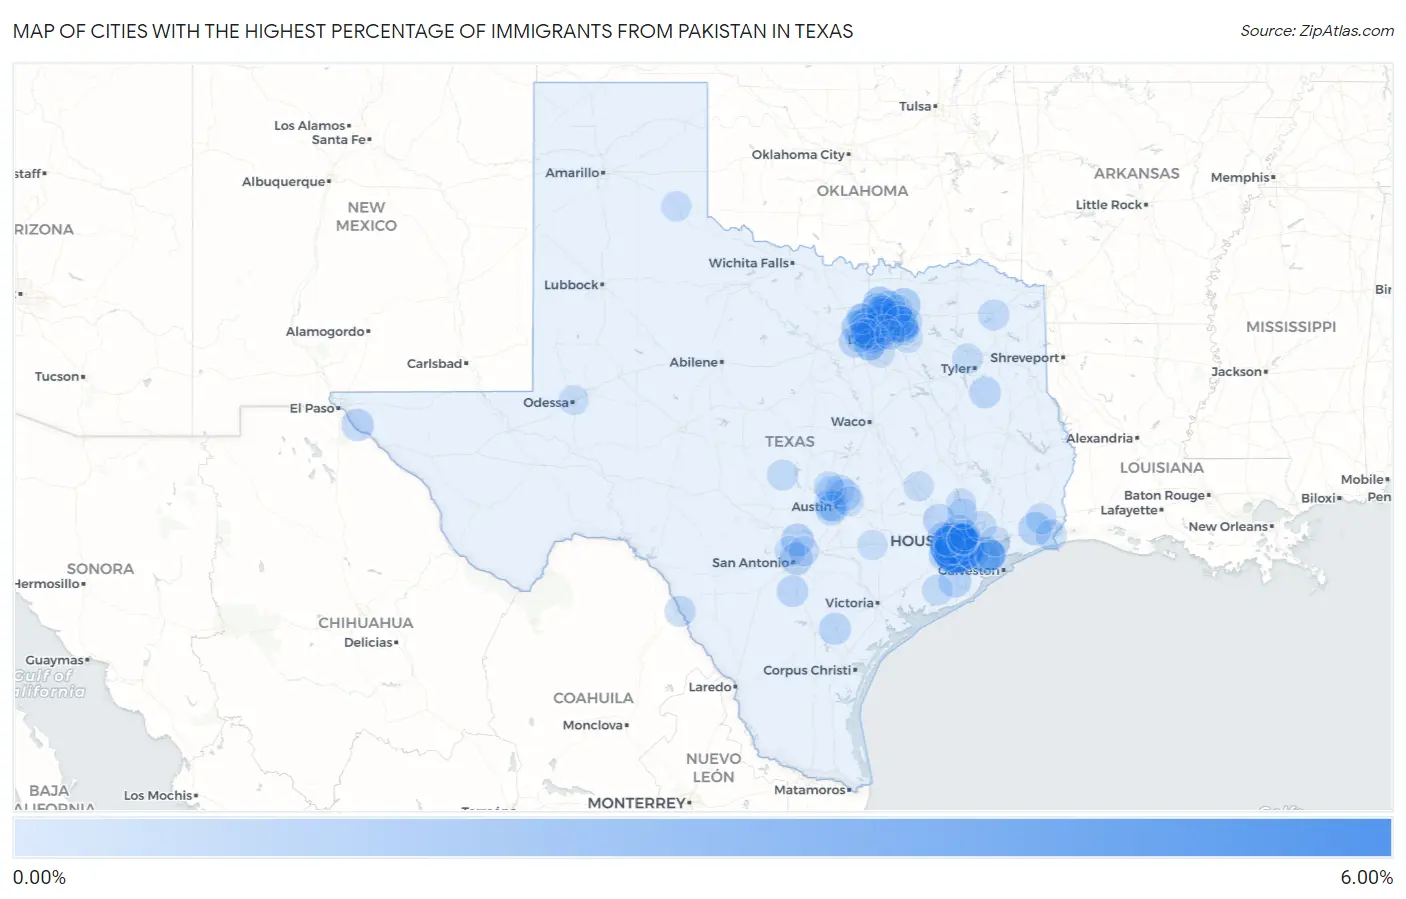
Map of Cities with the Highest Percentage of Immigrants from Pakistan in Texas
0.00%
6.00%
Cities with the Highest Percentage of Immigrants from Pakistan in Texas
| City | Pakistan | vs State | vs National | |
| 1. | Meadows Place | 5.42% | 0.21%(+5.21)#-1 | 0.12%(+5.31)#0 |
| 2. | Four Corners | 4.70% | 0.21%(+4.49)#18 | 0.12%(+4.58)#220 |
| 3. | Sugar Land | 3.77% | 0.21%(+3.56)#88 | 0.12%(+3.66)#1,175 |
| 4. | Mission Bend | 2.26% | 0.21%(+2.05)#89 | 0.12%(+2.14)#1,176 |
| 5. | Nassau Bay | 1.76% | 0.21%(+1.55)#90 | 0.12%(+1.65)#1,177 |
| 6. | Murphy | 1.69% | 0.21%(+1.47)#91 | 0.12%(+1.57)#1,178 |
| 7. | Euless | 1.61% | 0.21%(+1.39)#92 | 0.12%(+1.49)#1,179 |
| 8. | Stafford | 1.51% | 0.21%(+1.30)#93 | 0.12%(+1.39)#1,180 |
| 9. | Carrollton | 1.38% | 0.21%(+1.17)#94 | 0.12%(+1.26)#1,181 |
| 10. | Bunker Hill Village | 1.36% | 0.21%(+1.15)#95 | 0.12%(+1.24)#1,182 |
| 11. | Aubrey | 1.26% | 0.21%(+1.05)#96 | 0.12%(+1.15)#1,183 |
| 12. | Haslet | 1.24% | 0.21%(+1.03)#97 | 0.12%(+1.12)#1,184 |
| 13. | Melissa | 1.13% | 0.21%(+0.922)#98 | 0.12%(+1.02)#1,185 |
| 14. | Prosper | 1.13% | 0.21%(+0.917)#99 | 0.12%(+1.01)#1,186 |
| 15. | Fannett | 1.02% | 0.21%(+0.807)#100 | 0.12%(+0.901)#1,187 |
| 16. | Plano | 0.92% | 0.21%(+0.708)#101 | 0.12%(+0.802)#1,188 |
| 17. | Katy | 0.92% | 0.21%(+0.703)#102 | 0.12%(+0.797)#1,189 |
| 18. | Irving | 0.91% | 0.21%(+0.699)#103 | 0.12%(+0.792)#1,190 |
| 19. | Richardson | 0.90% | 0.21%(+0.688)#104 | 0.12%(+0.781)#1,191 |
| 20. | Hebron | 0.88% | 0.21%(+0.667)#105 | 0.12%(+0.761)#1,192 |
| 21. | Jersey Village | 0.86% | 0.21%(+0.651)#106 | 0.12%(+0.744)#1,193 |
| 22. | Bulverde | 0.86% | 0.21%(+0.646)#107 | 0.12%(+0.739)#1,194 |
| 23. | Colleyville | 0.85% | 0.21%(+0.638)#108 | 0.12%(+0.731)#1,195 |
| 24. | Terrell Hills | 0.83% | 0.21%(+0.620)#109 | 0.12%(+0.714)#1,196 |
| 25. | West Columbia | 0.82% | 0.21%(+0.611)#110 | 0.12%(+0.705)#1,197 |
| 26. | Frisco | 0.81% | 0.21%(+0.596)#111 | 0.12%(+0.689)#1,198 |
| 27. | Rosenberg | 0.81% | 0.21%(+0.593)#112 | 0.12%(+0.687)#1,199 |
| 28. | Fabens | 0.77% | 0.21%(+0.561)#113 | 0.12%(+0.654)#1,200 |
| 29. | Westlake | 0.77% | 0.21%(+0.557)#114 | 0.12%(+0.650)#1,201 |
| 30. | Westover Hills | 0.75% | 0.21%(+0.535)#115 | 0.12%(+0.628)#1,202 |
| 31. | Bellaire | 0.73% | 0.21%(+0.522)#116 | 0.12%(+0.615)#1,203 |
| 32. | Oak Point | 0.71% | 0.21%(+0.494)#117 | 0.12%(+0.587)#1,204 |
| 33. | Cross Roads | 0.70% | 0.21%(+0.487)#118 | 0.12%(+0.580)#1,205 |
| 34. | Sachse | 0.67% | 0.21%(+0.456)#119 | 0.12%(+0.549)#1,206 |
| 35. | Lewisville | 0.66% | 0.21%(+0.446)#120 | 0.12%(+0.540)#1,207 |
| 36. | Pflugerville | 0.65% | 0.21%(+0.440)#121 | 0.12%(+0.533)#1,208 |
| 37. | Wylie | 0.64% | 0.21%(+0.425)#122 | 0.12%(+0.519)#1,209 |
| 38. | Roanoke | 0.64% | 0.21%(+0.425)#123 | 0.12%(+0.519)#1,210 |
| 39. | Hilshire Village | 0.64% | 0.21%(+0.424)#124 | 0.12%(+0.518)#1,211 |
| 40. | Beeville | 0.63% | 0.21%(+0.418)#125 | 0.12%(+0.512)#1,212 |
| 41. | Pecan Grove | 0.61% | 0.21%(+0.402)#126 | 0.12%(+0.496)#1,213 |
| 42. | Hurst | 0.61% | 0.21%(+0.394)#127 | 0.12%(+0.488)#1,214 |
| 43. | Lost Creek | 0.60% | 0.21%(+0.391)#128 | 0.12%(+0.485)#1,215 |
| 44. | New Summerfield | 0.60% | 0.21%(+0.386)#129 | 0.12%(+0.480)#1,216 |
| 45. | Dalworthington Gardens | 0.57% | 0.21%(+0.362)#130 | 0.12%(+0.456)#1,217 |
| 46. | Waller | 0.55% | 0.21%(+0.340)#131 | 0.12%(+0.434)#1,218 |
| 47. | Pleasanton | 0.55% | 0.21%(+0.339)#132 | 0.12%(+0.432)#1,219 |
| 48. | Pearland | 0.52% | 0.21%(+0.310)#133 | 0.12%(+0.404)#1,220 |
| 49. | Northlake | 0.50% | 0.21%(+0.287)#134 | 0.12%(+0.381)#1,221 |
| 50. | Coppell | 0.49% | 0.21%(+0.277)#135 | 0.12%(+0.370)#1,222 |
| 51. | The Colony | 0.48% | 0.21%(+0.270)#136 | 0.12%(+0.364)#1,223 |
| 52. | Grapevine | 0.47% | 0.21%(+0.256)#137 | 0.12%(+0.350)#1,224 |
| 53. | Allen | 0.47% | 0.21%(+0.256)#138 | 0.12%(+0.350)#1,225 |
| 54. | Hackberry | 0.45% | 0.21%(+0.242)#139 | 0.12%(+0.335)#1,226 |
| 55. | Little Elm | 0.45% | 0.21%(+0.241)#140 | 0.12%(+0.335)#1,227 |
| 56. | Port Arthur | 0.45% | 0.21%(+0.236)#141 | 0.12%(+0.330)#1,228 |
| 57. | Eidson Road | 0.41% | 0.21%(+0.200)#142 | 0.12%(+0.294)#1,229 |
| 58. | Clear Lake Shores | 0.41% | 0.21%(+0.193)#143 | 0.12%(+0.287)#1,230 |
| 59. | Beaumont | 0.40% | 0.21%(+0.191)#144 | 0.12%(+0.284)#1,231 |
| 60. | Paloma Creek South | 0.40% | 0.21%(+0.185)#145 | 0.12%(+0.278)#1,232 |
| 61. | Rollingwood | 0.40% | 0.21%(+0.184)#146 | 0.12%(+0.277)#1,233 |
| 62. | Mount Pleasant | 0.39% | 0.21%(+0.173)#147 | 0.12%(+0.267)#1,234 |
| 63. | Piney Point Village | 0.39% | 0.21%(+0.173)#148 | 0.12%(+0.266)#1,235 |
| 64. | Mckinney | 0.38% | 0.21%(+0.168)#149 | 0.12%(+0.262)#1,236 |
| 65. | Sienna | 0.38% | 0.21%(+0.168)#150 | 0.12%(+0.261)#1,237 |
| 66. | League City | 0.38% | 0.21%(+0.165)#151 | 0.12%(+0.258)#1,238 |
| 67. | Sunset Valley | 0.36% | 0.21%(+0.143)#152 | 0.12%(+0.237)#1,239 |
| 68. | Llano | 0.36% | 0.21%(+0.143)#153 | 0.12%(+0.237)#1,240 |
| 69. | Bedford | 0.35% | 0.21%(+0.141)#154 | 0.12%(+0.235)#1,241 |
| 70. | Bay City | 0.35% | 0.21%(+0.140)#155 | 0.12%(+0.234)#1,242 |
| 71. | Cinco Ranch | 0.34% | 0.21%(+0.132)#156 | 0.12%(+0.226)#1,243 |
| 72. | Cedar Park | 0.34% | 0.21%(+0.131)#157 | 0.12%(+0.224)#1,244 |
| 73. | Travis Ranch | 0.33% | 0.21%(+0.119)#158 | 0.12%(+0.213)#1,245 |
| 74. | Parker | 0.32% | 0.21%(+0.110)#159 | 0.12%(+0.204)#1,246 |
| 75. | Houston | 0.30% | 0.21%(+0.092)#160 | 0.12%(+0.185)#1,247 |
| 76. | Hedwig Village | 0.30% | 0.21%(+0.089)#161 | 0.12%(+0.183)#1,248 |
| 77. | Lindale | 0.29% | 0.21%(+0.079)#162 | 0.12%(+0.173)#1,249 |
| 78. | Rowlett | 0.28% | 0.21%(+0.066)#163 | 0.12%(+0.159)#1,250 |
| 79. | Arlington | 0.28% | 0.21%(+0.064)#164 | 0.12%(+0.158)#1,251 |
| 80. | Round Rock | 0.26% | 0.21%(+0.047)#165 | 0.12%(+0.141)#1,252 |
| 81. | Shavano Park | 0.25% | 0.21%(+0.041)#166 | 0.12%(+0.135)#1,253 |
| 82. | Farmers Branch | 0.25% | 0.21%(+0.040)#167 | 0.12%(+0.134)#1,254 |
| 83. | Atascocita | 0.25% | 0.21%(+0.037)#168 | 0.12%(+0.130)#1,255 |
| 84. | The Woodlands | 0.24% | 0.21%(+0.024)#169 | 0.12%(+0.118)#1,256 |
| 85. | Memphis | 0.23% | 0.21%(+0.022)#170 | 0.12%(+0.116)#1,257 |
| 86. | Justin | 0.23% | 0.21%(+0.020)#171 | 0.12%(+0.114)#1,258 |
| 87. | Conroe | 0.23% | 0.21%(+0.018)#172 | 0.12%(+0.111)#1,259 |
| 88. | Kemah | 0.21% | 0.21%(-0.007)#173 | 0.12%(+0.087)#1,260 |
| 89. | Keller | 0.21% | 0.21%(-0.007)#174 | 0.12%(+0.086)#1,261 |
| 90. | North Richland Hills | 0.20% | 0.21%(-0.011)#175 | 0.12%(+0.082)#1,262 |
| 91. | Cedar Hill | 0.19% | 0.21%(-0.018)#176 | 0.12%(+0.076)#1,263 |
| 92. | Selma | 0.19% | 0.21%(-0.023)#177 | 0.12%(+0.071)#1,264 |
| 93. | Manor | 0.19% | 0.21%(-0.024)#178 | 0.12%(+0.070)#1,265 |
| 94. | College Station | 0.18% | 0.21%(-0.031)#179 | 0.12%(+0.063)#1,266 |
| 95. | Fort Worth | 0.18% | 0.21%(-0.036)#180 | 0.12%(+0.057)#1,267 |
| 96. | University Park | 0.17% | 0.21%(-0.038)#181 | 0.12%(+0.056)#1,268 |
| 97. | Leander | 0.17% | 0.21%(-0.043)#182 | 0.12%(+0.051)#1,269 |
| 98. | Baytown | 0.17% | 0.21%(-0.044)#183 | 0.12%(+0.049)#1,270 |
| 99. | Odessa | 0.17% | 0.21%(-0.045)#184 | 0.12%(+0.049)#1,271 |
| 100. | Flatonia | 0.17% | 0.21%(-0.046)#185 | 0.12%(+0.048)#1,272 |
Common Questions
What are the Top 10 Cities with the Highest Percentage of Immigrants from Pakistan in Texas?
Top 10 Cities with the Highest Percentage of Immigrants from Pakistan in Texas are:
#1
5.42%
#2
4.70%
#3
3.77%
#4
2.26%
#5
1.76%
#6
1.69%
#7
1.61%
#8
1.51%
#9
1.38%
#10
1.36%
What city has the Highest Percentage of Immigrants from Pakistan in Texas?
Meadows Place has the Highest Percentage of Immigrants from Pakistan in Texas with 5.42%.
What is the Percentage of Immigrants from Pakistan in the State of Texas?
Percentage of Immigrants from Pakistan in Texas is 0.21%.
What is the Percentage of Immigrants from Pakistan in the United States?
Percentage of Immigrants from Pakistan in the United States is 0.12%.