Cities with the Highest Percentage of Immigrants from Central America in Texas
RELATED REPORTS & OPTIONS
Central America
Texas
Compare Cities
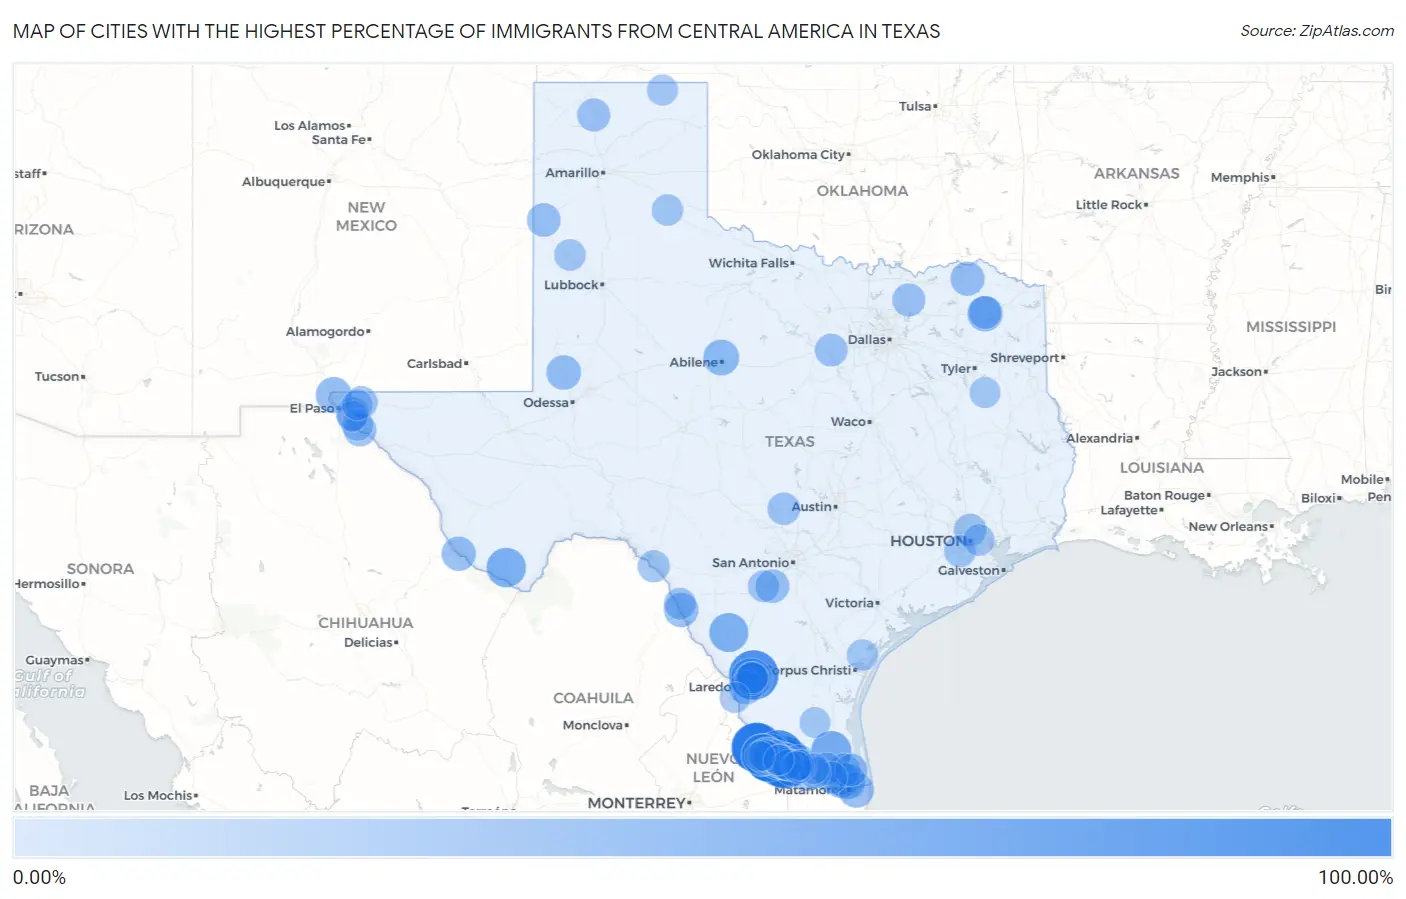
Map of Cities with the Highest Percentage of Immigrants from Central America in Texas
0.00%
100.00%
Cities with the Highest Percentage of Immigrants from Central America in Texas
| City | Central America | vs State | vs National | |
| 1. | B And E | 100.00% | 9.95%(+90.0)#-1 | 4.37%(+95.6)#0 |
| 2. | Manuel Garcia | 100.00% | 9.95%(+90.0)#0 | 4.37%(+95.6)#1 |
| 3. | La Chuparosa | 100.00% | 9.95%(+90.0)#1 | 4.37%(+95.6)#2 |
| 4. | El Socio | 100.00% | 9.95%(+90.0)#2 | 4.37%(+95.6)#3 |
| 5. | Victoria Vera | 100.00% | 9.95%(+90.0)#3 | 4.37%(+95.6)#4 |
| 6. | Falconaire | 100.00% | 9.95%(+90.0)#4 | 4.37%(+95.6)#5 |
| 7. | Palo Blanco | 100.00% | 9.95%(+90.0)#5 | 4.37%(+95.6)#6 |
| 8. | Chapeno | 100.00% | 9.95%(+90.0)#6 | 4.37%(+95.6)#7 |
| 9. | Rafael Pena | 100.00% | 9.95%(+90.0)#7 | 4.37%(+95.6)#8 |
| 10. | Martinez | 100.00% | 9.95%(+90.0)#8 | 4.37%(+95.6)#9 |
| 11. | Hillside Acres | 100.00% | 9.95%(+90.0)#9 | 4.37%(+95.6)#10 |
| 12. | Campo Verde | 95.43% | 9.95%(+85.5)#10 | 4.37%(+91.1)#11 |
| 13. | Fluvanna | 83.33% | 9.95%(+73.4)#11 | 4.37%(+79.0)#12 |
| 14. | Ramos | 74.19% | 9.95%(+64.2)#12 | 4.37%(+69.8)#13 |
| 15. | Fronton Ranchettes | 70.71% | 9.95%(+60.8)#13 | 4.37%(+66.3)#14 |
| 16. | Los Veteranos I | 69.23% | 9.95%(+59.3)#14 | 4.37%(+64.9)#15 |
| 17. | Ranchette Estates | 66.47% | 9.95%(+56.5)#15 | 4.37%(+62.1)#16 |
| 18. | Havana | 63.71% | 9.95%(+53.8)#16 | 4.37%(+59.3)#17 |
| 19. | Study Butte | 62.92% | 9.95%(+53.0)#17 | 4.37%(+58.6)#18 |
| 20. | El Chaparral | 62.09% | 9.95%(+52.1)#18 | 4.37%(+57.7)#19 |
| 21. | Catarina | 61.54% | 9.95%(+51.6)#19 | 4.37%(+57.2)#20 |
| 22. | Pena | 58.67% | 9.95%(+48.7)#20 | 4.37%(+54.3)#21 |
| 23. | Gutierrez | 55.56% | 9.95%(+45.6)#21 | 4.37%(+51.2)#22 |
| 24. | Garceno | 55.22% | 9.95%(+45.3)#22 | 4.37%(+50.9)#23 |
| 25. | Chula Vista Cdp Cameron County | 54.55% | 9.95%(+44.6)#23 | 4.37%(+50.2)#24 |
| 26. | Westway | 50.37% | 9.95%(+40.4)#24 | 4.37%(+46.0)#25 |
| 27. | Impact | 50.00% | 9.95%(+40.0)#25 | 4.37%(+45.6)#26 |
| 28. | Olmito | 49.62% | 9.95%(+39.7)#26 | 4.37%(+45.3)#27 |
| 29. | Encantada Ranchito El Calaboz | 49.54% | 9.95%(+39.6)#27 | 4.37%(+45.2)#28 |
| 30. | Miller S Cove | 48.65% | 9.95%(+38.7)#28 | 4.37%(+44.3)#29 |
| 31. | South Point | 48.36% | 9.95%(+38.4)#29 | 4.37%(+44.0)#30 |
| 32. | La Moca Ranch | 47.06% | 9.95%(+37.1)#30 | 4.37%(+42.7)#31 |
| 33. | Las Lomas | 46.81% | 9.95%(+36.9)#31 | 4.37%(+42.4)#32 |
| 34. | Sunset Cdp Starr County | 46.67% | 9.95%(+36.7)#32 | 4.37%(+42.3)#33 |
| 35. | Los Arcos | 46.34% | 9.95%(+36.4)#33 | 4.37%(+42.0)#34 |
| 36. | Mckinney Acres | 45.74% | 9.95%(+35.8)#34 | 4.37%(+41.4)#35 |
| 37. | Las Quintas Fronterizas | 44.80% | 9.95%(+34.8)#35 | 4.37%(+40.4)#36 |
| 38. | Presidio | 44.41% | 9.95%(+34.5)#36 | 4.37%(+40.0)#37 |
| 39. | Alto Bonito Heights | 44.21% | 9.95%(+34.3)#37 | 4.37%(+39.8)#38 |
| 40. | Sun Valley | 44.00% | 9.95%(+34.0)#38 | 4.37%(+39.6)#39 |
| 41. | Pueblo Nuevo | 42.53% | 9.95%(+32.6)#39 | 4.37%(+38.2)#40 |
| 42. | Bovina | 42.38% | 9.95%(+32.4)#40 | 4.37%(+38.0)#41 |
| 43. | Bigfoot | 42.29% | 9.95%(+32.3)#41 | 4.37%(+37.9)#42 |
| 44. | Eugenio Saenz | 42.07% | 9.95%(+32.1)#42 | 4.37%(+37.7)#43 |
| 45. | Plum | 41.94% | 9.95%(+32.0)#43 | 4.37%(+37.6)#44 |
| 46. | Waka | 41.67% | 9.95%(+31.7)#44 | 4.37%(+37.3)#45 |
| 47. | La Esperanza | 41.18% | 9.95%(+31.2)#45 | 4.37%(+36.8)#46 |
| 48. | Citrus City | 40.86% | 9.95%(+30.9)#46 | 4.37%(+36.5)#47 |
| 49. | Arroyo Colorado Estates | 40.84% | 9.95%(+30.9)#47 | 4.37%(+36.5)#48 |
| 50. | Garciasville | 40.81% | 9.95%(+30.9)#48 | 4.37%(+36.4)#49 |
| 51. | Westminster | 40.77% | 9.95%(+30.8)#49 | 4.37%(+36.4)#50 |
| 52. | Sparks | 40.62% | 9.95%(+30.7)#50 | 4.37%(+36.2)#51 |
| 53. | Olivia Lopez De Gutierrez | 40.45% | 9.95%(+30.5)#51 | 4.37%(+36.1)#52 |
| 54. | Cactus | 40.36% | 9.95%(+30.4)#52 | 4.37%(+36.0)#53 |
| 55. | Ranchitos Las Lomas | 40.11% | 9.95%(+30.2)#53 | 4.37%(+35.7)#54 |
| 56. | Tornillo | 39.41% | 9.95%(+29.5)#54 | 4.37%(+35.0)#55 |
| 57. | Winfield | 39.39% | 9.95%(+29.4)#55 | 4.37%(+35.0)#56 |
| 58. | Butterfield | 39.38% | 9.95%(+29.4)#56 | 4.37%(+35.0)#57 |
| 59. | Los Alvarez | 39.23% | 9.95%(+29.3)#57 | 4.37%(+34.9)#58 |
| 60. | Western Lake | 38.94% | 9.95%(+29.0)#58 | 4.37%(+34.6)#59 |
| 61. | Aldine | 38.26% | 9.95%(+28.3)#59 | 4.37%(+33.9)#60 |
| 62. | Stonewall | 38.10% | 9.95%(+28.2)#60 | 4.37%(+33.7)#61 |
| 63. | Hidalgo | 38.06% | 9.95%(+28.1)#61 | 4.37%(+33.7)#62 |
| 64. | Chula Vista Cdp Maverick County | 38.04% | 9.95%(+28.1)#62 | 4.37%(+33.7)#63 |
| 65. | Airport Heights | 38.03% | 9.95%(+28.1)#63 | 4.37%(+33.7)#64 |
| 66. | Indian Hills | 37.83% | 9.95%(+27.9)#64 | 4.37%(+33.5)#65 |
| 67. | La Tina Ranch | 37.79% | 9.95%(+27.8)#65 | 4.37%(+33.4)#66 |
| 68. | Mikes | 37.68% | 9.95%(+27.7)#66 | 4.37%(+33.3)#67 |
| 69. | Sullivan City | 36.69% | 9.95%(+26.7)#67 | 4.37%(+32.3)#68 |
| 70. | Bluetown | 36.51% | 9.95%(+26.6)#68 | 4.37%(+32.1)#69 |
| 71. | Cienegas Terrace | 36.48% | 9.95%(+26.5)#69 | 4.37%(+32.1)#70 |
| 72. | Escobares | 36.31% | 9.95%(+26.4)#70 | 4.37%(+31.9)#71 |
| 73. | Elm Creek | 36.25% | 9.95%(+26.3)#71 | 4.37%(+31.9)#72 |
| 74. | Fifth Street | 36.11% | 9.95%(+26.2)#72 | 4.37%(+31.7)#73 |
| 75. | South Alamo | 35.89% | 9.95%(+25.9)#73 | 4.37%(+31.5)#74 |
| 76. | Moore | 35.48% | 9.95%(+25.5)#74 | 4.37%(+31.1)#75 |
| 77. | La Coma Heights | 35.47% | 9.95%(+25.5)#75 | 4.37%(+31.1)#76 |
| 78. | Colorado Acres | 35.14% | 9.95%(+25.2)#76 | 4.37%(+30.8)#77 |
| 79. | East Alto Bonito | 35.06% | 9.95%(+25.1)#77 | 4.37%(+30.7)#78 |
| 80. | Jacinto City | 34.92% | 9.95%(+25.0)#78 | 4.37%(+30.5)#79 |
| 81. | Camargito | 34.88% | 9.95%(+24.9)#79 | 4.37%(+30.5)#80 |
| 82. | Fabens | 34.75% | 9.95%(+24.8)#80 | 4.37%(+30.4)#81 |
| 83. | Amherst | 34.58% | 9.95%(+24.6)#81 | 4.37%(+30.2)#82 |
| 84. | Palmview | 34.44% | 9.95%(+24.5)#82 | 4.37%(+30.1)#83 |
| 85. | Lakeview | 34.21% | 9.95%(+24.3)#83 | 4.37%(+29.8)#84 |
| 86. | Roma | 34.16% | 9.95%(+24.2)#84 | 4.37%(+29.8)#85 |
| 87. | Tradewinds | 34.01% | 9.95%(+24.1)#85 | 4.37%(+29.6)#86 |
| 88. | West Sharyland | 32.95% | 9.95%(+23.0)#86 | 4.37%(+28.6)#87 |
| 89. | Perryton | 32.92% | 9.95%(+23.0)#87 | 4.37%(+28.5)#88 |
| 90. | Socorro | 32.64% | 9.95%(+22.7)#88 | 4.37%(+28.3)#89 |
| 91. | New Summerfield | 32.63% | 9.95%(+22.7)#89 | 4.37%(+28.3)#90 |
| 92. | Homestead Meadows South | 32.63% | 9.95%(+22.7)#90 | 4.37%(+28.3)#91 |
| 93. | Encino | 32.35% | 9.95%(+22.4)#91 | 4.37%(+28.0)#92 |
| 94. | North Alamo | 32.11% | 9.95%(+22.2)#92 | 4.37%(+27.7)#93 |
| 95. | El Cenizo | 32.08% | 9.95%(+22.1)#93 | 4.37%(+27.7)#94 |
| 96. | Nina | 31.46% | 9.95%(+21.5)#94 | 4.37%(+27.1)#95 |
| 97. | Doffing | 31.37% | 9.95%(+21.4)#95 | 4.37%(+27.0)#96 |
| 98. | Penitas | 31.16% | 9.95%(+21.2)#96 | 4.37%(+26.8)#97 |
| 99. | La Puerta | 30.95% | 9.95%(+21.0)#97 | 4.37%(+26.6)#98 |
| 100. | Guadalupe Guerra | 30.91% | 9.95%(+21.0)#98 | 4.37%(+26.5)#99 |
Common Questions
What are the Top 10 Cities with the Highest Percentage of Immigrants from Central America in Texas?
Top 10 Cities with the Highest Percentage of Immigrants from Central America in Texas are:
#1
100.00%
#2
100.00%
#3
100.00%
#4
100.00%
#5
100.00%
#6
100.00%
#7
100.00%
#8
100.00%
#9
100.00%
#10
100.00%
What city has the Highest Percentage of Immigrants from Central America in Texas?
B and E has the Highest Percentage of Immigrants from Central America in Texas with 100.00%.
What is the Percentage of Immigrants from Central America in the State of Texas?
Percentage of Immigrants from Central America in Texas is 9.95%.
What is the Percentage of Immigrants from Central America in the United States?
Percentage of Immigrants from Central America in the United States is 4.37%.