Cities with the Highest Percentage of Immigrants from Switzerland in Texas

RELATED REPORTS & OPTIONS

Switzerland
Population
Families and Households
Female Fertility
Female Fertility (Unmarried)
Race (Community Size)
Race (Percentage)
Ancestry (Community Size)
AfghanAfricanAlaska NativeAlaskan AthabascanAlbanianAleutAlsatianAmericanApacheArabArapahoArgentineanArmenianAssyrian / Chaldean / SyriacAustralianAustrianBahamianBangladeshiBarbadianBasqueBelgianBelizeanBermudanBhutaneseBlackfeetBolivianBrazilianBritishBritish West IndianBulgarianBurmeseCajunCambodianCanadianCape VerdeanCarpatho RusynCelticCentral AmericanCentral American IndianCherokeeCheyenneChickasawChileanChineseChippewaChoctawColombianColvilleComancheCosta RicanCreeCreekCroatianCrowCubanCypriotCzechCzechoslovakianDanishDelawareDominicanDutchDutch West IndianEastern EuropeanEcuadorianEgyptianEnglishEstonianEthiopianEuropeanFijianFilipinoFinnishFrenchFrench American IndianFrench CanadianGermanGerman RussianGhanaianGreekGuamanian / ChamorroGuatemalanGuyaneseHaitianHmongHonduranHopiHoumaHungarianIcelanderIndian (Asian)IndonesianInupiatIranianIraqiIrishIroquoisIsraeliItalianJamaicanJapaneseJordanianKenyanKiowaKoreanLaotianLatvianLebaneseLiberianLithuanianLumbeeLuxembourgerMacedonianMalaysianMalteseMarshalleseMenomineeMexicanMexican American IndianMongolianMoroccanNative HawaiianNavajoNepaleseNew ZealanderNicaraguanNigerianNorthern EuropeanNorwegianOkinawanOsageOttawaPaiutePakistaniPalestinianPanamanianParaguayanPennsylvania GermanPeruvianPimaPolishPortuguesePotawatomiPuebloPuerto RicanPuget Sound SalishRomanianRussianSalvadoranSamoanScandinavianScotch-IrishScottishSeminoleSenegaleseSerbianShoshoneSierra LeoneanSiouxSlavicSlovakSloveneSomaliSouth AfricanSouth AmericanSouth American IndianSoviet UnionSpaniardSpanishSpanish AmericanSpanish American IndianSri LankanSubsaharan AfricanSudaneseSwedishSwissSyrianTaiwaneseThaiTlingit-HaidaTohono O'OdhamTonganTrinidadian and TobagonianTsimshianTurkishU.S. Virgin IslanderUgandanUkrainianUruguayanUteVenezuelanVietnameseWelshWest IndianYakamaYaquiYugoslavianYumanYup'ikZimbabwean
Ancestry (Percentage)
AfghanAfricanAlaska NativeAlaskan AthabascanAlbanianAleutAlsatianAmericanApacheArabArapahoArgentineanArmenianAssyrian / Chaldean / SyriacAustralianAustrianBahamianBangladeshiBarbadianBasqueBelgianBelizeanBermudanBhutaneseBlackfeetBolivianBrazilianBritishBritish West IndianBulgarianBurmeseCajunCambodianCanadianCape VerdeanCarpatho RusynCelticCentral AmericanCentral American IndianCherokeeCheyenneChickasawChileanChineseChippewaChoctawColombianColvilleComancheCosta RicanCreeCreekCroatianCrowCubanCypriotCzechCzechoslovakianDanishDelawareDominicanDutchDutch West IndianEastern EuropeanEcuadorianEgyptianEnglishEstonianEthiopianEuropeanFijianFilipinoFinnishFrenchFrench American IndianFrench CanadianGermanGerman RussianGhanaianGreekGuamanian / ChamorroGuatemalanGuyaneseHaitianHmongHonduranHopiHoumaHungarianIcelanderIndian (Asian)IndonesianInupiatIranianIraqiIrishIroquoisIsraeliItalianJamaicanJapaneseJordanianKenyanKiowaKoreanLaotianLatvianLebaneseLiberianLithuanianLumbeeLuxembourgerMacedonianMalaysianMalteseMarshalleseMenomineeMexicanMexican American IndianMongolianMoroccanNative HawaiianNavajoNepaleseNew ZealanderNicaraguanNigerianNorthern EuropeanNorwegianOkinawanOsageOttawaPaiutePakistaniPalestinianPanamanianParaguayanPennsylvania GermanPeruvianPimaPolishPortuguesePotawatomiPuebloPuerto RicanPuget Sound SalishRomanianRussianSalvadoranSamoanScandinavianScotch-IrishScottishSeminoleSenegaleseSerbianShoshoneSierra LeoneanSiouxSlavicSlovakSloveneSomaliSouth AfricanSouth AmericanSouth American IndianSoviet UnionSpaniardSpanishSpanish AmericanSpanish American IndianSri LankanSubsaharan AfricanSudaneseSwedishSwissSyrianTaiwaneseThaiTlingit-HaidaTohono O'OdhamTonganTrinidadian and TobagonianTsimshianTurkishU.S. Virgin IslanderUgandanUkrainianUruguayanUteVenezuelanVietnameseWelshWest IndianYakamaYaquiYugoslavianYumanYup'ikZimbabwean
Immigrant Origin (Total)
AfghanistanAfricaAlbaniaArgentinaArmeniaAsiaAustraliaAustriaAzoresBahamasBangladeshBarbadosBelarusBelgiumBelizeBoliviaBosnia and HerzegovinaBrazilBulgariaBurma / MyanmarCabo VerdeCambodiaCameroonCanadaCaribbeanCentral AmericaChileChinaColombiaCongoCosta RicaCroatiaCubaCzechoslovakiaDenmarkDominicaDominican RepublicEastern AfricaEastern AsiaEastern EuropeEcuadorEgyptEl SalvadorEnglandEritreaEthiopiaEuropeFijiFranceGermanyGhanaGreeceGrenadaGuatemalaGuyanaHaitiHondurasHong KongHungaryIndiaIndonesiaIranIraqIrelandIsraelItalyJamaicaJapanJordanKazakhstanKenyaKoreaKuwaitLaosLatin AmericaLatviaLebanonLiberiaLithuaniaMalaysiaMexicoMicronesiaMiddle AfricaMoldovaMoroccoNepalNetherlandsNicaraguaNigeriaNorth MacedoniaNorthern AfricaNorthern EuropeNorwayOceaniaPakistanPanamaPeruPhilippinesPolandPortugalRomaniaRussiaSaudi ArabiaScotlandSenegalSerbiaSierra LeoneSingaporeSomaliaSouth AfricaSouth AmericaSouth Central AsiaSouth Eastern AsiaSouthern EuropeSpainSri LankaSt. Vincent and the GrenadinesSudanSwedenSwitzerlandSyriaTaiwanThailandTrinidad and TobagoTurkeyUgandaUkraineUruguayUzbekistanVenezuelaVietnamWest IndiesWestern AfricaWestern AsiaWestern EuropeYemenZaireZimbabwe
Immigrant Origin (Percentage)
AfghanistanAfricaAlbaniaArgentinaArmeniaAsiaAustraliaAustriaAzoresBahamasBangladeshBarbadosBelarusBelgiumBelizeBoliviaBosnia and HerzegovinaBrazilBulgariaBurma / MyanmarCabo VerdeCambodiaCameroonCanadaCaribbeanCentral AmericaChileChinaColombiaCongoCosta RicaCroatiaCubaCzechoslovakiaDenmarkDominicaDominican RepublicEastern AfricaEastern AsiaEastern EuropeEcuadorEgyptEl SalvadorEnglandEritreaEthiopiaEuropeFijiFranceGermanyGhanaGreeceGrenadaGuatemalaGuyanaHaitiHondurasHong KongHungaryIndiaIndonesiaIranIraqIrelandIsraelItalyJamaicaJapanJordanKazakhstanKenyaKoreaKuwaitLaosLatin AmericaLatviaLebanonLiberiaLithuaniaMalaysiaMexicoMicronesiaMiddle AfricaMoldovaMoroccoNepalNetherlandsNicaraguaNigeriaNorth MacedoniaNorthern AfricaNorthern EuropeNorwayOceaniaPakistanPanamaPeruPhilippinesPolandPortugalRomaniaRussiaSaudi ArabiaScotlandSenegalSerbiaSierra LeoneSingaporeSomaliaSouth AfricaSouth AmericaSouth Central AsiaSouth Eastern AsiaSouthern EuropeSpainSri LankaSt. Vincent and the GrenadinesSudanSwedenSwitzerlandSyriaTaiwanThailandTrinidad and TobagoTurkeyUgandaUkraineUruguayUzbekistanVenezuelaVietnamWest IndiesWestern AfricaWestern AsiaWestern EuropeYemenZaireZimbabwe
Income
Income (Families)
Income (Households)
Poverty
Poverty (Families)
Unemployment
Employment Occupations
Employment Industries
Employer Class
Commute Time
Commute Means
School Enrollment
Education by Degree Field
Occupancy
Finances
Physical Characteristics
Texas
Compare Cities
Comparison Subject

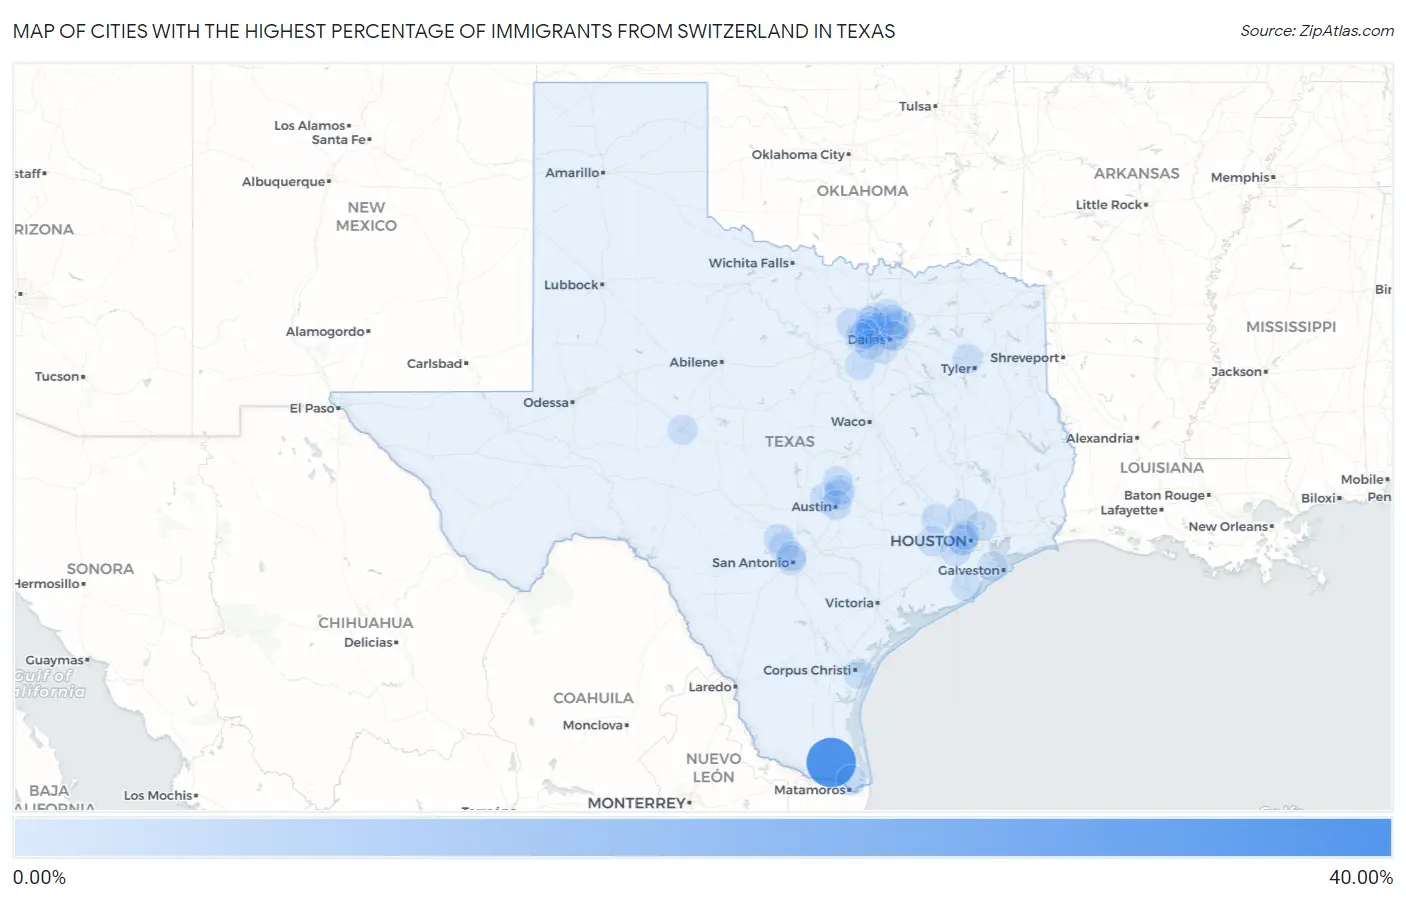
Map of Cities with the Highest Percentage of Immigrants from Switzerland in Texas

0.00%
40.00%
Cities with the Highest Percentage of Immigrants from Switzerland in Texas Map

Cities with the Highest Percentage of Immigrants from Switzerland in Texas

City Switzerland vs State vs National
1.Yznaga31.82%0.0064%(+31.8)#10.011%(+31.8)#1
2.Cross Mountain0.53%0.0064%(+0.524)#20.011%(+0.519)#79
3.Newark0.49%0.0064%(+0.481)#30.011%(+0.476)#91
4.Brazos Country0.34%0.0064%(+0.338)#40.011%(+0.333)#133
5.Hunters Creek Village0.32%0.0064%(+0.313)#50.011%(+0.308)#147
6.Boerne0.23%0.0064%(+0.221)#60.011%(+0.216)#213
7.Lindale0.23%0.0064%(+0.220)#70.011%(+0.215)#214
8.Hudson Bend0.22%0.0064%(+0.211)#80.011%(+0.207)#224
9.Keene0.22%0.0064%(+0.211)#90.011%(+0.206)#225
10.Piney Point Village0.16%0.0064%(+0.154)#100.011%(+0.149)#304
11.Highland Village0.13%0.0064%(+0.120)#110.011%(+0.115)#363
12.Castle Hills0.13%0.0064%(+0.119)#120.011%(+0.114)#365
13.Wells Branch0.12%0.0064%(+0.116)#130.011%(+0.111)#372
14.Southlake0.097%0.0064%(+0.091)#140.011%(+0.086)#418
15.Murphy0.096%0.0064%(+0.089)#150.011%(+0.084)#422
16.The Woodlands0.076%0.0064%(+0.070)#160.011%(+0.065)#485
17.La Marque0.049%0.0064%(+0.042)#170.011%(+0.037)#602
18.Colleyville0.046%0.0064%(+0.040)#180.011%(+0.035)#618
19.Bedford0.044%0.0064%(+0.038)#190.011%(+0.033)#630
20.Round Rock0.040%0.0064%(+0.033)#200.011%(+0.029)#662
21.University Park0.040%0.0064%(+0.033)#210.011%(+0.028)#663
22.Georgetown0.039%0.0064%(+0.033)#220.011%(+0.028)#667
23.Duncanville0.037%0.0064%(+0.031)#230.011%(+0.026)#679
24.Austin0.031%0.0064%(+0.025)#240.011%(+0.020)#724
25.North Richland Hills0.029%0.0064%(+0.022)#250.011%(+0.017)#751
26.Coppell0.028%0.0064%(+0.022)#260.011%(+0.017)#754
27.Atascocita0.026%0.0064%(+0.019)#270.011%(+0.014)#782
28.Lake Jackson0.025%0.0064%(+0.019)#280.011%(+0.014)#793
29.San Angelo0.018%0.0064%(+0.012)#290.011%(+0.007)#861
30.Corpus Christi0.015%0.0064%(+0.009)#300.011%(+0.004)#894
31.Richardson0.014%0.0064%(+0.008)#310.011%(+0.003)#905
32.Plano0.013%0.0064%(+0.007)#320.011%(+0.002)#916
33.Prairie View0.012%0.0064%(+0.006)#330.011%(+0.001)#925
34.Frisco0.011%0.0064%(+0.005)#340.011%(+0.000)#936
35.Dallas0.010%0.0064%(+0.004)#350.011%(-0.001)#946
36.Sugar Land0.0100%0.0064%(+0.004)#360.011%(-0.001)#950
37.Houston0.0094%0.0064%(+0.003)#370.011%(-0.002)#957
38.Flower Mound0.0091%0.0064%(+0.003)#380.011%(-0.002)#962
39.Fort Worth0.0074%0.0064%(+0.001)#390.011%(-0.004)#982
40.Brownsville0.0027%0.0064%(-0.004)#400.011%(-0.009)#1,039
41.San Antonio0.0022%0.0064%(-0.004)#410.011%(-0.009)#1,043
42.Arlington0.0020%0.0064%(-0.004)#420.011%(-0.009)#1,044

Common Questions

What are the Top 10 Cities with the Highest Percentage of Immigrants from Switzerland in Texas?
Top 10 Cities with the Highest Percentage of Immigrants from Switzerland in Texas are:
What city has the Highest Percentage of Immigrants from Switzerland in Texas?
Yznaga has the Highest Percentage of Immigrants from Switzerland in Texas with 31.82%.
What is the Percentage of Immigrants from Switzerland in the State of Texas?
Percentage of Immigrants from Switzerland in Texas is 0.0064%.
What is the Percentage of Immigrants from Switzerland in the United States?
Percentage of Immigrants from Switzerland in the United States is 0.011%.