Cities with the Most Immigrants from Iran in Texas
RELATED REPORTS & OPTIONS
Iran
Texas
Compare Cities
Map of Cities with the Most Immigrants from Iran in Texas
0
6,000
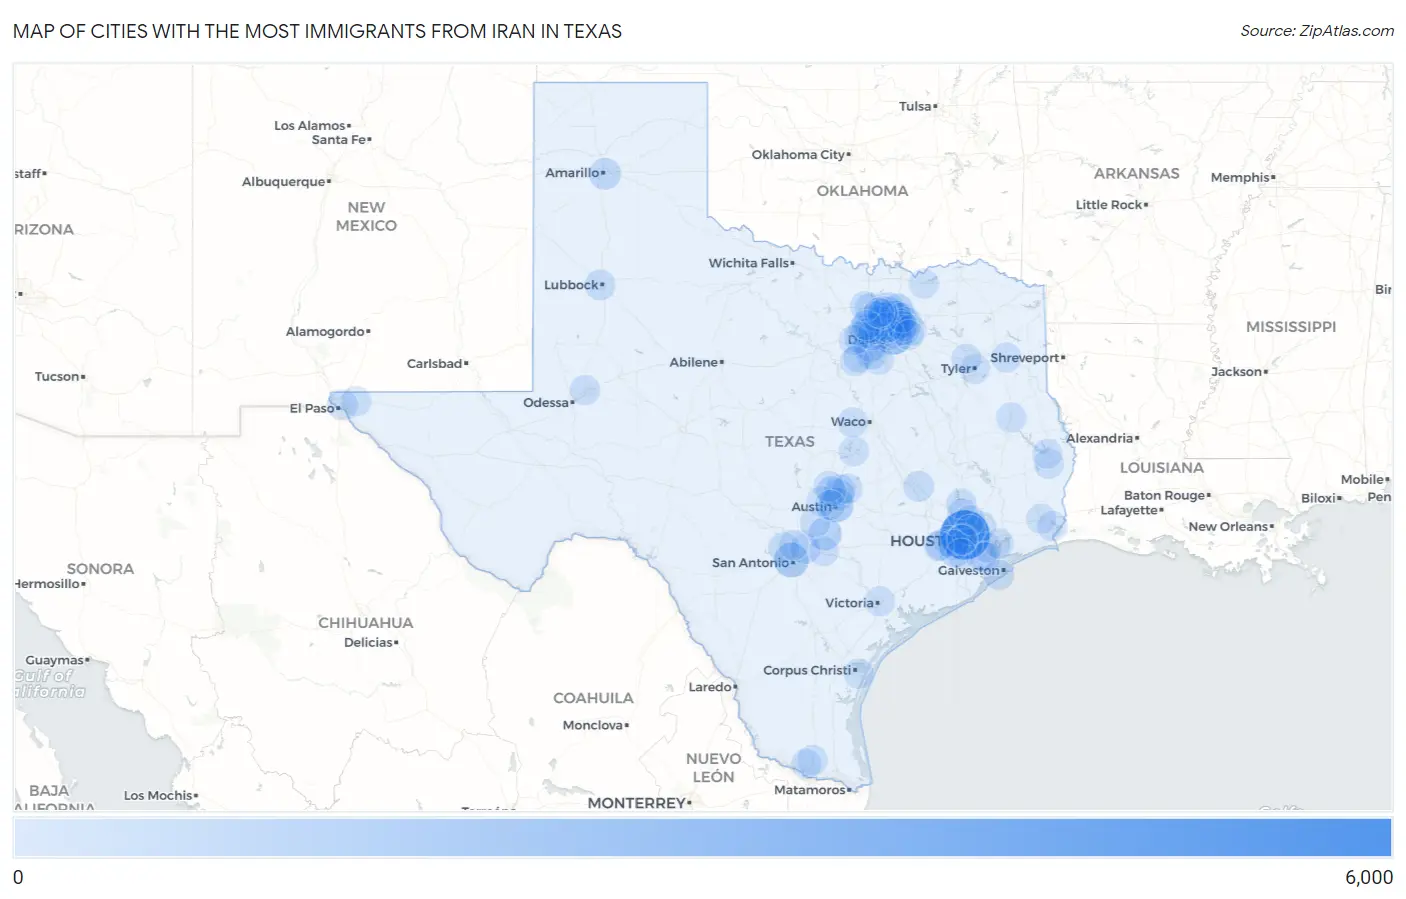
Cities with the Most Immigrants from Iran in Texas
| City | Iran | vs State | vs National | |
| 1. | Houston | 5,634 | 28,963(19.45%)#1 | 391,354(1.44%)#7 |
| 2. | Plano | 2,596 | 28,963(8.96%)#2 | 391,354(0.66%)#11 |
| 3. | Dallas | 1,897 | 28,963(6.55%)#3 | 391,354(0.48%)#16 |
| 4. | San Antonio | 1,294 | 28,963(4.47%)#4 | 391,354(0.33%)#23 |
| 5. | Austin | 1,216 | 28,963(4.20%)#5 | 391,354(0.31%)#28 |
| 6. | Frisco | 1,122 | 28,963(3.87%)#6 | 391,354(0.29%)#33 |
| 7. | San Marcos | 815 | 28,963(2.81%)#7 | 391,354(0.21%)#53 |
| 8. | Arlington | 770 | 28,963(2.66%)#8 | 391,354(0.20%)#58 |
| 9. | Mckinney | 641 | 28,963(2.21%)#9 | 391,354(0.16%)#72 |
| 10. | Sugar Land | 514 | 28,963(1.77%)#10 | 391,354(0.13%)#97 |
| 11. | Amarillo | 448 | 28,963(1.55%)#11 | 391,354(0.11%)#114 |
| 12. | Flower Mound | 356 | 28,963(1.23%)#12 | 391,354(0.09%)#149 |
| 13. | Irving | 344 | 28,963(1.19%)#13 | 391,354(0.09%)#154 |
| 14. | Richardson | 335 | 28,963(1.16%)#14 | 391,354(0.09%)#161 |
| 15. | Allen | 308 | 28,963(1.06%)#15 | 391,354(0.08%)#172 |
| 16. | Wells Branch | 277 | 28,963(0.96%)#16 | 391,354(0.07%)#201 |
| 17. | Garland | 262 | 28,963(0.90%)#17 | 391,354(0.07%)#211 |
| 18. | Mansfield | 241 | 28,963(0.83%)#18 | 391,354(0.06%)#235 |
| 19. | Fort Worth | 236 | 28,963(0.81%)#19 | 391,354(0.06%)#241 |
| 20. | College Station | 204 | 28,963(0.70%)#20 | 391,354(0.05%)#279 |
| 21. | Lubbock | 198 | 28,963(0.68%)#21 | 391,354(0.05%)#288 |
| 22. | Keller | 188 | 28,963(0.65%)#22 | 391,354(0.05%)#298 |
| 23. | Fulshear | 188 | 28,963(0.65%)#23 | 391,354(0.05%)#299 |
| 24. | Cross Mountain | 175 | 28,963(0.60%)#24 | 391,354(0.04%)#316 |
| 25. | The Woodlands | 165 | 28,963(0.57%)#25 | 391,354(0.04%)#333 |
| 26. | Carrollton | 156 | 28,963(0.54%)#26 | 391,354(0.04%)#351 |
| 27. | Wylie | 156 | 28,963(0.54%)#27 | 391,354(0.04%)#353 |
| 28. | Round Rock | 153 | 28,963(0.53%)#28 | 391,354(0.04%)#362 |
| 29. | Cinco Ranch | 153 | 28,963(0.53%)#29 | 391,354(0.04%)#363 |
| 30. | Friendswood | 146 | 28,963(0.50%)#30 | 391,354(0.04%)#382 |
| 31. | El Paso | 143 | 28,963(0.49%)#31 | 391,354(0.04%)#389 |
| 32. | Galveston | 138 | 28,963(0.48%)#32 | 391,354(0.04%)#397 |
| 33. | Denton | 134 | 28,963(0.46%)#33 | 391,354(0.03%)#409 |
| 34. | Leander | 125 | 28,963(0.43%)#34 | 391,354(0.03%)#431 |
| 35. | West University Place | 121 | 28,963(0.42%)#35 | 391,354(0.03%)#450 |
| 36. | Rowlett | 112 | 28,963(0.39%)#36 | 391,354(0.03%)#480 |
| 37. | Lewisville | 110 | 28,963(0.38%)#37 | 391,354(0.03%)#487 |
| 38. | Coppell | 104 | 28,963(0.36%)#38 | 391,354(0.03%)#506 |
| 39. | Murphy | 98 | 28,963(0.34%)#39 | 391,354(0.03%)#533 |
| 40. | Conroe | 82 | 28,963(0.28%)#40 | 391,354(0.02%)#614 |
| 41. | The Colony | 81 | 28,963(0.28%)#41 | 391,354(0.02%)#624 |
| 42. | Hutto | 79 | 28,963(0.27%)#42 | 391,354(0.02%)#637 |
| 43. | Grapevine | 76 | 28,963(0.26%)#43 | 391,354(0.02%)#657 |
| 44. | League City | 75 | 28,963(0.26%)#44 | 391,354(0.02%)#662 |
| 45. | Rockwall | 74 | 28,963(0.26%)#45 | 391,354(0.02%)#671 |
| 46. | Prosper | 73 | 28,963(0.25%)#46 | 391,354(0.02%)#684 |
| 47. | Jasper | 73 | 28,963(0.25%)#47 | 391,354(0.02%)#687 |
| 48. | Garden Ridge | 73 | 28,963(0.25%)#48 | 391,354(0.02%)#688 |
| 49. | Midland | 64 | 28,963(0.22%)#49 | 391,354(0.02%)#743 |
| 50. | Pasadena | 54 | 28,963(0.19%)#50 | 391,354(0.01%)#830 |
| 51. | Edinburg | 54 | 28,963(0.19%)#51 | 391,354(0.01%)#831 |
| 52. | Sachse | 52 | 28,963(0.18%)#52 | 391,354(0.01%)#855 |
| 53. | Beach City | 52 | 28,963(0.18%)#53 | 391,354(0.01%)#859 |
| 54. | Burleson | 48 | 28,963(0.17%)#54 | 391,354(0.01%)#898 |
| 55. | Corpus Christi | 47 | 28,963(0.16%)#55 | 391,354(0.01%)#908 |
| 56. | Atascocita | 45 | 28,963(0.16%)#56 | 391,354(0.01%)#937 |
| 57. | Euless | 44 | 28,963(0.15%)#57 | 391,354(0.01%)#948 |
| 58. | Bunker Hill Village | 43 | 28,963(0.15%)#58 | 391,354(0.01%)#969 |
| 59. | Mcallen | 39 | 28,963(0.13%)#59 | 391,354(0.01%)#1,016 |
| 60. | University Park | 39 | 28,963(0.13%)#60 | 391,354(0.01%)#1,020 |
| 61. | Tyler | 38 | 28,963(0.13%)#61 | 391,354(0.01%)#1,033 |
| 62. | Timberwood Park | 38 | 28,963(0.13%)#62 | 391,354(0.01%)#1,039 |
| 63. | Temple | 36 | 28,963(0.12%)#63 | 391,354(0.01%)#1,064 |
| 64. | Addison | 36 | 28,963(0.12%)#64 | 391,354(0.01%)#1,072 |
| 65. | Hedwig Village | 35 | 28,963(0.12%)#65 | 391,354(0.01%)#1,096 |
| 66. | Hickory Creek | 33 | 28,963(0.11%)#66 | 391,354(0.01%)#1,138 |
| 67. | Southlake | 32 | 28,963(0.11%)#67 | 391,354(0.01%)#1,145 |
| 68. | North Richland Hills | 31 | 28,963(0.11%)#68 | 391,354(0.01%)#1,160 |
| 69. | Spring | 31 | 28,963(0.11%)#69 | 391,354(0.01%)#1,162 |
| 70. | Little Elm | 31 | 28,963(0.11%)#70 | 391,354(0.01%)#1,166 |
| 71. | Lakeway | 31 | 28,963(0.11%)#71 | 391,354(0.01%)#1,176 |
| 72. | Aldine | 31 | 28,963(0.11%)#72 | 391,354(0.01%)#1,179 |
| 73. | Westworth Village | 30 | 28,963(0.10%)#73 | 391,354(0.01%)#1,213 |
| 74. | Piney Point Village | 29 | 28,963(0.10%)#74 | 391,354(0.01%)#1,233 |
| 75. | Longview | 28 | 28,963(0.10%)#75 | 391,354(0.01%)#1,237 |
| 76. | Mission Bend | 28 | 28,963(0.10%)#76 | 391,354(0.01%)#1,240 |
| 77. | Cedar Park | 27 | 28,963(0.09%)#77 | 391,354(0.01%)#1,266 |
| 78. | Nacogdoches | 27 | 28,963(0.09%)#78 | 391,354(0.01%)#1,276 |
| 79. | Lucas | 27 | 28,963(0.09%)#79 | 391,354(0.01%)#1,289 |
| 80. | Homestead Meadows North | 26 | 28,963(0.09%)#80 | 391,354(0.01%)#1,317 |
| 81. | Missouri City | 24 | 28,963(0.08%)#81 | 391,354(0.01%)#1,349 |
| 82. | Bonham | 23 | 28,963(0.08%)#82 | 391,354(0.01%)#1,377 |
| 83. | Weston Lakes | 22 | 28,963(0.08%)#83 | 391,354(0.01%)#1,409 |
| 84. | Seguin | 21 | 28,963(0.07%)#84 | 391,354(0.01%)#1,423 |
| 85. | Midlothian | 20 | 28,963(0.07%)#85 | 391,354(0.01%)#1,444 |
| 86. | Joshua | 20 | 28,963(0.07%)#86 | 391,354(0.01%)#1,457 |
| 87. | Hackberry | 20 | 28,963(0.07%)#87 | 391,354(0.01%)#1,464 |
| 88. | Victoria | 19 | 28,963(0.07%)#88 | 391,354(0.00%)#1,473 |
| 89. | Krum | 19 | 28,963(0.07%)#89 | 391,354(0.00%)#1,496 |
| 90. | Westlake | 19 | 28,963(0.07%)#90 | 391,354(0.00%)#1,504 |
| 91. | Port Neches | 18 | 28,963(0.06%)#91 | 391,354(0.00%)#1,529 |
| 92. | Beaumont | 16 | 28,963(0.06%)#92 | 391,354(0.00%)#1,585 |
| 93. | Oak Point | 16 | 28,963(0.06%)#93 | 391,354(0.00%)#1,611 |
| 94. | Crawford | 15 | 28,963(0.05%)#94 | 391,354(0.00%)#1,651 |
| 95. | Heath | 14 | 28,963(0.05%)#95 | 391,354(0.00%)#1,675 |
| 96. | Hideaway | 14 | 28,963(0.05%)#96 | 391,354(0.00%)#1,688 |
| 97. | Woodcreek | 14 | 28,963(0.05%)#97 | 391,354(0.00%)#1,692 |
| 98. | Lost Creek | 14 | 28,963(0.05%)#98 | 391,354(0.00%)#1,697 |
| 99. | Sienna | 13 | 28,963(0.04%)#99 | 391,354(0.00%)#1,713 |
| 100. | Sam Rayburn | 13 | 28,963(0.04%)#100 | 391,354(0.00%)#1,739 |
Common Questions
What are the Top 10 Cities with the Most Immigrants from Iran in Texas?
Top 10 Cities with the Most Immigrants from Iran in Texas are:
#1
5,634
#2
2,596
#3
1,897
#4
1,294
#5
1,216
#6
1,122
#7
815
#8
770
#9
641
#10
514
What city has the Most Immigrants from Iran in Texas?
Houston has the Most Immigrants from Iran in Texas with 5,634.
What is the Total Immigrants from Iran in the State of Texas?
Total Immigrants from Iran in Texas is 28,963.
What is the Total Immigrants from Iran in the United States?
Total Immigrants from Iran in the United States is 391,354.