Cities with the Most Immigrants from Japan in Texas
RELATED REPORTS & OPTIONS
Japan
Texas
Compare Cities
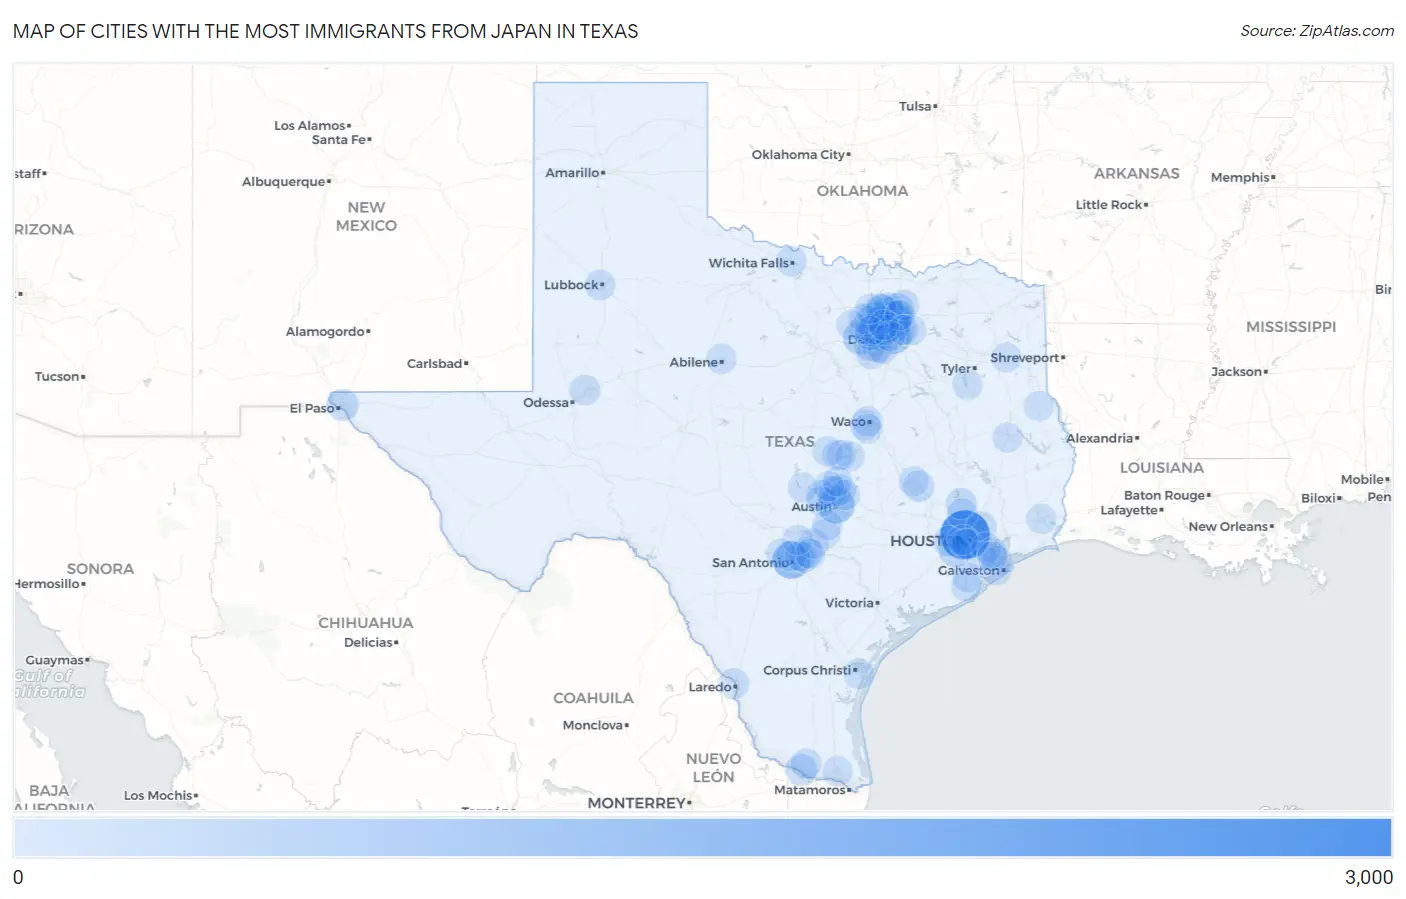
Map of Cities with the Most Immigrants from Japan in Texas
0
3,000
Cities with the Most Immigrants from Japan in Texas
| City | Japan | vs State | vs National | |
| 1. | Houston | 2,819 | 17,796(15.84%)#1 | 342,380(0.82%)#10 |
| 2. | San Antonio | 1,103 | 17,796(6.20%)#2 | 342,380(0.32%)#24 |
| 3. | Austin | 958 | 17,796(5.38%)#3 | 342,380(0.28%)#29 |
| 4. | Plano | 918 | 17,796(5.16%)#4 | 342,380(0.27%)#31 |
| 5. | Dallas | 726 | 17,796(4.08%)#5 | 342,380(0.21%)#50 |
| 6. | Coppell | 616 | 17,796(3.46%)#6 | 342,380(0.18%)#66 |
| 7. | Fort Worth | 540 | 17,796(3.03%)#7 | 342,380(0.16%)#81 |
| 8. | Frisco | 521 | 17,796(2.93%)#8 | 342,380(0.15%)#86 |
| 9. | Mckinney | 442 | 17,796(2.48%)#9 | 342,380(0.13%)#103 |
| 10. | Irving | 352 | 17,796(1.98%)#10 | 342,380(0.10%)#135 |
| 11. | Little Elm | 344 | 17,796(1.93%)#11 | 342,380(0.10%)#138 |
| 12. | Allen | 288 | 17,796(1.62%)#12 | 342,380(0.08%)#175 |
| 13. | Sugar Land | 267 | 17,796(1.50%)#13 | 342,380(0.08%)#199 |
| 14. | El Paso | 266 | 17,796(1.49%)#14 | 342,380(0.08%)#201 |
| 15. | Mission | 247 | 17,796(1.39%)#15 | 342,380(0.07%)#220 |
| 16. | Arlington | 231 | 17,796(1.30%)#16 | 342,380(0.07%)#231 |
| 17. | Round Rock | 192 | 17,796(1.08%)#17 | 342,380(0.06%)#280 |
| 18. | College Station | 184 | 17,796(1.03%)#18 | 342,380(0.05%)#299 |
| 19. | Conroe | 169 | 17,796(0.95%)#19 | 342,380(0.05%)#333 |
| 20. | Cinco Ranch | 134 | 17,796(0.75%)#20 | 342,380(0.04%)#415 |
| 21. | Laredo | 112 | 17,796(0.63%)#21 | 342,380(0.03%)#482 |
| 22. | Midland | 110 | 17,796(0.62%)#22 | 342,380(0.03%)#489 |
| 23. | Mansfield | 110 | 17,796(0.62%)#23 | 342,380(0.03%)#492 |
| 24. | Schertz | 109 | 17,796(0.61%)#24 | 342,380(0.03%)#498 |
| 25. | The Woodlands | 106 | 17,796(0.60%)#25 | 342,380(0.03%)#510 |
| 26. | Richardson | 104 | 17,796(0.58%)#26 | 342,380(0.03%)#522 |
| 27. | Killeen | 103 | 17,796(0.58%)#27 | 342,380(0.03%)#527 |
| 28. | Corinth | 102 | 17,796(0.57%)#28 | 342,380(0.03%)#534 |
| 29. | Garland | 100 | 17,796(0.56%)#29 | 342,380(0.03%)#540 |
| 30. | Mcallen | 97 | 17,796(0.55%)#30 | 342,380(0.03%)#556 |
| 31. | Grand Prairie | 92 | 17,796(0.52%)#31 | 342,380(0.03%)#576 |
| 32. | Cedar Park | 89 | 17,796(0.50%)#32 | 342,380(0.03%)#599 |
| 33. | Corpus Christi | 87 | 17,796(0.49%)#33 | 342,380(0.03%)#611 |
| 34. | Melissa | 86 | 17,796(0.48%)#34 | 342,380(0.03%)#619 |
| 35. | Lubbock | 75 | 17,796(0.42%)#35 | 342,380(0.02%)#680 |
| 36. | Wichita Falls | 71 | 17,796(0.40%)#36 | 342,380(0.02%)#712 |
| 37. | Flower Mound | 70 | 17,796(0.39%)#37 | 342,380(0.02%)#721 |
| 38. | Abilene | 68 | 17,796(0.38%)#38 | 342,380(0.02%)#732 |
| 39. | Highland Village | 65 | 17,796(0.37%)#39 | 342,380(0.02%)#767 |
| 40. | Bedford | 61 | 17,796(0.34%)#40 | 342,380(0.02%)#795 |
| 41. | Lewisville | 60 | 17,796(0.34%)#41 | 342,380(0.02%)#802 |
| 42. | Addison | 59 | 17,796(0.33%)#42 | 342,380(0.02%)#821 |
| 43. | Tiki Island | 58 | 17,796(0.33%)#43 | 342,380(0.02%)#842 |
| 44. | San Marcos | 57 | 17,796(0.32%)#44 | 342,380(0.02%)#846 |
| 45. | Texas City | 57 | 17,796(0.32%)#45 | 342,380(0.02%)#848 |
| 46. | Converse | 57 | 17,796(0.32%)#46 | 342,380(0.02%)#855 |
| 47. | Keller | 55 | 17,796(0.31%)#47 | 342,380(0.02%)#882 |
| 48. | Harlingen | 54 | 17,796(0.30%)#48 | 342,380(0.02%)#890 |
| 49. | Lake Jackson | 53 | 17,796(0.30%)#49 | 342,380(0.02%)#909 |
| 50. | Brushy Creek | 52 | 17,796(0.29%)#50 | 342,380(0.02%)#920 |
| 51. | Grapevine | 46 | 17,796(0.26%)#51 | 342,380(0.01%)#1,006 |
| 52. | Friendswood | 44 | 17,796(0.25%)#52 | 342,380(0.01%)#1,042 |
| 53. | Duncanville | 44 | 17,796(0.25%)#53 | 342,380(0.01%)#1,043 |
| 54. | Atascocita | 43 | 17,796(0.24%)#54 | 342,380(0.01%)#1,054 |
| 55. | Bryan | 43 | 17,796(0.24%)#55 | 342,380(0.01%)#1,055 |
| 56. | Prosper | 43 | 17,796(0.24%)#56 | 342,380(0.01%)#1,060 |
| 57. | Bellaire | 40 | 17,796(0.22%)#57 | 342,380(0.01%)#1,115 |
| 58. | Farmers Branch | 39 | 17,796(0.22%)#58 | 342,380(0.01%)#1,131 |
| 59. | Lufkin | 38 | 17,796(0.21%)#59 | 342,380(0.01%)#1,149 |
| 60. | Lago Vista | 38 | 17,796(0.21%)#60 | 342,380(0.01%)#1,155 |
| 61. | Northlake | 37 | 17,796(0.21%)#61 | 342,380(0.01%)#1,186 |
| 62. | Sienna | 35 | 17,796(0.20%)#62 | 342,380(0.01%)#1,213 |
| 63. | Pflugerville | 34 | 17,796(0.19%)#63 | 342,380(0.01%)#1,227 |
| 64. | Paloma Creek | 34 | 17,796(0.19%)#64 | 342,380(0.01%)#1,242 |
| 65. | Rockwall | 33 | 17,796(0.19%)#65 | 342,380(0.01%)#1,250 |
| 66. | Beaumont | 32 | 17,796(0.18%)#66 | 342,380(0.01%)#1,275 |
| 67. | Copperas Cove | 31 | 17,796(0.17%)#67 | 342,380(0.01%)#1,317 |
| 68. | Lakeway | 31 | 17,796(0.17%)#68 | 342,380(0.01%)#1,325 |
| 69. | West University Place | 31 | 17,796(0.17%)#69 | 342,380(0.01%)#1,326 |
| 70. | Pasadena | 30 | 17,796(0.17%)#70 | 342,380(0.01%)#1,341 |
| 71. | Fairview | 30 | 17,796(0.17%)#71 | 342,380(0.01%)#1,362 |
| 72. | Woodway | 30 | 17,796(0.17%)#72 | 342,380(0.01%)#1,364 |
| 73. | Castle Hills | 30 | 17,796(0.17%)#73 | 342,380(0.01%)#1,373 |
| 74. | Belterra | 29 | 17,796(0.16%)#74 | 342,380(0.01%)#1,406 |
| 75. | Windcrest | 29 | 17,796(0.16%)#75 | 342,380(0.01%)#1,408 |
| 76. | New Braunfels | 26 | 17,796(0.15%)#76 | 342,380(0.01%)#1,471 |
| 77. | Piney Point Village | 26 | 17,796(0.15%)#77 | 342,380(0.01%)#1,501 |
| 78. | Waco | 25 | 17,796(0.14%)#78 | 342,380(0.01%)#1,508 |
| 79. | Rowlett | 25 | 17,796(0.14%)#79 | 342,380(0.01%)#1,511 |
| 80. | Colleyville | 24 | 17,796(0.13%)#80 | 342,380(0.01%)#1,567 |
| 81. | Angleton | 24 | 17,796(0.13%)#81 | 342,380(0.01%)#1,571 |
| 82. | Bulverde | 24 | 17,796(0.13%)#82 | 342,380(0.01%)#1,582 |
| 83. | Shadybrook | 24 | 17,796(0.13%)#83 | 342,380(0.01%)#1,587 |
| 84. | Seabrook | 23 | 17,796(0.13%)#84 | 342,380(0.01%)#1,614 |
| 85. | Leander | 22 | 17,796(0.12%)#85 | 342,380(0.01%)#1,637 |
| 86. | Harker Heights | 22 | 17,796(0.12%)#86 | 342,380(0.01%)#1,642 |
| 87. | Highland Park | 22 | 17,796(0.12%)#87 | 342,380(0.01%)#1,666 |
| 88. | Hewitt | 21 | 17,796(0.12%)#88 | 342,380(0.01%)#1,700 |
| 89. | Bacliff | 21 | 17,796(0.12%)#89 | 342,380(0.01%)#1,715 |
| 90. | Belton | 20 | 17,796(0.11%)#90 | 342,380(0.01%)#1,755 |
| 91. | Center | 20 | 17,796(0.11%)#91 | 342,380(0.01%)#1,777 |
| 92. | Longview | 18 | 17,796(0.10%)#92 | 342,380(0.01%)#1,833 |
| 93. | Georgetown | 18 | 17,796(0.10%)#93 | 342,380(0.01%)#1,835 |
| 94. | Cibolo | 18 | 17,796(0.10%)#94 | 342,380(0.01%)#1,843 |
| 95. | Helotes | 18 | 17,796(0.10%)#95 | 342,380(0.01%)#1,868 |
| 96. | Carrollton | 17 | 17,796(0.10%)#96 | 342,380(0.00%)#1,887 |
| 97. | Denton | 16 | 17,796(0.09%)#97 | 342,380(0.00%)#1,951 |
| 98. | Pecan Acres | 16 | 17,796(0.09%)#98 | 342,380(0.00%)#1,997 |
| 99. | Cottonwood Shores | 16 | 17,796(0.09%)#99 | 342,380(0.00%)#2,006 |
| 100. | Kyle | 15 | 17,796(0.08%)#100 | 342,380(0.00%)#2,020 |
Common Questions
What are the Top 10 Cities with the Most Immigrants from Japan in Texas?
Top 10 Cities with the Most Immigrants from Japan in Texas are:
#1
2,819
#2
1,103
#3
958
#4
918
#5
726
#6
616
#7
540
#8
521
#9
442
#10
352
What city has the Most Immigrants from Japan in Texas?
Houston has the Most Immigrants from Japan in Texas with 2,819.
What is the Total Immigrants from Japan in the State of Texas?
Total Immigrants from Japan in Texas is 17,796.
What is the Total Immigrants from Japan in the United States?
Total Immigrants from Japan in the United States is 342,380.