Cities with the Highest Percentage of Population Employed in Enterprise Management in Texas
RELATED REPORTS & OPTIONS
Enterprise Management
Texas
Compare Cities
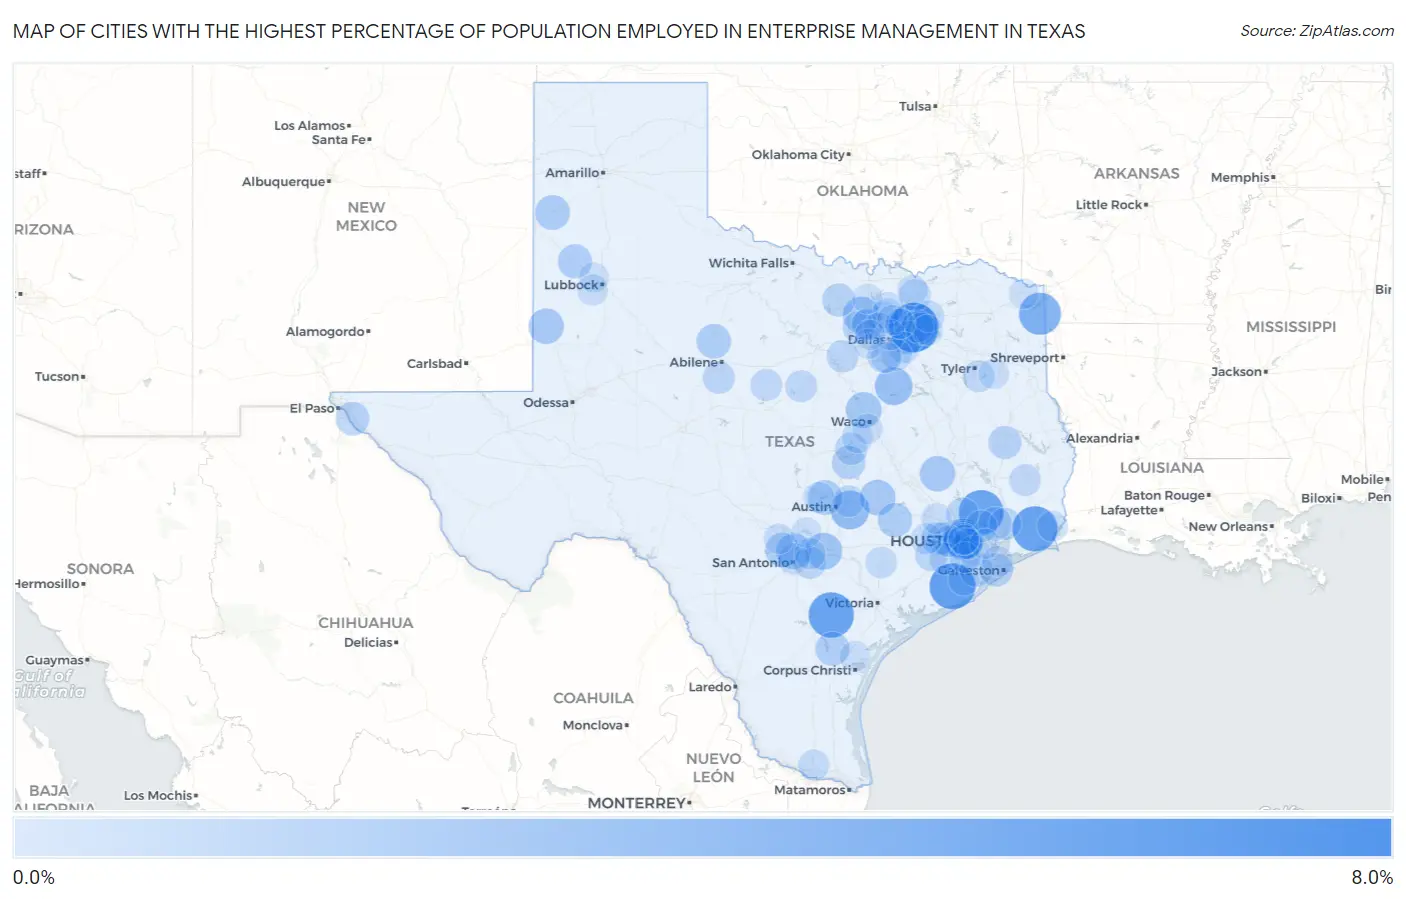
Map of Cities with the Highest Percentage of Population Employed in Enterprise Management in Texas
0.0%
8.0%
Cities with the Highest Percentage of Population Employed in Enterprise Management in Texas
| City | % Employed | vs State | vs National | |
| 1. | Fate | 6.3% | 0.18%(+6.07)#1 | 0.14%(+6.12)#38 |
| 2. | Sweeny | 5.1% | 0.18%(+4.96)#2 | 0.14%(+5.00)#52 |
| 3. | Pettus | 4.9% | 0.18%(+4.75)#3 | 0.14%(+4.79)#55 |
| 4. | Fannett | 4.9% | 0.18%(+4.71)#4 | 0.14%(+4.75)#56 |
| 5. | Woodbranch | 4.8% | 0.18%(+4.59)#5 | 0.14%(+4.63)#58 |
| 6. | Queen City | 3.9% | 0.18%(+3.74)#6 | 0.14%(+3.78)#82 |
| 7. | Spring Valley Village | 3.4% | 0.18%(+3.23)#7 | 0.14%(+3.27)#103 |
| 8. | Piney Point Village | 2.9% | 0.18%(+2.76)#8 | 0.14%(+2.80)#130 |
| 9. | Webberville | 2.9% | 0.18%(+2.72)#9 | 0.14%(+2.76)#135 |
| 10. | Blooming Grove | 2.6% | 0.18%(+2.43)#10 | 0.14%(+2.47)#168 |
| 11. | Seguin | 2.4% | 0.18%(+2.18)#11 | 0.14%(+2.22)#197 |
| 12. | Dish | 2.3% | 0.18%(+2.12)#12 | 0.14%(+2.16)#204 |
| 13. | Gholson | 2.0% | 0.18%(+1.85)#13 | 0.14%(+1.89)#240 |
| 14. | Lexington | 2.0% | 0.18%(+1.81)#14 | 0.14%(+1.85)#244 |
| 15. | Bedias | 1.9% | 0.18%(+1.76)#15 | 0.14%(+1.80)#253 |
| 16. | Hollywood Park | 1.9% | 0.18%(+1.74)#16 | 0.14%(+1.78)#259 |
| 17. | Denver City | 1.9% | 0.18%(+1.73)#17 | 0.14%(+1.78)#261 |
| 18. | Bunker Hill Village | 1.8% | 0.18%(+1.65)#18 | 0.14%(+1.69)#279 |
| 19. | Friona | 1.7% | 0.18%(+1.55)#19 | 0.14%(+1.60)#301 |
| 20. | Hudson Bend | 1.7% | 0.18%(+1.54)#20 | 0.14%(+1.58)#304 |
| 21. | Grey Forest | 1.7% | 0.18%(+1.51)#21 | 0.14%(+1.55)#309 |
| 22. | Anson | 1.7% | 0.18%(+1.47)#22 | 0.14%(+1.52)#320 |
| 23. | Round Top | 1.6% | 0.18%(+1.43)#23 | 0.14%(+1.47)#327 |
| 24. | Littlefield | 1.5% | 0.18%(+1.34)#24 | 0.14%(+1.39)#352 |
| 25. | Mathis | 1.5% | 0.18%(+1.33)#25 | 0.14%(+1.37)#357 |
| 26. | Travis Ranch | 1.4% | 0.18%(+1.26)#26 | 0.14%(+1.31)#379 |
| 27. | Clint | 1.4% | 0.18%(+1.21)#27 | 0.14%(+1.26)#395 |
| 28. | Liverpool | 1.4% | 0.18%(+1.18)#28 | 0.14%(+1.22)#411 |
| 29. | Salado | 1.3% | 0.18%(+1.15)#29 | 0.14%(+1.20)#417 |
| 30. | Dayton | 1.3% | 0.18%(+1.12)#30 | 0.14%(+1.17)#431 |
| 31. | Burke | 1.3% | 0.18%(+1.12)#31 | 0.14%(+1.17)#432 |
| 32. | Alvord | 1.3% | 0.18%(+1.09)#32 | 0.14%(+1.13)#444 |
| 33. | Tiki Island | 1.3% | 0.18%(+1.08)#33 | 0.14%(+1.12)#448 |
| 34. | Brookshire | 1.2% | 0.18%(+1.01)#34 | 0.14%(+1.05)#479 |
| 35. | Ovilla | 1.2% | 0.18%(+1.00)#35 | 0.14%(+1.04)#481 |
| 36. | Katy | 1.2% | 0.18%(+0.988)#36 | 0.14%(+1.03)#489 |
| 37. | Haslet | 1.0% | 0.18%(+0.868)#37 | 0.14%(+0.911)#551 |
| 38. | The Woodlands | 1.0% | 0.18%(+0.867)#38 | 0.14%(+0.910)#553 |
| 39. | Morgan S Point Resort | 1.0% | 0.18%(+0.862)#39 | 0.14%(+0.904)#555 |
| 40. | St Hedwig | 1.0% | 0.18%(+0.860)#40 | 0.14%(+0.902)#558 |
| 41. | Royse City | 1.0% | 0.18%(+0.825)#41 | 0.14%(+0.867)#587 |
| 42. | Tuscola | 0.99% | 0.18%(+0.809)#42 | 0.14%(+0.851)#606 |
| 43. | Southside Place | 0.98% | 0.18%(+0.797)#43 | 0.14%(+0.839)#614 |
| 44. | Cresson | 0.97% | 0.18%(+0.788)#44 | 0.14%(+0.830)#623 |
| 45. | East Bernard | 0.97% | 0.18%(+0.786)#45 | 0.14%(+0.829)#626 |
| 46. | Liberty | 0.95% | 0.18%(+0.765)#46 | 0.14%(+0.807)#641 |
| 47. | Lakeside Town Tarrant County | 0.94% | 0.18%(+0.760)#47 | 0.14%(+0.803)#646 |
| 48. | Dublin | 0.92% | 0.18%(+0.734)#48 | 0.14%(+0.777)#672 |
| 49. | Trenton | 0.90% | 0.18%(+0.717)#49 | 0.14%(+0.760)#691 |
| 50. | Rising Star | 0.87% | 0.18%(+0.689)#50 | 0.14%(+0.731)#711 |
| 51. | Whitehouse | 0.86% | 0.18%(+0.678)#51 | 0.14%(+0.720)#724 |
| 52. | Ivanhoe | 0.85% | 0.18%(+0.674)#52 | 0.14%(+0.716)#728 |
| 53. | Atascocita | 0.84% | 0.18%(+0.660)#53 | 0.14%(+0.702)#740 |
| 54. | Manor | 0.84% | 0.18%(+0.656)#54 | 0.14%(+0.698)#745 |
| 55. | Union Valley | 0.81% | 0.18%(+0.625)#55 | 0.14%(+0.668)#779 |
| 56. | Seagoville | 0.78% | 0.18%(+0.601)#56 | 0.14%(+0.644)#809 |
| 57. | Pleak | 0.78% | 0.18%(+0.600)#57 | 0.14%(+0.643)#810 |
| 58. | Cinco Ranch | 0.78% | 0.18%(+0.600)#58 | 0.14%(+0.642)#812 |
| 59. | Hallettsville | 0.77% | 0.18%(+0.588)#59 | 0.14%(+0.631)#829 |
| 60. | Brookside Village | 0.76% | 0.18%(+0.581)#60 | 0.14%(+0.624)#842 |
| 61. | Greenville | 0.76% | 0.18%(+0.575)#61 | 0.14%(+0.617)#850 |
| 62. | Alamo Heights | 0.72% | 0.18%(+0.535)#62 | 0.14%(+0.577)#903 |
| 63. | Sealy | 0.71% | 0.18%(+0.534)#63 | 0.14%(+0.576)#905 |
| 64. | The Colony | 0.69% | 0.18%(+0.514)#64 | 0.14%(+0.556)#938 |
| 65. | Cibolo | 0.69% | 0.18%(+0.510)#65 | 0.14%(+0.552)#946 |
| 66. | Ferris | 0.69% | 0.18%(+0.506)#66 | 0.14%(+0.548)#949 |
| 67. | Murillo | 0.67% | 0.18%(+0.485)#67 | 0.14%(+0.527)#972 |
| 68. | Hilshire Village | 0.65% | 0.18%(+0.470)#68 | 0.14%(+0.512)#998 |
| 69. | Moody | 0.63% | 0.18%(+0.450)#69 | 0.14%(+0.492)#1,029 |
| 70. | Briarcliff | 0.63% | 0.18%(+0.446)#70 | 0.14%(+0.489)#1,035 |
| 71. | Bailey S Prairie | 0.63% | 0.18%(+0.444)#71 | 0.14%(+0.486)#1,041 |
| 72. | Oak Leaf | 0.61% | 0.18%(+0.433)#72 | 0.14%(+0.476)#1,064 |
| 73. | Westlake | 0.60% | 0.18%(+0.423)#73 | 0.14%(+0.465)#1,081 |
| 74. | Wolfforth | 0.58% | 0.18%(+0.397)#74 | 0.14%(+0.439)#1,126 |
| 75. | Trophy Club | 0.56% | 0.18%(+0.376)#75 | 0.14%(+0.418)#1,185 |
| 76. | Arcola | 0.54% | 0.18%(+0.356)#76 | 0.14%(+0.399)#1,233 |
| 77. | Port Neches | 0.53% | 0.18%(+0.351)#77 | 0.14%(+0.393)#1,247 |
| 78. | Texas City | 0.53% | 0.18%(+0.350)#78 | 0.14%(+0.393)#1,248 |
| 79. | Quinlan | 0.51% | 0.18%(+0.334)#79 | 0.14%(+0.376)#1,288 |
| 80. | Frisco | 0.50% | 0.18%(+0.322)#80 | 0.14%(+0.365)#1,320 |
| 81. | Taft | 0.50% | 0.18%(+0.319)#81 | 0.14%(+0.362)#1,326 |
| 82. | University Park | 0.49% | 0.18%(+0.312)#82 | 0.14%(+0.354)#1,347 |
| 83. | Prosper | 0.49% | 0.18%(+0.308)#83 | 0.14%(+0.351)#1,357 |
| 84. | Overton | 0.47% | 0.18%(+0.288)#84 | 0.14%(+0.330)#1,411 |
| 85. | Boerne | 0.47% | 0.18%(+0.287)#85 | 0.14%(+0.330)#1,412 |
| 86. | Prairie View | 0.47% | 0.18%(+0.284)#86 | 0.14%(+0.327)#1,416 |
| 87. | Whitewright | 0.46% | 0.18%(+0.276)#87 | 0.14%(+0.319)#1,432 |
| 88. | Coppell | 0.45% | 0.18%(+0.268)#88 | 0.14%(+0.311)#1,461 |
| 89. | Plano | 0.44% | 0.18%(+0.257)#89 | 0.14%(+0.300)#1,487 |
| 90. | Canyon Lake | 0.43% | 0.18%(+0.249)#90 | 0.14%(+0.291)#1,510 |
| 91. | Pantego | 0.43% | 0.18%(+0.246)#91 | 0.14%(+0.288)#1,524 |
| 92. | West University Place | 0.42% | 0.18%(+0.242)#92 | 0.14%(+0.285)#1,536 |
| 93. | Deer Park | 0.42% | 0.18%(+0.234)#93 | 0.14%(+0.277)#1,558 |
| 94. | Sanger | 0.41% | 0.18%(+0.228)#94 | 0.14%(+0.271)#1,579 |
| 95. | New Boston | 0.40% | 0.18%(+0.218)#95 | 0.14%(+0.260)#1,622 |
| 96. | Hunters Creek Village | 0.40% | 0.18%(+0.217)#96 | 0.14%(+0.260)#1,624 |
| 97. | Murphy | 0.39% | 0.18%(+0.211)#97 | 0.14%(+0.254)#1,645 |
| 98. | Shallowater | 0.39% | 0.18%(+0.207)#98 | 0.14%(+0.250)#1,667 |
| 99. | Hewitt | 0.38% | 0.18%(+0.200)#99 | 0.14%(+0.242)#1,688 |
| 100. | Bedford | 0.38% | 0.18%(+0.200)#100 | 0.14%(+0.242)#1,690 |
Common Questions
What are the Top 10 Cities with the Highest Percentage of Population Employed in Enterprise Management in Texas?
Top 10 Cities with the Highest Percentage of Population Employed in Enterprise Management in Texas are:
#1
6.3%
#2
5.1%
#3
4.9%
#4
4.9%
#5
4.8%
#6
3.9%
#7
3.4%
#8
2.9%
#9
2.9%
#10
2.6%
What city has the Highest Percentage of Population Employed in Enterprise Management in Texas?
Fate has the Highest Percentage of Population Employed in Enterprise Management in Texas with 6.3%.
What is the Percentage of Population Employed in Enterprise Management in the State of Texas?
Percentage of Population Employed in Enterprise Management in Texas is 0.18%.
What is the Percentage of Population Employed in Enterprise Management in the United States?
Percentage of Population Employed in Enterprise Management in the United States is 0.14%.