Cities with the Highest Percentage of Population Employed in Production in Texas
RELATED REPORTS & OPTIONS
Production
Texas
Compare Cities
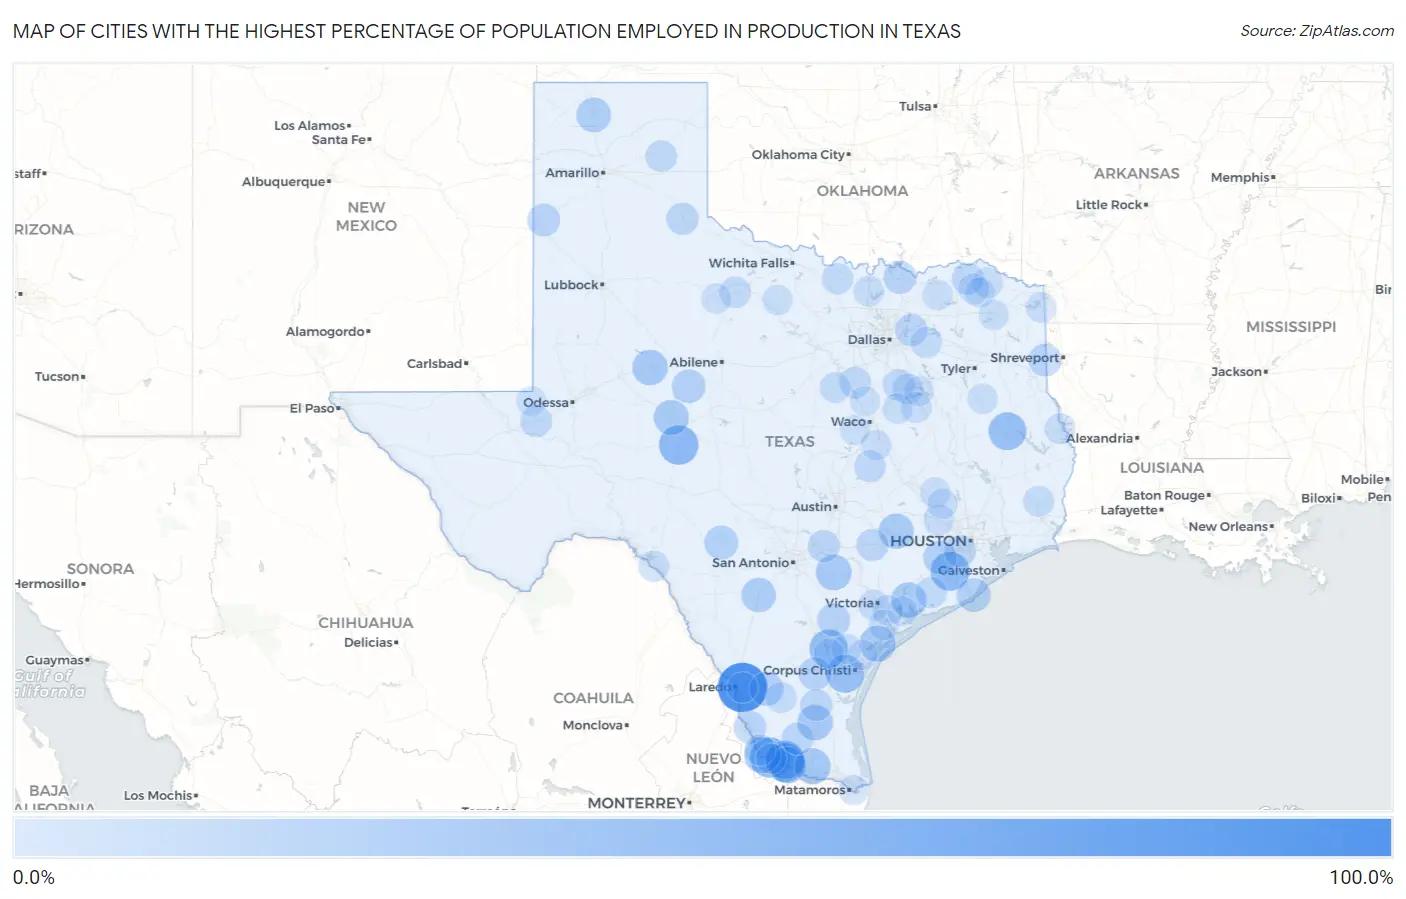
Map of Cities with the Highest Percentage of Population Employed in Production in Texas
0.0%
100.0%
Cities with the Highest Percentage of Population Employed in Production in Texas
| City | % Employed | vs State | vs National | |
| 1. | Los Altos | 100.0% | 4.9%(+95.1)#1 | 5.5%(+94.5)#16 |
| 2. | Briggs | 100.0% | 4.9%(+95.1)#2 | 5.5%(+94.5)#24 |
| 3. | Deanville | 100.0% | 4.9%(+95.1)#3 | 5.5%(+94.5)#39 |
| 4. | Brazos | 61.9% | 4.9%(+57.0)#4 | 5.5%(+56.4)#109 |
| 5. | Barrera | 59.6% | 4.9%(+54.8)#5 | 5.5%(+54.2)#123 |
| 6. | Christoval | 56.4% | 4.9%(+51.6)#6 | 5.5%(+51.0)#148 |
| 7. | Damon | 54.5% | 4.9%(+49.7)#7 | 5.5%(+49.1)#162 |
| 8. | E Lopez | 54.1% | 4.9%(+49.2)#8 | 5.5%(+48.6)#167 |
| 9. | Eugenio Saenz | 52.9% | 4.9%(+48.1)#9 | 5.5%(+47.5)#175 |
| 10. | Paisano Park | 52.6% | 4.9%(+47.8)#10 | 5.5%(+47.2)#179 |
| 11. | Tierra Grande | 50.0% | 4.9%(+45.1)#11 | 5.5%(+44.5)#198 |
| 12. | Redland | 49.7% | 4.9%(+44.8)#12 | 5.5%(+44.2)#212 |
| 13. | Nina | 43.8% | 4.9%(+38.9)#13 | 5.5%(+38.3)#280 |
| 14. | Fronton Ranchettes | 43.3% | 4.9%(+38.5)#14 | 5.5%(+37.9)#287 |
| 15. | Lopezville | 41.9% | 4.9%(+37.0)#15 | 5.5%(+36.4)#317 |
| 16. | Holiday Beach | 41.9% | 4.9%(+37.0)#16 | 5.5%(+36.4)#319 |
| 17. | Nixon | 40.4% | 4.9%(+35.5)#17 | 5.5%(+34.9)#349 |
| 18. | Westbrook | 39.8% | 4.9%(+35.0)#18 | 5.5%(+34.4)#363 |
| 19. | Encino | 39.3% | 4.9%(+34.4)#19 | 5.5%(+33.8)#378 |
| 20. | La Ward | 39.2% | 4.9%(+34.3)#20 | 5.5%(+33.7)#379 |
| 21. | New Ulm | 38.8% | 4.9%(+33.9)#21 | 5.5%(+33.3)#389 |
| 22. | Carlsbad | 38.5% | 4.9%(+33.7)#22 | 5.5%(+33.1)#396 |
| 23. | Fayetteville | 38.3% | 4.9%(+33.4)#23 | 5.5%(+32.8)#403 |
| 24. | Nada | 36.8% | 4.9%(+32.0)#24 | 5.5%(+31.4)#444 |
| 25. | Cactus | 36.4% | 4.9%(+31.5)#25 | 5.5%(+30.9)#458 |
| 26. | North Pearsall | 35.3% | 4.9%(+30.4)#26 | 5.5%(+29.8)#491 |
| 27. | Oilton | 33.9% | 4.9%(+29.0)#27 | 5.5%(+28.4)#546 |
| 28. | Quintana | 33.3% | 4.9%(+28.5)#28 | 5.5%(+27.9)#580 |
| 29. | Leakey | 33.1% | 4.9%(+28.2)#29 | 5.5%(+27.6)#592 |
| 30. | Allison | 32.6% | 4.9%(+27.7)#30 | 5.5%(+27.1)#617 |
| 31. | Blackwell | 32.4% | 4.9%(+27.5)#31 | 5.5%(+26.9)#625 |
| 32. | Beasley | 31.4% | 4.9%(+26.6)#32 | 5.5%(+26.0)#679 |
| 33. | Lingleville | 31.3% | 4.9%(+26.5)#33 | 5.5%(+25.9)#686 |
| 34. | Normanna | 30.0% | 4.9%(+25.1)#34 | 5.5%(+24.5)#767 |
| 35. | Alice Acres | 29.9% | 4.9%(+25.0)#35 | 5.5%(+24.4)#773 |
| 36. | Knollwood | 29.6% | 4.9%(+24.7)#36 | 5.5%(+24.1)#794 |
| 37. | Alanreed | 29.0% | 4.9%(+24.2)#37 | 5.5%(+23.6)#839 |
| 38. | Bovina | 28.8% | 4.9%(+23.9)#38 | 5.5%(+23.3)#853 |
| 39. | Waskom | 28.8% | 4.9%(+23.9)#39 | 5.5%(+23.3)#856 |
| 40. | Siesta Shores | 28.3% | 4.9%(+23.4)#40 | 5.5%(+22.8)#907 |
| 41. | Mobile City | 27.3% | 4.9%(+22.4)#41 | 5.5%(+21.8)#1,001 |
| 42. | Estelline | 26.8% | 4.9%(+21.9)#42 | 5.5%(+21.4)#1,046 |
| 43. | Geronimo | 26.7% | 4.9%(+21.8)#43 | 5.5%(+21.2)#1,067 |
| 44. | Flatonia | 26.4% | 4.9%(+21.5)#44 | 5.5%(+21.0)#1,086 |
| 45. | Delmita | 26.3% | 4.9%(+21.4)#45 | 5.5%(+20.8)#1,099 |
| 46. | Fifth Street | 25.6% | 4.9%(+20.7)#46 | 5.5%(+20.2)#1,179 |
| 47. | Airport Road Addition | 25.6% | 4.9%(+20.7)#47 | 5.5%(+20.1)#1,183 |
| 48. | Wickett | 25.2% | 4.9%(+20.4)#48 | 5.5%(+19.8)#1,228 |
| 49. | Sun Valley | 25.0% | 4.9%(+20.1)#49 | 5.5%(+19.5)#1,277 |
| 50. | Buckholts | 24.6% | 4.9%(+19.7)#50 | 5.5%(+19.1)#1,341 |
| 51. | Barry | 24.5% | 4.9%(+19.6)#51 | 5.5%(+19.1)#1,343 |
| 52. | Lefors | 24.5% | 4.9%(+19.6)#52 | 5.5%(+19.0)#1,345 |
| 53. | Blum | 24.3% | 4.9%(+19.4)#53 | 5.5%(+18.8)#1,378 |
| 54. | Markham | 23.9% | 4.9%(+19.1)#54 | 5.5%(+18.5)#1,431 |
| 55. | Montague | 23.8% | 4.9%(+18.9)#55 | 5.5%(+18.3)#1,450 |
| 56. | Goree | 23.8% | 4.9%(+18.9)#56 | 5.5%(+18.3)#1,458 |
| 57. | Dennis | 22.5% | 4.9%(+17.6)#57 | 5.5%(+17.1)#1,671 |
| 58. | Elmo | 22.4% | 4.9%(+17.5)#58 | 5.5%(+17.0)#1,686 |
| 59. | Myra | 22.4% | 4.9%(+17.5)#59 | 5.5%(+16.9)#1,693 |
| 60. | Walnut Springs | 21.9% | 4.9%(+17.0)#60 | 5.5%(+16.4)#1,789 |
| 61. | Alamo Beach | 21.7% | 4.9%(+16.9)#61 | 5.5%(+16.3)#1,827 |
| 62. | Silsbee | 21.6% | 4.9%(+16.8)#62 | 5.5%(+16.2)#1,848 |
| 63. | Hebbronville | 21.6% | 4.9%(+16.8)#63 | 5.5%(+16.2)#1,850 |
| 64. | La Minita | 21.4% | 4.9%(+16.5)#64 | 5.5%(+15.9)#1,911 |
| 65. | Retreat | 21.2% | 4.9%(+16.3)#65 | 5.5%(+15.7)#1,941 |
| 66. | Kirvin | 21.2% | 4.9%(+16.3)#66 | 5.5%(+15.7)#1,949 |
| 67. | Cienegas Terrace | 21.2% | 4.9%(+16.3)#67 | 5.5%(+15.7)#1,955 |
| 68. | Clarksville | 21.1% | 4.9%(+16.3)#68 | 5.5%(+15.7)#1,966 |
| 69. | Milam | 20.7% | 4.9%(+15.8)#69 | 5.5%(+15.3)#2,074 |
| 70. | Deport | 20.5% | 4.9%(+15.6)#70 | 5.5%(+15.0)#2,137 |
| 71. | Valley View | 20.3% | 4.9%(+15.4)#71 | 5.5%(+14.8)#2,182 |
| 72. | San Carlos I | 20.2% | 4.9%(+15.3)#72 | 5.5%(+14.7)#2,214 |
| 73. | Quail Creek | 20.1% | 4.9%(+15.3)#73 | 5.5%(+14.7)#2,221 |
| 74. | Domino | 20.0% | 4.9%(+15.1)#74 | 5.5%(+14.5)#2,277 |
| 75. | Lott | 19.9% | 4.9%(+15.0)#75 | 5.5%(+14.4)#2,309 |
| 76. | Ladonia | 19.8% | 4.9%(+14.9)#76 | 5.5%(+14.3)#2,333 |
| 77. | Anderson | 19.7% | 4.9%(+14.8)#77 | 5.5%(+14.2)#2,352 |
| 78. | Southwest Sandhill | 19.7% | 4.9%(+14.8)#78 | 5.5%(+14.2)#2,353 |
| 79. | Waller | 19.2% | 4.9%(+14.4)#79 | 5.5%(+13.8)#2,472 |
| 80. | Placedo | 19.2% | 4.9%(+14.3)#80 | 5.5%(+13.7)#2,484 |
| 81. | La Escondida | 19.1% | 4.9%(+14.2)#81 | 5.5%(+13.6)#2,518 |
| 82. | Coolidge | 19.0% | 4.9%(+14.1)#82 | 5.5%(+13.5)#2,563 |
| 83. | Mount Pleasant | 18.9% | 4.9%(+14.0)#83 | 5.5%(+13.4)#2,596 |
| 84. | Olney | 18.8% | 4.9%(+13.9)#84 | 5.5%(+13.4)#2,616 |
| 85. | Gallatin | 18.8% | 4.9%(+13.9)#85 | 5.5%(+13.4)#2,618 |
| 86. | Plantersville | 18.8% | 4.9%(+13.9)#86 | 5.5%(+13.3)#2,621 |
| 87. | Tivoli | 18.8% | 4.9%(+13.9)#87 | 5.5%(+13.3)#2,628 |
| 88. | Villa Pancho | 18.8% | 4.9%(+13.9)#88 | 5.5%(+13.3)#2,635 |
| 89. | Eureka | 18.6% | 4.9%(+13.8)#89 | 5.5%(+13.2)#2,680 |
| 90. | Kermit | 18.6% | 4.9%(+13.7)#90 | 5.5%(+13.1)#2,708 |
| 91. | Mcgregor | 18.6% | 4.9%(+13.7)#91 | 5.5%(+13.1)#2,709 |
| 92. | Bogata | 18.6% | 4.9%(+13.7)#92 | 5.5%(+13.1)#2,710 |
| 93. | O Brien | 18.5% | 4.9%(+13.6)#93 | 5.5%(+13.0)#2,731 |
| 94. | Tradewinds | 18.4% | 4.9%(+13.6)#94 | 5.5%(+13.0)#2,755 |
| 95. | St Paul | 18.3% | 4.9%(+13.4)#95 | 5.5%(+12.8)#2,825 |
| 96. | Deerwood | 18.2% | 4.9%(+13.3)#96 | 5.5%(+12.8)#2,842 |
| 97. | Point Comfort | 18.2% | 4.9%(+13.3)#97 | 5.5%(+12.7)#2,858 |
| 98. | Aquilla | 18.2% | 4.9%(+13.3)#98 | 5.5%(+12.7)#2,868 |
| 99. | Sandia | 18.1% | 4.9%(+13.2)#99 | 5.5%(+12.6)#2,895 |
| 100. | Beauxart Gardens | 18.1% | 4.9%(+13.2)#100 | 5.5%(+12.6)#2,901 |
Common Questions
What are the Top 10 Cities with the Highest Percentage of Population Employed in Production in Texas?
Top 10 Cities with the Highest Percentage of Population Employed in Production in Texas are:
#1
100.0%
#2
59.6%
#3
56.4%
#4
54.5%
#5
54.1%
#6
52.9%
#7
52.6%
#8
50.0%
#9
49.7%
#10
43.8%
What city has the Highest Percentage of Population Employed in Production in Texas?
Los Altos has the Highest Percentage of Population Employed in Production in Texas with 100.0%.
What is the Percentage of Population Employed in Production in the State of Texas?
Percentage of Population Employed in Production in Texas is 4.9%.
What is the Percentage of Population Employed in Production in the United States?
Percentage of Population Employed in Production in the United States is 5.5%.