Cities with the Most Immigrants from Chile in Texas
RELATED REPORTS & OPTIONS
Chile
Texas
Compare Cities
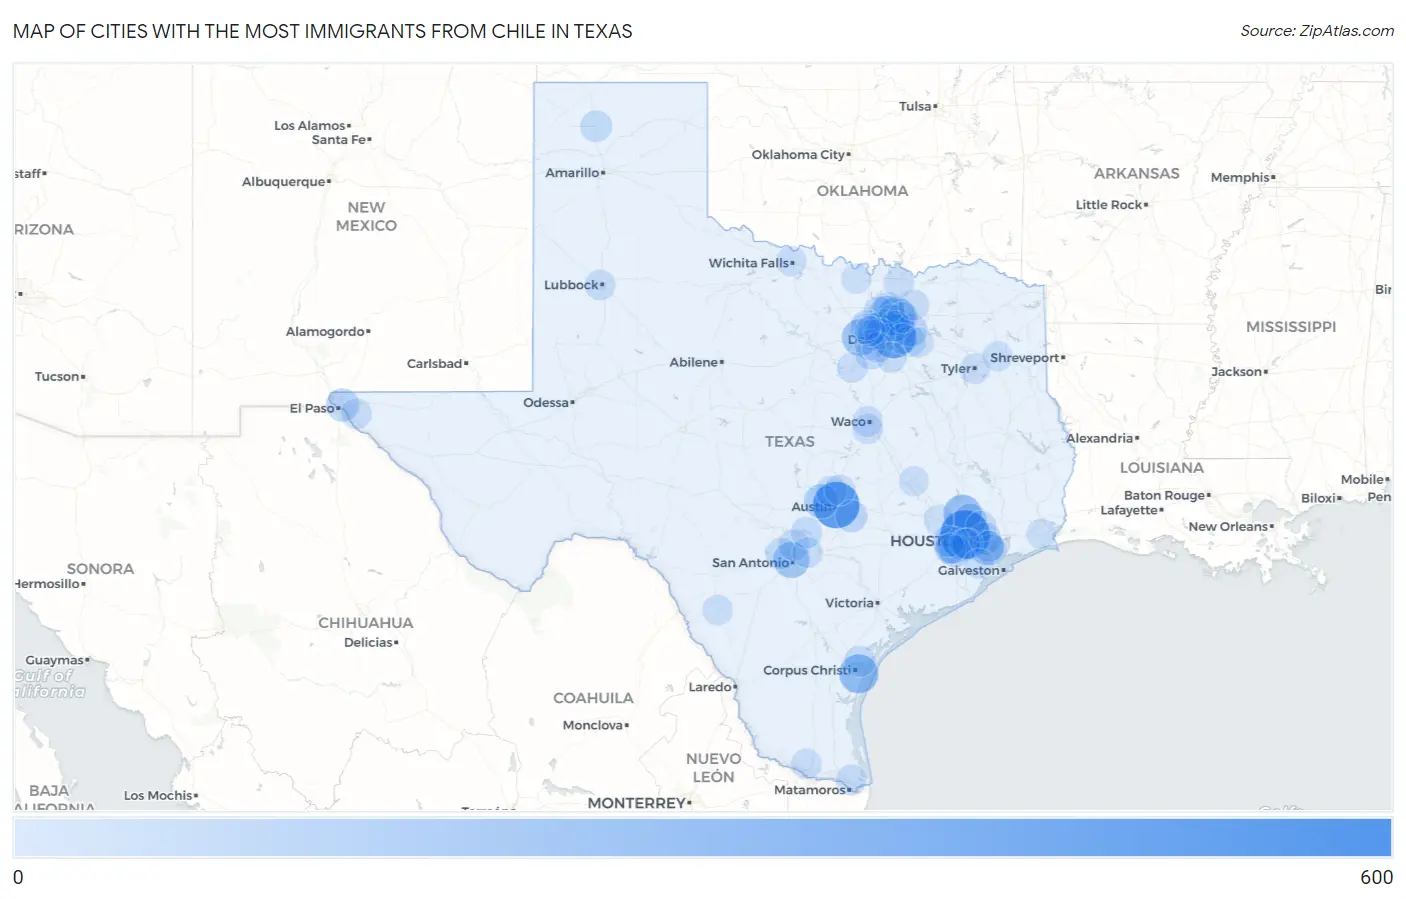
Map of Cities with the Most Immigrants from Chile in Texas
0
600
Cities with the Most Immigrants from Chile in Texas
| City | Chile | vs State | vs National | |
| 1. | Houston | 597 | 7,230(8.26%)#1 | 106,565(0.56%)#13 |
| 2. | Austin | 503 | 7,230(6.96%)#2 | 106,565(0.47%)#16 |
| 3. | Dallas | 421 | 7,230(5.82%)#3 | 106,565(0.40%)#21 |
| 4. | Corpus Christi | 267 | 7,230(3.69%)#4 | 106,565(0.25%)#49 |
| 5. | Allen | 253 | 7,230(3.50%)#5 | 106,565(0.24%)#54 |
| 6. | The Woodlands | 235 | 7,230(3.25%)#6 | 106,565(0.22%)#63 |
| 7. | Mission Bend | 199 | 7,230(2.75%)#7 | 106,565(0.19%)#83 |
| 8. | Fort Worth | 191 | 7,230(2.64%)#8 | 106,565(0.18%)#90 |
| 9. | San Antonio | 181 | 7,230(2.50%)#9 | 106,565(0.17%)#93 |
| 10. | Frisco | 180 | 7,230(2.49%)#10 | 106,565(0.17%)#95 |
| 11. | Pasadena | 136 | 7,230(1.88%)#11 | 106,565(0.13%)#132 |
| 12. | Lakeway | 128 | 7,230(1.77%)#12 | 106,565(0.12%)#143 |
| 13. | El Paso | 91 | 7,230(1.26%)#13 | 106,565(0.09%)#224 |
| 14. | Spring | 86 | 7,230(1.19%)#14 | 106,565(0.08%)#241 |
| 15. | Channelview | 71 | 7,230(0.98%)#15 | 106,565(0.07%)#299 |
| 16. | Rockwall | 69 | 7,230(0.95%)#16 | 106,565(0.06%)#309 |
| 17. | Wyldwood | 60 | 7,230(0.83%)#17 | 106,565(0.06%)#362 |
| 18. | Garland | 56 | 7,230(0.77%)#18 | 106,565(0.05%)#378 |
| 19. | Sugar Land | 56 | 7,230(0.77%)#19 | 106,565(0.05%)#380 |
| 20. | Oak Point | 44 | 7,230(0.61%)#20 | 106,565(0.04%)#483 |
| 21. | Mansfield | 43 | 7,230(0.59%)#21 | 106,565(0.04%)#489 |
| 22. | Dumas | 43 | 7,230(0.59%)#22 | 106,565(0.04%)#498 |
| 23. | Helotes | 43 | 7,230(0.59%)#23 | 106,565(0.04%)#502 |
| 24. | Carrollton | 42 | 7,230(0.58%)#24 | 106,565(0.04%)#506 |
| 25. | Cinco Ranch | 42 | 7,230(0.58%)#25 | 106,565(0.04%)#512 |
| 26. | Portland | 35 | 7,230(0.48%)#26 | 106,565(0.03%)#593 |
| 27. | Shoreacres | 34 | 7,230(0.47%)#27 | 106,565(0.03%)#615 |
| 28. | Grapevine | 32 | 7,230(0.44%)#28 | 106,565(0.03%)#628 |
| 29. | Timberwood Park | 32 | 7,230(0.44%)#29 | 106,565(0.03%)#630 |
| 30. | University Park | 32 | 7,230(0.44%)#30 | 106,565(0.03%)#631 |
| 31. | Coppell | 30 | 7,230(0.41%)#31 | 106,565(0.03%)#656 |
| 32. | Forney | 30 | 7,230(0.41%)#32 | 106,565(0.03%)#662 |
| 33. | Plano | 29 | 7,230(0.40%)#33 | 106,565(0.03%)#668 |
| 34. | Canyon Lake | 29 | 7,230(0.40%)#34 | 106,565(0.03%)#675 |
| 35. | Prosper | 29 | 7,230(0.40%)#35 | 106,565(0.03%)#676 |
| 36. | Richardson | 27 | 7,230(0.37%)#36 | 106,565(0.03%)#702 |
| 37. | Cedar Park | 26 | 7,230(0.36%)#37 | 106,565(0.02%)#719 |
| 38. | Horizon City | 24 | 7,230(0.33%)#38 | 106,565(0.02%)#764 |
| 39. | Lucas | 23 | 7,230(0.32%)#39 | 106,565(0.02%)#794 |
| 40. | Atascocita | 22 | 7,230(0.30%)#40 | 106,565(0.02%)#797 |
| 41. | Euless | 22 | 7,230(0.30%)#41 | 106,565(0.02%)#799 |
| 42. | Brownsville | 19 | 7,230(0.26%)#42 | 106,565(0.02%)#869 |
| 43. | Sunnyvale | 19 | 7,230(0.26%)#43 | 106,565(0.02%)#895 |
| 44. | Blue Ridge | 19 | 7,230(0.26%)#44 | 106,565(0.02%)#900 |
| 45. | Irving | 18 | 7,230(0.25%)#45 | 106,565(0.02%)#901 |
| 46. | Pecan Grove | 18 | 7,230(0.25%)#46 | 106,565(0.02%)#910 |
| 47. | Red Oak | 18 | 7,230(0.25%)#47 | 106,565(0.02%)#916 |
| 48. | Round Rock | 17 | 7,230(0.24%)#48 | 106,565(0.02%)#928 |
| 49. | La Porte | 17 | 7,230(0.24%)#49 | 106,565(0.02%)#940 |
| 50. | Lubbock | 16 | 7,230(0.22%)#50 | 106,565(0.02%)#963 |
| 51. | Waco | 16 | 7,230(0.22%)#51 | 106,565(0.02%)#965 |
| 52. | Steiner Ranch | 16 | 7,230(0.22%)#52 | 106,565(0.02%)#983 |
| 53. | Schertz | 15 | 7,230(0.21%)#53 | 106,565(0.01%)#1,000 |
| 54. | West University Place | 15 | 7,230(0.21%)#54 | 106,565(0.01%)#1,017 |
| 55. | Arlington | 14 | 7,230(0.19%)#55 | 106,565(0.01%)#1,038 |
| 56. | Grand Prairie | 13 | 7,230(0.18%)#56 | 106,565(0.01%)#1,072 |
| 57. | Mcallen | 12 | 7,230(0.17%)#57 | 106,565(0.01%)#1,119 |
| 58. | Crystal City | 12 | 7,230(0.17%)#58 | 106,565(0.01%)#1,149 |
| 59. | Cleburne | 11 | 7,230(0.15%)#59 | 106,565(0.01%)#1,170 |
| 60. | Hewitt | 11 | 7,230(0.15%)#60 | 106,565(0.01%)#1,184 |
| 61. | Tyler | 10 | 7,230(0.14%)#61 | 106,565(0.01%)#1,208 |
| 62. | Wichita Falls | 10 | 7,230(0.14%)#62 | 106,565(0.01%)#1,210 |
| 63. | Sherman | 10 | 7,230(0.14%)#63 | 106,565(0.01%)#1,218 |
| 64. | Keller | 8 | 7,230(0.11%)#64 | 106,565(0.01%)#1,303 |
| 65. | Bellaire | 8 | 7,230(0.11%)#65 | 106,565(0.01%)#1,316 |
| 66. | Westlake | 8 | 7,230(0.11%)#66 | 106,565(0.01%)#1,338 |
| 67. | Colleyville | 7 | 7,230(0.10%)#67 | 106,565(0.01%)#1,359 |
| 68. | Terrell | 6 | 7,230(0.08%)#68 | 106,565(0.01%)#1,402 |
| 69. | Hillcrest | 6 | 7,230(0.08%)#69 | 106,565(0.01%)#1,416 |
| 70. | Bryan | 4 | 7,230(0.06%)#70 | 106,565(0.00%)#1,456 |
| 71. | Waller | 4 | 7,230(0.06%)#71 | 106,565(0.00%)#1,477 |
| 72. | Clarksville City | 4 | 7,230(0.06%)#72 | 106,565(0.00%)#1,487 |
| 73. | Muenster | 2 | 7,230(0.03%)#73 | 106,565(0.00%)#1,542 |
| 74. | Taylor Landing | 1 | 7,230(0.01%)#74 | 106,565(0.00%)#1,575 |
Common Questions
What are the Top 10 Cities with the Most Immigrants from Chile in Texas?
Top 10 Cities with the Most Immigrants from Chile in Texas are:
#1
597
#2
503
#3
421
#4
267
#5
253
#6
235
#7
199
#8
191
#9
181
#10
180
What city has the Most Immigrants from Chile in Texas?
Houston has the Most Immigrants from Chile in Texas with 597.
What is the Total Immigrants from Chile in the State of Texas?
Total Immigrants from Chile in Texas is 7,230.
What is the Total Immigrants from Chile in the United States?
Total Immigrants from Chile in the United States is 106,565.