Cities with the Highest Percentage of Immigrants from Turkey in Texas
RELATED REPORTS & OPTIONS
Turkey
Texas
Compare Cities
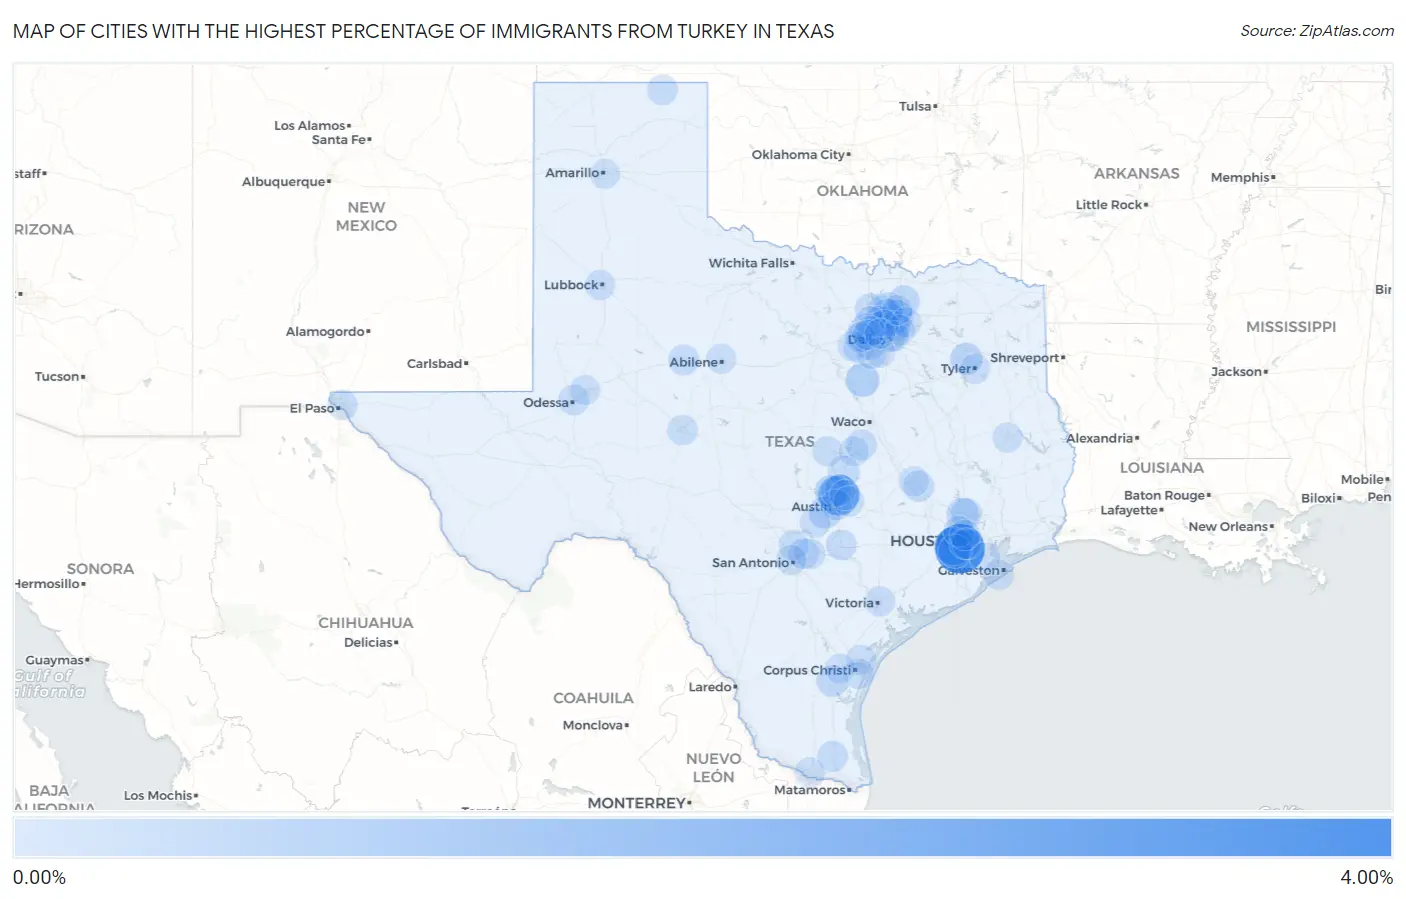
Map of Cities with the Highest Percentage of Immigrants from Turkey in Texas
0.00%
4.00%
Cities with the Highest Percentage of Immigrants from Turkey in Texas
| City | Turkey | vs State | vs National | |
| 1. | Stafford | 3.78% | 0.045%(+3.74)#-1 | 0.042%(+3.74)#0 |
| 2. | Wells Branch | 2.12% | 0.045%(+2.07)#25 | 0.042%(+2.07)#546 |
| 3. | Four Corners | 1.57% | 0.045%(+1.53)#26 | 0.042%(+1.53)#547 |
| 4. | Covington | 0.67% | 0.045%(+0.626)#27 | 0.042%(+0.629)#548 |
| 5. | Sugar Land | 0.62% | 0.045%(+0.570)#28 | 0.042%(+0.574)#549 |
| 6. | Allen | 0.54% | 0.045%(+0.491)#29 | 0.042%(+0.494)#550 |
| 7. | Sienna | 0.46% | 0.045%(+0.412)#30 | 0.042%(+0.415)#558 |
| 8. | Cedar Park | 0.44% | 0.045%(+0.396)#64 | 0.042%(+0.399)#1,384 |
| 9. | Bear Creek | 0.41% | 0.045%(+0.367)#65 | 0.042%(+0.370)#1,385 |
| 10. | Hideaway | 0.37% | 0.045%(+0.328)#66 | 0.042%(+0.331)#1,386 |
| 11. | The Woodlands | 0.34% | 0.045%(+0.293)#67 | 0.042%(+0.296)#1,387 |
| 12. | Anna | 0.31% | 0.045%(+0.267)#68 | 0.042%(+0.270)#1,388 |
| 13. | Bishop | 0.28% | 0.045%(+0.239)#69 | 0.042%(+0.242)#1,389 |
| 14. | Plano | 0.24% | 0.045%(+0.196)#70 | 0.042%(+0.199)#1,390 |
| 15. | Sonterra | 0.21% | 0.045%(+0.165)#71 | 0.042%(+0.168)#1,391 |
| 16. | Highland Park | 0.20% | 0.045%(+0.158)#72 | 0.042%(+0.161)#1,392 |
| 17. | Oak Ridge North | 0.20% | 0.045%(+0.152)#73 | 0.042%(+0.155)#1,393 |
| 18. | College Station | 0.18% | 0.045%(+0.136)#74 | 0.042%(+0.139)#1,394 |
| 19. | Round Rock | 0.18% | 0.045%(+0.135)#75 | 0.042%(+0.138)#1,395 |
| 20. | Little Elm | 0.17% | 0.045%(+0.129)#76 | 0.042%(+0.132)#1,396 |
| 21. | Troy | 0.16% | 0.045%(+0.119)#77 | 0.042%(+0.122)#1,397 |
| 22. | Lyford | 0.12% | 0.045%(+0.073)#78 | 0.042%(+0.076)#1,398 |
| 23. | Sweetwater | 0.11% | 0.045%(+0.068)#79 | 0.042%(+0.071)#1,399 |
| 24. | Coppell | 0.11% | 0.045%(+0.067)#80 | 0.042%(+0.071)#1,400 |
| 25. | Luling | 0.11% | 0.045%(+0.065)#81 | 0.042%(+0.068)#1,401 |
| 26. | Odessa | 0.11% | 0.045%(+0.064)#82 | 0.042%(+0.067)#1,402 |
| 27. | Edgecliff Village | 0.11% | 0.045%(+0.062)#83 | 0.042%(+0.065)#1,403 |
| 28. | Perryton | 0.10% | 0.045%(+0.058)#84 | 0.042%(+0.061)#1,404 |
| 29. | Jersey Village | 0.10% | 0.045%(+0.058)#85 | 0.042%(+0.061)#1,405 |
| 30. | West University Place | 0.10% | 0.045%(+0.055)#86 | 0.042%(+0.058)#1,406 |
| 31. | Prosper | 0.098% | 0.045%(+0.053)#87 | 0.042%(+0.056)#1,407 |
| 32. | Austin | 0.098% | 0.045%(+0.052)#88 | 0.042%(+0.055)#1,408 |
| 33. | Euless | 0.094% | 0.045%(+0.049)#89 | 0.042%(+0.052)#1,409 |
| 34. | Bellaire | 0.093% | 0.045%(+0.048)#90 | 0.042%(+0.051)#1,410 |
| 35. | Richardson | 0.088% | 0.045%(+0.043)#91 | 0.042%(+0.046)#1,411 |
| 36. | Frisco | 0.088% | 0.045%(+0.042)#92 | 0.042%(+0.045)#1,412 |
| 37. | Lewisville | 0.086% | 0.045%(+0.041)#93 | 0.042%(+0.044)#1,413 |
| 38. | Cibolo | 0.086% | 0.045%(+0.040)#94 | 0.042%(+0.043)#1,414 |
| 39. | Brushy Creek | 0.085% | 0.045%(+0.040)#95 | 0.042%(+0.043)#1,415 |
| 40. | Woodcreek | 0.084% | 0.045%(+0.038)#96 | 0.042%(+0.041)#1,416 |
| 41. | Wylie | 0.082% | 0.045%(+0.037)#97 | 0.042%(+0.040)#1,417 |
| 42. | Universal City | 0.071% | 0.045%(+0.025)#98 | 0.042%(+0.028)#1,418 |
| 43. | Denton | 0.070% | 0.045%(+0.024)#99 | 0.042%(+0.027)#1,419 |
| 44. | Houston | 0.065% | 0.045%(+0.019)#100 | 0.042%(+0.022)#1,420 |
| 45. | Garland | 0.062% | 0.045%(+0.016)#101 | 0.042%(+0.019)#1,543 |
| 46. | Arlington | 0.061% | 0.045%(+0.016)#102 | 0.042%(+0.019)#1,544 |
| 47. | Mansfield | 0.061% | 0.045%(+0.016)#103 | 0.042%(+0.019)#1,545 |
| 48. | San Angelo | 0.059% | 0.045%(+0.014)#104 | 0.042%(+0.017)#1,546 |
| 49. | Galveston | 0.056% | 0.045%(+0.011)#105 | 0.042%(+0.014)#1,547 |
| 50. | Gregory | 0.048% | 0.045%(+0.003)#106 | 0.042%(+0.006)#1,548 |
| 51. | Timberwood Park | 0.047% | 0.045%(+0.001)#107 | 0.042%(+0.004)#1,549 |
| 52. | Manor | 0.046% | 0.045%(+0.000)#108 | 0.042%(+0.003)#1,550 |
| 53. | Lubbock | 0.045% | 0.045%(-0.000)#109 | 0.042%(+0.003)#1,551 |
| 54. | Copperas Cove | 0.044% | 0.045%(-0.002)#110 | 0.042%(+0.002)#1,552 |
| 55. | Dallas | 0.040% | 0.045%(-0.005)#111 | 0.042%(-0.002)#1,553 |
| 56. | San Antonio | 0.040% | 0.045%(-0.006)#112 | 0.042%(-0.003)#1,554 |
| 57. | Keller | 0.035% | 0.045%(-0.010)#113 | 0.042%(-0.007)#1,555 |
| 58. | Victoria | 0.034% | 0.045%(-0.012)#114 | 0.042%(-0.009)#1,556 |
| 59. | El Paso | 0.032% | 0.045%(-0.013)#115 | 0.042%(-0.010)#1,557 |
| 60. | Pflugerville | 0.029% | 0.045%(-0.016)#116 | 0.042%(-0.013)#1,558 |
| 61. | Tyler | 0.029% | 0.045%(-0.016)#117 | 0.042%(-0.013)#1,559 |
| 62. | Corpus Christi | 0.029% | 0.045%(-0.017)#118 | 0.042%(-0.014)#1,560 |
| 63. | Haltom City | 0.028% | 0.045%(-0.017)#119 | 0.042%(-0.014)#1,561 |
| 64. | Flower Mound | 0.027% | 0.045%(-0.018)#120 | 0.042%(-0.015)#1,562 |
| 65. | Bryan | 0.026% | 0.045%(-0.020)#121 | 0.042%(-0.016)#1,563 |
| 66. | Benbrook | 0.025% | 0.045%(-0.021)#122 | 0.042%(-0.018)#1,564 |
| 67. | Abilene | 0.025% | 0.045%(-0.021)#123 | 0.042%(-0.018)#1,565 |
| 68. | Temple | 0.024% | 0.045%(-0.022)#124 | 0.042%(-0.018)#1,566 |
| 69. | Carrollton | 0.023% | 0.045%(-0.022)#125 | 0.042%(-0.019)#1,567 |
| 70. | Colleyville | 0.023% | 0.045%(-0.022)#126 | 0.042%(-0.019)#1,568 |
| 71. | League City | 0.021% | 0.045%(-0.024)#127 | 0.042%(-0.021)#1,569 |
| 72. | Fort Worth | 0.021% | 0.045%(-0.025)#128 | 0.042%(-0.022)#1,570 |
| 73. | Robstown | 0.020% | 0.045%(-0.026)#129 | 0.042%(-0.023)#1,571 |
| 74. | Cedar Hill | 0.018% | 0.045%(-0.027)#130 | 0.042%(-0.024)#1,572 |
| 75. | Hurst | 0.017% | 0.045%(-0.028)#131 | 0.042%(-0.025)#1,573 |
| 76. | Midland | 0.017% | 0.045%(-0.028)#132 | 0.042%(-0.025)#1,574 |
| 77. | Mckinney | 0.015% | 0.045%(-0.031)#133 | 0.042%(-0.028)#1,575 |
| 78. | Pharr | 0.010% | 0.045%(-0.035)#134 | 0.042%(-0.032)#1,576 |
| 79. | Amarillo | 0.0100% | 0.045%(-0.035)#135 | 0.042%(-0.032)#1,577 |
| 80. | Irving | 0.0071% | 0.045%(-0.038)#136 | 0.042%(-0.035)#1,578 |
| 81. | Lufkin | 0.0029% | 0.045%(-0.043)#137 | 0.042%(-0.039)#1,579 |
Common Questions
What are the Top 10 Cities with the Highest Percentage of Immigrants from Turkey in Texas?
Top 10 Cities with the Highest Percentage of Immigrants from Turkey in Texas are:
#1
3.78%
#2
2.12%
#3
1.57%
#4
0.67%
#5
0.62%
#6
0.54%
#7
0.44%
#8
0.41%
#9
0.37%
#10
0.34%
What city has the Highest Percentage of Immigrants from Turkey in Texas?
Stafford has the Highest Percentage of Immigrants from Turkey in Texas with 3.78%.
What is the Percentage of Immigrants from Turkey in the State of Texas?
Percentage of Immigrants from Turkey in Texas is 0.045%.
What is the Percentage of Immigrants from Turkey in the United States?
Percentage of Immigrants from Turkey in the United States is 0.042%.