Zip Codes with the Highest Percentage of Population with a Degree in Visual and Performing Arts in Carrollton, TX
RELATED REPORTS & OPTIONS
Visual and Performing Arts
Carrollton
Compare Zip Codes
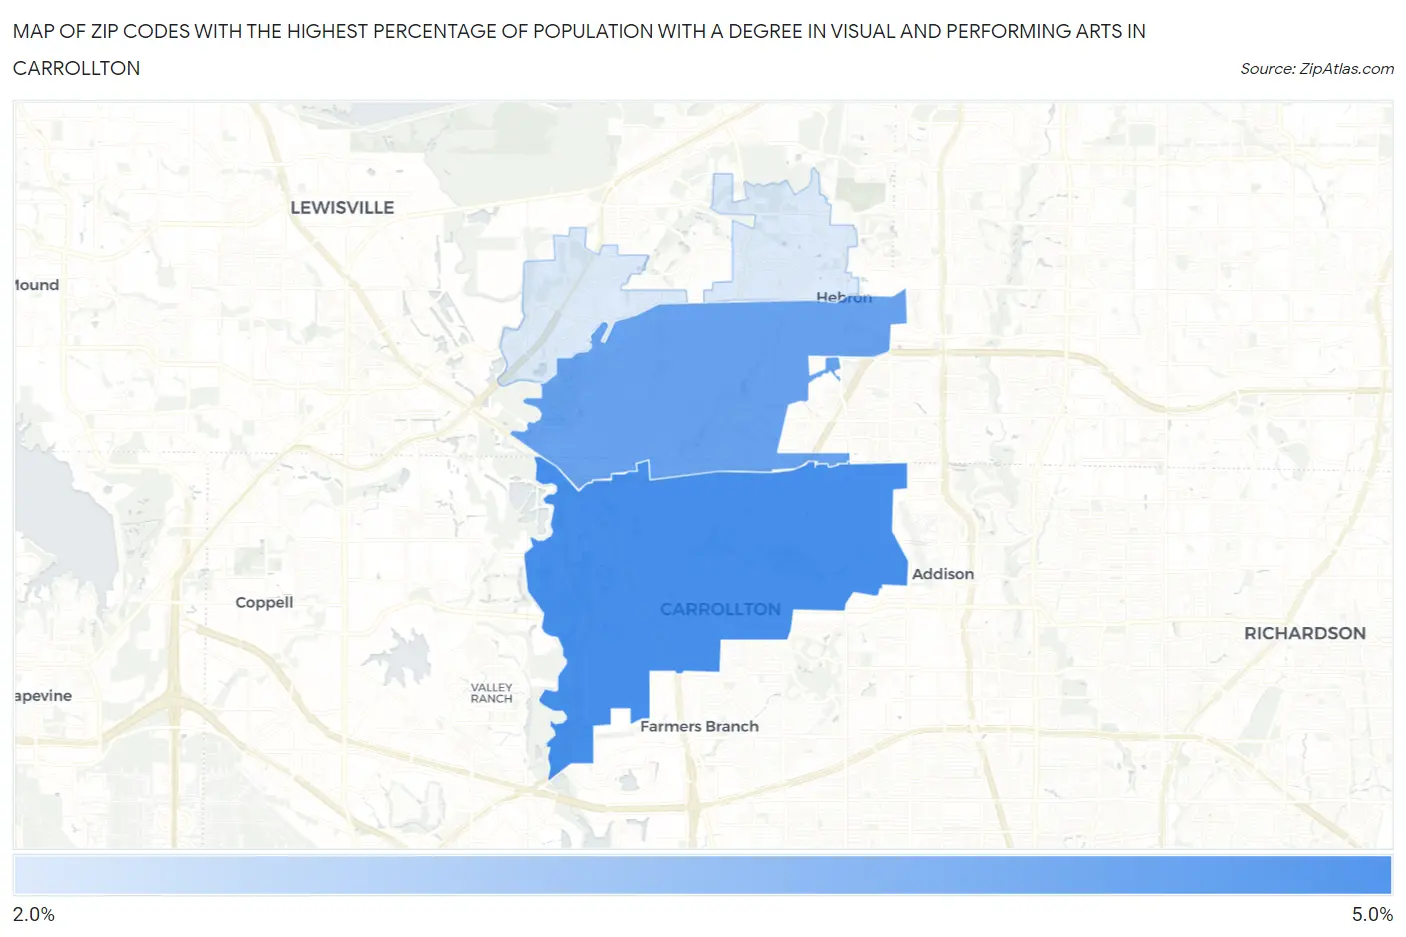
Map of Zip Codes with the Highest Percentage of Population with a Degree in Visual and Performing Arts in Carrollton
0.0%
5.0%
Zip Codes with the Highest Percentage of Population with a Degree in Visual and Performing Arts in Carrollton, TX
| Zip Code | % Graduates | vs State | vs National | |
| 1. | 75006 | 4.5% | 3.2%(+1.25)#337 | 4.3%(+0.210)#7,904 |
| 2. | 75007 | 4.1% | 3.2%(+0.846)#406 | 4.3%(-0.197)#9,063 |
| 3. | 75010 | 2.6% | 3.2%(-0.595)#692 | 4.3%(-1.64)#14,211 |
1
Common Questions
What are the Top Zip Codes with the Highest Percentage of Population with a Degree in Visual and Performing Arts in Carrollton, TX?
Top Zip Codes with the Highest Percentage of Population with a Degree in Visual and Performing Arts in Carrollton, TX are:
What zip code has the Highest Percentage of Population with a Degree in Visual and Performing Arts in Carrollton, TX?
75006 has the Highest Percentage of Population with a Degree in Visual and Performing Arts in Carrollton, TX with 4.5%.
What is the Percentage of Population with a Degree in Visual and Performing Arts in Carrollton, TX?
Percentage of Population with a Degree in Visual and Performing Arts in Carrollton is 3.7%.
What is the Percentage of Population with a Degree in Visual and Performing Arts in Texas?
Percentage of Population with a Degree in Visual and Performing Arts in Texas is 3.2%.
What is the Percentage of Population with a Degree in Visual and Performing Arts in the United States?
Percentage of Population with a Degree in Visual and Performing Arts in the United States is 4.3%.