Cities with the Most Immigrants from Singapore in Texas
RELATED REPORTS & OPTIONS
Singapore
Texas
Compare Cities
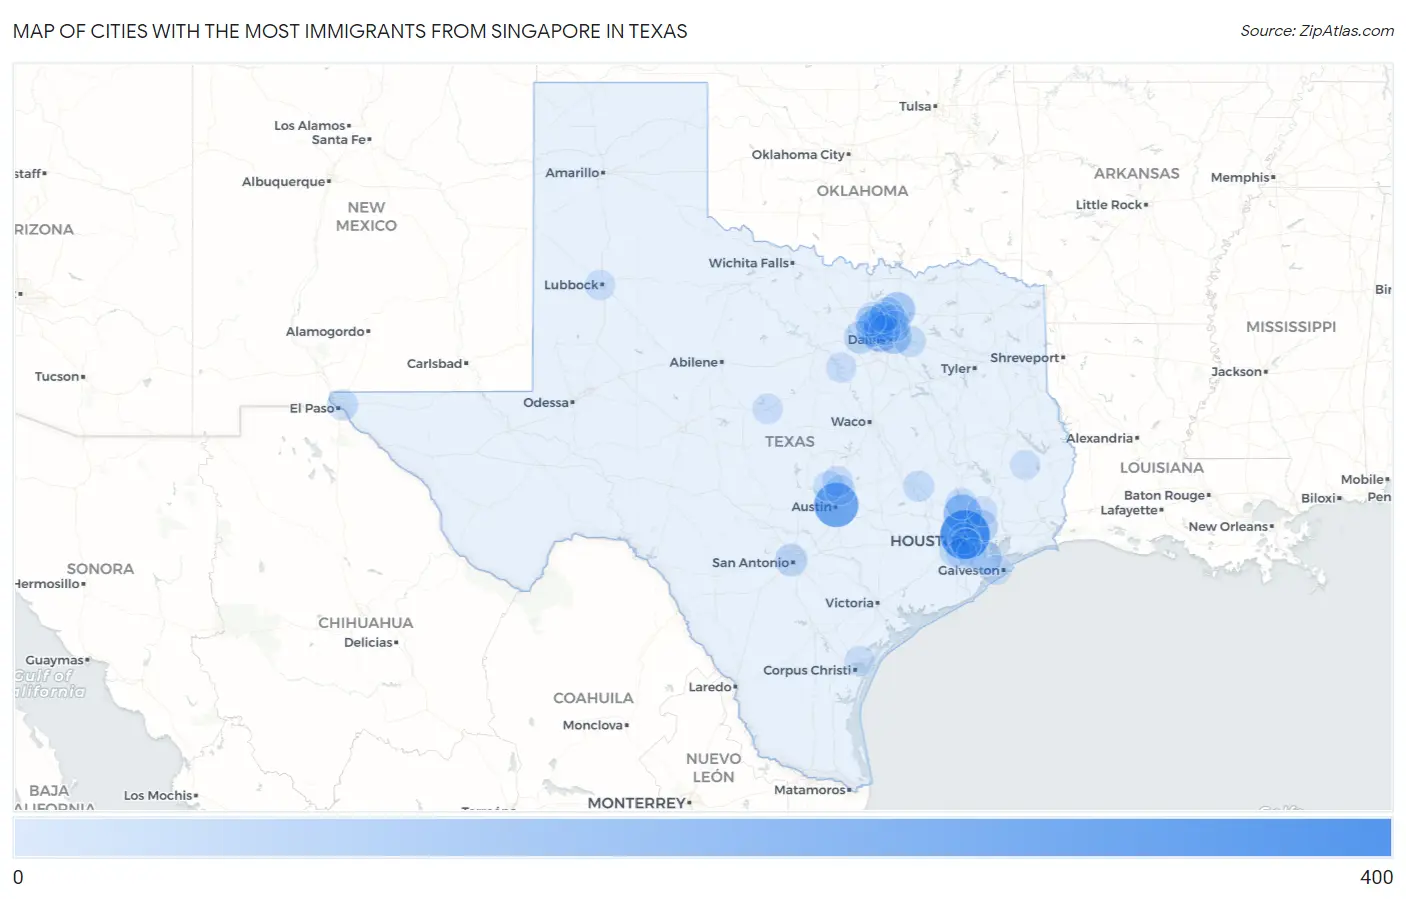
Map of Cities with the Most Immigrants from Singapore in Texas
0
400
Cities with the Most Immigrants from Singapore in Texas
| City | Singapore | vs State | vs National | |
| 1. | Houston | 397 | 2,961(13.41%)#1 | 35,435(1.12%)#7 |
| 2. | Austin | 288 | 2,961(9.73%)#2 | 35,435(0.81%)#10 |
| 3. | The Woodlands | 160 | 2,961(5.40%)#3 | 35,435(0.45%)#30 |
| 4. | Irving | 127 | 2,961(4.29%)#4 | 35,435(0.36%)#44 |
| 5. | Mckinney | 109 | 2,961(3.68%)#5 | 35,435(0.31%)#49 |
| 6. | Grapevine | 109 | 2,961(3.68%)#6 | 35,435(0.31%)#51 |
| 7. | Dallas | 105 | 2,961(3.55%)#7 | 35,435(0.30%)#55 |
| 8. | League City | 69 | 2,961(2.33%)#8 | 35,435(0.19%)#90 |
| 9. | Lewisville | 67 | 2,961(2.26%)#9 | 35,435(0.19%)#95 |
| 10. | Atascocita | 61 | 2,961(2.06%)#10 | 35,435(0.17%)#111 |
| 11. | Frisco | 60 | 2,961(2.03%)#11 | 35,435(0.17%)#114 |
| 12. | San Antonio | 46 | 2,961(1.55%)#12 | 35,435(0.13%)#150 |
| 13. | Fort Worth | 45 | 2,961(1.52%)#13 | 35,435(0.13%)#156 |
| 14. | Conroe | 28 | 2,961(0.95%)#14 | 35,435(0.08%)#246 |
| 15. | Forney | 27 | 2,961(0.91%)#15 | 35,435(0.08%)#256 |
| 16. | Plano | 25 | 2,961(0.84%)#16 | 35,435(0.07%)#266 |
| 17. | Sugar Land | 24 | 2,961(0.81%)#17 | 35,435(0.07%)#275 |
| 18. | Bellaire | 22 | 2,961(0.74%)#18 | 35,435(0.06%)#305 |
| 19. | College Station | 20 | 2,961(0.68%)#19 | 35,435(0.06%)#325 |
| 20. | Richardson | 20 | 2,961(0.68%)#20 | 35,435(0.06%)#326 |
| 21. | Coppell | 19 | 2,961(0.64%)#21 | 35,435(0.05%)#341 |
| 22. | El Paso | 18 | 2,961(0.61%)#22 | 35,435(0.05%)#351 |
| 23. | Spring Valley Village | 18 | 2,961(0.61%)#23 | 35,435(0.05%)#367 |
| 24. | Leander | 17 | 2,961(0.57%)#24 | 35,435(0.05%)#373 |
| 25. | Copper Canyon | 17 | 2,961(0.57%)#25 | 35,435(0.05%)#388 |
| 26. | Farmers Branch | 15 | 2,961(0.51%)#26 | 35,435(0.04%)#414 |
| 27. | Georgetown | 11 | 2,961(0.37%)#27 | 35,435(0.03%)#498 |
| 28. | The Colony | 10 | 2,961(0.34%)#28 | 35,435(0.03%)#529 |
| 29. | Early | 9 | 2,961(0.30%)#29 | 35,435(0.03%)#582 |
| 30. | Missouri City | 8 | 2,961(0.27%)#30 | 35,435(0.02%)#586 |
| 31. | Round Rock | 7 | 2,961(0.24%)#31 | 35,435(0.02%)#617 |
| 32. | Flower Mound | 7 | 2,961(0.24%)#32 | 35,435(0.02%)#619 |
| 33. | Lubbock | 6 | 2,961(0.20%)#33 | 35,435(0.02%)#639 |
| 34. | Portland | 6 | 2,961(0.20%)#34 | 35,435(0.02%)#649 |
| 35. | Pecan Plantation | 6 | 2,961(0.20%)#35 | 35,435(0.02%)#658 |
| 36. | Pearland | 5 | 2,961(0.17%)#36 | 35,435(0.01%)#665 |
| 37. | Southside Place | 4 | 2,961(0.14%)#37 | 35,435(0.01%)#706 |
| 38. | Patton Village | 3 | 2,961(0.10%)#38 | 35,435(0.01%)#725 |
| 39. | Colmesneil | 3 | 2,961(0.10%)#39 | 35,435(0.01%)#729 |
| 40. | Tiki Island | 2 | 2,961(0.07%)#40 | 35,435(0.01%)#738 |
Common Questions
What are the Top 10 Cities with the Most Immigrants from Singapore in Texas?
Top 10 Cities with the Most Immigrants from Singapore in Texas are:
#1
397
#2
288
#3
160
#4
127
#5
109
#6
109
#7
105
#8
69
#9
67
#10
61
What city has the Most Immigrants from Singapore in Texas?
Houston has the Most Immigrants from Singapore in Texas with 397.
What is the Total Immigrants from Singapore in the State of Texas?
Total Immigrants from Singapore in Texas is 2,961.
What is the Total Immigrants from Singapore in the United States?
Total Immigrants from Singapore in the United States is 35,435.