Zip Codes with the Highest Percentage of Population with a Degree in Visual and Performing Arts in Mission, TX
RELATED REPORTS & OPTIONS
Visual and Performing Arts
Mission
Compare Zip Codes
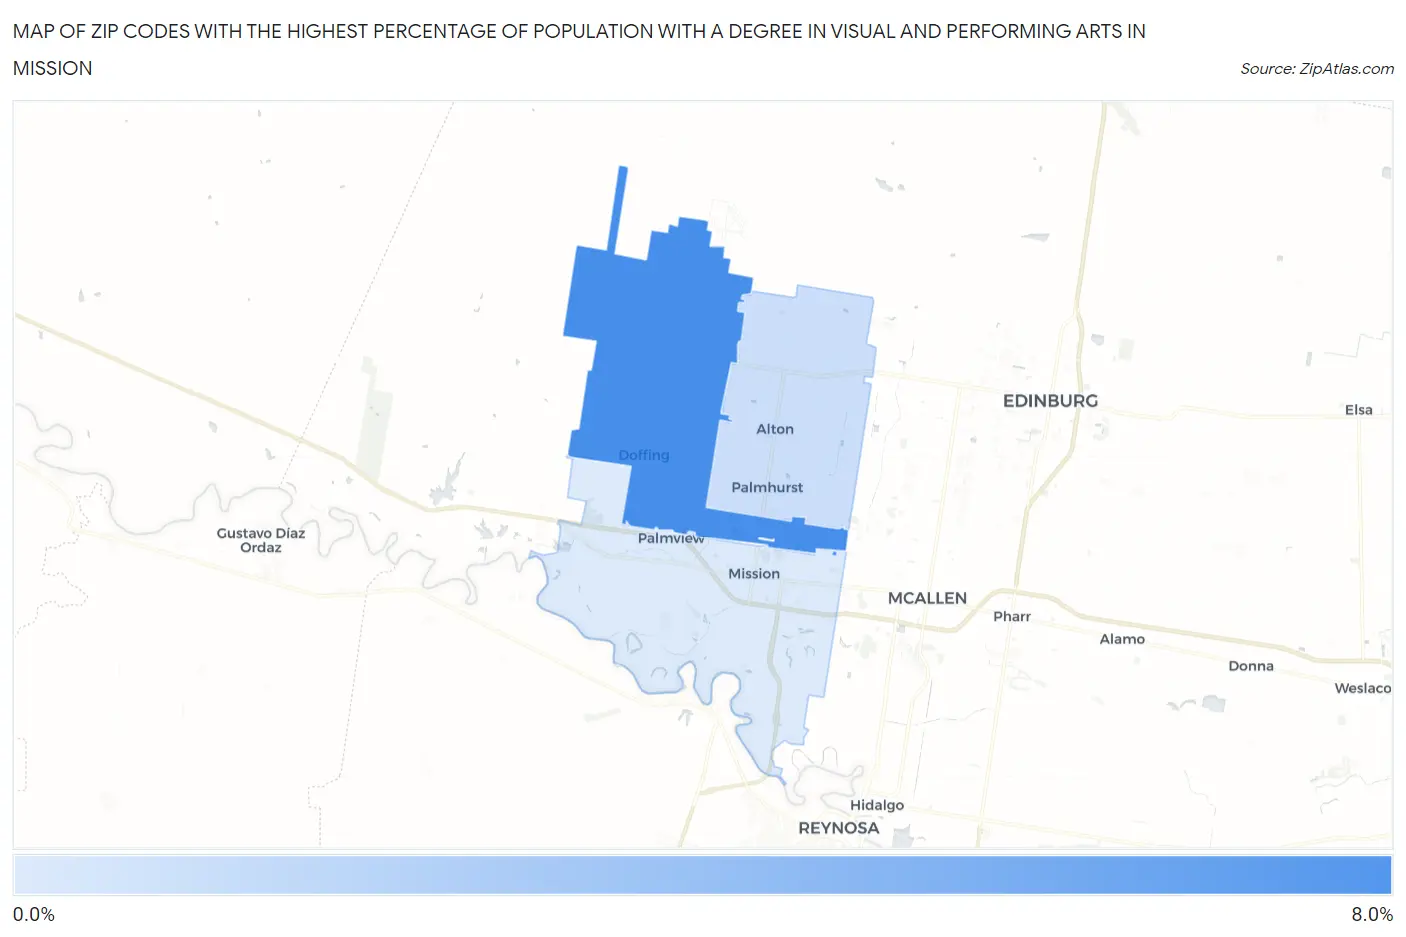
Map of Zip Codes with the Highest Percentage of Population with a Degree in Visual and Performing Arts in Mission
0.0%
8.0%
Zip Codes with the Highest Percentage of Population with a Degree in Visual and Performing Arts in Mission, TX
| Zip Code | % Graduates | vs State | vs National | |
| 1. | 78574 | 6.2% | 3.2%(+2.96)#189 | 4.3%(+1.92)#4,645 |
| 2. | 78573 | 1.3% | 3.2%(-1.89)#1,039 | 4.3%(-2.93)#18,699 |
| 3. | 78572 | 0.68% | 3.2%(-2.53)#1,161 | 4.3%(-3.57)#20,408 |
1
Common Questions
What are the Top Zip Codes with the Highest Percentage of Population with a Degree in Visual and Performing Arts in Mission, TX?
Top Zip Codes with the Highest Percentage of Population with a Degree in Visual and Performing Arts in Mission, TX are:
What zip code has the Highest Percentage of Population with a Degree in Visual and Performing Arts in Mission, TX?
78574 has the Highest Percentage of Population with a Degree in Visual and Performing Arts in Mission, TX with 6.2%.
What is the Percentage of Population with a Degree in Visual and Performing Arts in Mission, TX?
Percentage of Population with a Degree in Visual and Performing Arts in Mission is 1.6%.
What is the Percentage of Population with a Degree in Visual and Performing Arts in Texas?
Percentage of Population with a Degree in Visual and Performing Arts in Texas is 3.2%.
What is the Percentage of Population with a Degree in Visual and Performing Arts in the United States?
Percentage of Population with a Degree in Visual and Performing Arts in the United States is 4.3%.