Cities with the Most Immigrants from Northern Europe in Texas
RELATED REPORTS & OPTIONS
Northern Europe
Texas
Compare Cities
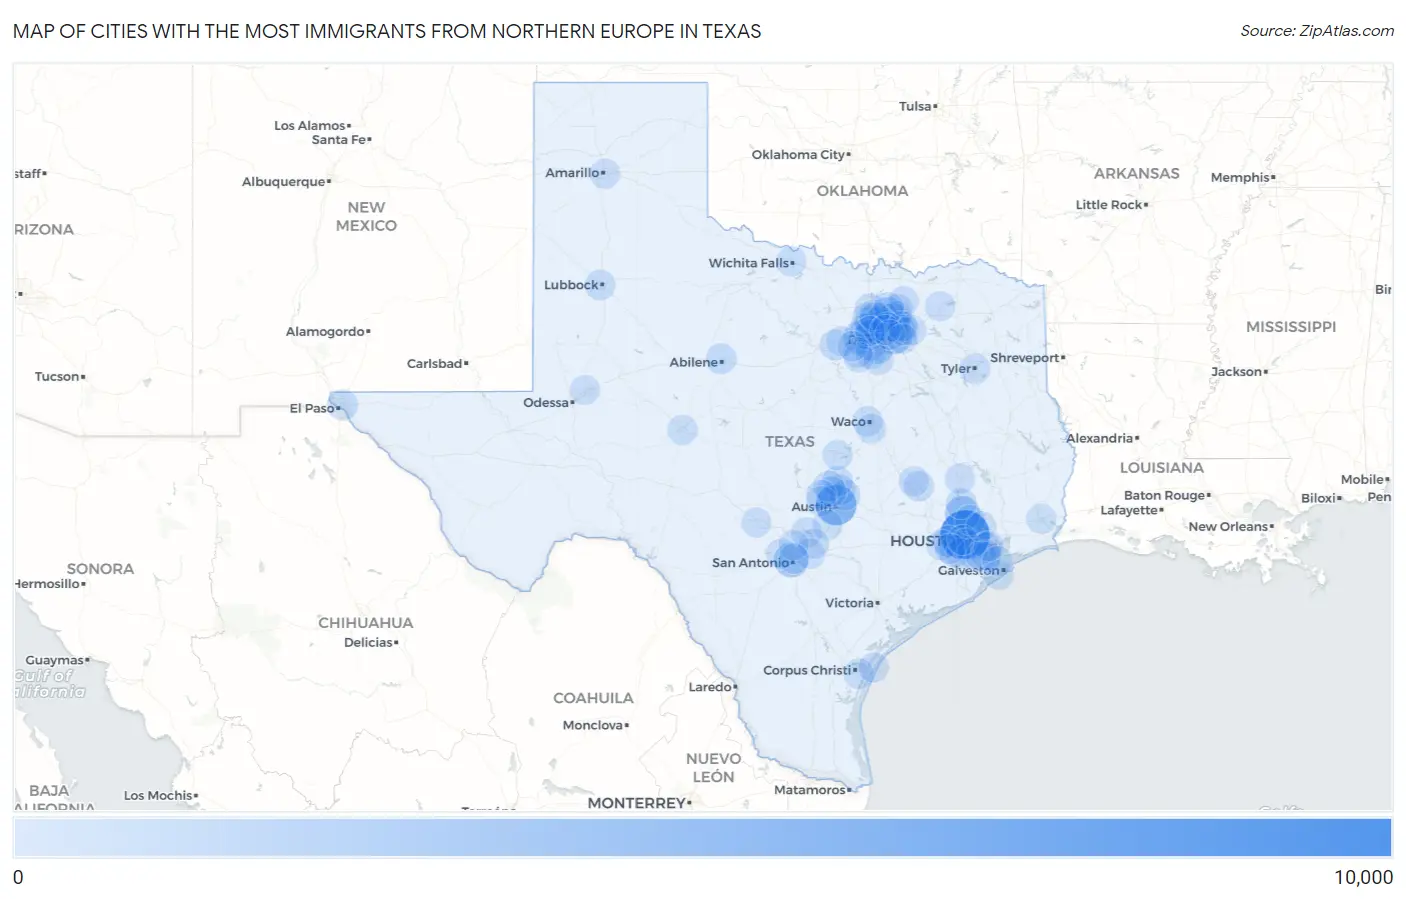
Map of Cities with the Most Immigrants from Northern Europe in Texas
0
10,000
Cities with the Most Immigrants from Northern Europe in Texas
| City | Northern Europe | vs State | vs National | |
| 1. | Houston | 8,059 | 66,462(12.13%)#1 | 944,917(0.85%)#5 |
| 2. | Austin | 4,308 | 66,462(6.48%)#2 | 944,917(0.46%)#10 |
| 3. | Dallas | 2,470 | 66,462(3.72%)#3 | 944,917(0.26%)#18 |
| 4. | The Woodlands | 2,039 | 66,462(3.07%)#4 | 944,917(0.22%)#24 |
| 5. | San Antonio | 1,872 | 66,462(2.82%)#5 | 944,917(0.20%)#26 |
| 6. | Frisco | 1,325 | 66,462(1.99%)#6 | 944,917(0.14%)#47 |
| 7. | Fort Worth | 1,319 | 66,462(1.98%)#7 | 944,917(0.14%)#48 |
| 8. | Plano | 1,255 | 66,462(1.89%)#8 | 944,917(0.13%)#52 |
| 9. | Grand Prairie | 1,111 | 66,462(1.67%)#9 | 944,917(0.12%)#73 |
| 10. | Sugar Land | 838 | 66,462(1.26%)#10 | 944,917(0.09%)#107 |
| 11. | Arlington | 692 | 66,462(1.04%)#11 | 944,917(0.07%)#144 |
| 12. | Irving | 686 | 66,462(1.03%)#12 | 944,917(0.07%)#146 |
| 13. | Cinco Ranch | 635 | 66,462(0.96%)#13 | 944,917(0.07%)#160 |
| 14. | League City | 544 | 66,462(0.82%)#14 | 944,917(0.06%)#185 |
| 15. | Mckinney | 499 | 66,462(0.75%)#15 | 944,917(0.05%)#203 |
| 16. | Southlake | 485 | 66,462(0.73%)#16 | 944,917(0.05%)#205 |
| 17. | Coppell | 468 | 66,462(0.70%)#17 | 944,917(0.05%)#213 |
| 18. | Round Rock | 405 | 66,462(0.61%)#18 | 944,917(0.04%)#280 |
| 19. | Pflugerville | 391 | 66,462(0.59%)#19 | 944,917(0.04%)#297 |
| 20. | Abilene | 390 | 66,462(0.59%)#20 | 944,917(0.04%)#299 |
| 21. | El Paso | 367 | 66,462(0.55%)#21 | 944,917(0.04%)#321 |
| 22. | Leander | 364 | 66,462(0.55%)#22 | 944,917(0.04%)#326 |
| 23. | Conroe | 361 | 66,462(0.54%)#23 | 944,917(0.04%)#332 |
| 24. | Weatherford | 337 | 66,462(0.51%)#24 | 944,917(0.04%)#350 |
| 25. | Steiner Ranch | 331 | 66,462(0.50%)#25 | 944,917(0.04%)#357 |
| 26. | Richardson | 319 | 66,462(0.48%)#26 | 944,917(0.03%)#374 |
| 27. | West University Place | 318 | 66,462(0.48%)#27 | 944,917(0.03%)#375 |
| 28. | Allen | 306 | 66,462(0.46%)#28 | 944,917(0.03%)#388 |
| 29. | Grapevine | 304 | 66,462(0.46%)#29 | 944,917(0.03%)#391 |
| 30. | Missouri City | 303 | 66,462(0.46%)#30 | 944,917(0.03%)#393 |
| 31. | Carrollton | 299 | 66,462(0.45%)#31 | 944,917(0.03%)#402 |
| 32. | Flower Mound | 297 | 66,462(0.45%)#32 | 944,917(0.03%)#406 |
| 33. | Garland | 277 | 66,462(0.42%)#33 | 944,917(0.03%)#449 |
| 34. | Denton | 276 | 66,462(0.42%)#34 | 944,917(0.03%)#454 |
| 35. | Lubbock | 261 | 66,462(0.39%)#35 | 944,917(0.03%)#493 |
| 36. | Tyler | 261 | 66,462(0.39%)#36 | 944,917(0.03%)#494 |
| 37. | Mansfield | 251 | 66,462(0.38%)#37 | 944,917(0.03%)#517 |
| 38. | Lewisville | 243 | 66,462(0.37%)#38 | 944,917(0.03%)#553 |
| 39. | College Station | 237 | 66,462(0.36%)#39 | 944,917(0.03%)#570 |
| 40. | Rowlett | 226 | 66,462(0.34%)#40 | 944,917(0.02%)#608 |
| 41. | Georgetown | 225 | 66,462(0.34%)#41 | 944,917(0.02%)#610 |
| 42. | Canyon Lake | 222 | 66,462(0.33%)#42 | 944,917(0.02%)#619 |
| 43. | Argyle | 222 | 66,462(0.33%)#43 | 944,917(0.02%)#623 |
| 44. | Corpus Christi | 218 | 66,462(0.33%)#44 | 944,917(0.02%)#639 |
| 45. | Waco | 203 | 66,462(0.31%)#45 | 944,917(0.02%)#690 |
| 46. | Bryan | 201 | 66,462(0.30%)#46 | 944,917(0.02%)#697 |
| 47. | North Richland Hills | 193 | 66,462(0.29%)#47 | 944,917(0.02%)#727 |
| 48. | Pearland | 179 | 66,462(0.27%)#48 | 944,917(0.02%)#781 |
| 49. | Keller | 176 | 66,462(0.26%)#49 | 944,917(0.02%)#787 |
| 50. | Cedar Park | 173 | 66,462(0.26%)#50 | 944,917(0.02%)#802 |
| 51. | Bedford | 173 | 66,462(0.26%)#51 | 944,917(0.02%)#804 |
| 52. | Cibolo | 173 | 66,462(0.26%)#52 | 944,917(0.02%)#807 |
| 53. | Wichita Falls | 167 | 66,462(0.25%)#53 | 944,917(0.02%)#835 |
| 54. | San Angelo | 164 | 66,462(0.25%)#54 | 944,917(0.02%)#857 |
| 55. | Lakeway | 164 | 66,462(0.25%)#55 | 944,917(0.02%)#862 |
| 56. | Killeen | 162 | 66,462(0.24%)#56 | 944,917(0.02%)#871 |
| 57. | Rockwall | 162 | 66,462(0.24%)#57 | 944,917(0.02%)#873 |
| 58. | Amarillo | 161 | 66,462(0.24%)#58 | 944,917(0.02%)#878 |
| 59. | The Colony | 160 | 66,462(0.24%)#59 | 944,917(0.02%)#888 |
| 60. | Bellaire | 156 | 66,462(0.23%)#60 | 944,917(0.02%)#920 |
| 61. | Pasadena | 153 | 66,462(0.23%)#61 | 944,917(0.02%)#939 |
| 62. | Helotes | 148 | 66,462(0.22%)#62 | 944,917(0.02%)#974 |
| 63. | Fulshear | 143 | 66,462(0.22%)#63 | 944,917(0.02%)#1,008 |
| 64. | Pecan Grove | 139 | 66,462(0.21%)#64 | 944,917(0.01%)#1,041 |
| 65. | Kyle | 136 | 66,462(0.20%)#65 | 944,917(0.01%)#1,061 |
| 66. | Highland Village | 127 | 66,462(0.19%)#66 | 944,917(0.01%)#1,137 |
| 67. | New Braunfels | 124 | 66,462(0.19%)#67 | 944,917(0.01%)#1,161 |
| 68. | Corinth | 124 | 66,462(0.19%)#68 | 944,917(0.01%)#1,166 |
| 69. | Robinson | 122 | 66,462(0.18%)#69 | 944,917(0.01%)#1,182 |
| 70. | Timberwood Park | 120 | 66,462(0.18%)#70 | 944,917(0.01%)#1,192 |
| 71. | Beaumont | 114 | 66,462(0.17%)#71 | 944,917(0.01%)#1,258 |
| 72. | Addison | 107 | 66,462(0.16%)#72 | 944,917(0.01%)#1,341 |
| 73. | Spring | 102 | 66,462(0.15%)#73 | 944,917(0.01%)#1,401 |
| 74. | Friendswood | 102 | 66,462(0.15%)#74 | 944,917(0.01%)#1,402 |
| 75. | Colleyville | 102 | 66,462(0.15%)#75 | 944,917(0.01%)#1,404 |
| 76. | Anna | 102 | 66,462(0.15%)#76 | 944,917(0.01%)#1,411 |
| 77. | Kerrville | 101 | 66,462(0.15%)#77 | 944,917(0.01%)#1,427 |
| 78. | Sienna | 99 | 66,462(0.15%)#78 | 944,917(0.01%)#1,458 |
| 79. | Midlothian | 97 | 66,462(0.15%)#79 | 944,917(0.01%)#1,484 |
| 80. | Alamo Heights | 97 | 66,462(0.15%)#80 | 944,917(0.01%)#1,495 |
| 81. | Lago Vista | 95 | 66,462(0.14%)#81 | 944,917(0.01%)#1,534 |
| 82. | Piney Point Village | 95 | 66,462(0.14%)#82 | 944,917(0.01%)#1,537 |
| 83. | Sachse | 94 | 66,462(0.14%)#83 | 944,917(0.01%)#1,541 |
| 84. | Nassau Bay | 94 | 66,462(0.14%)#84 | 944,917(0.01%)#1,544 |
| 85. | Willow Park | 94 | 66,462(0.14%)#85 | 944,917(0.01%)#1,545 |
| 86. | Prosper | 93 | 66,462(0.14%)#86 | 944,917(0.01%)#1,551 |
| 87. | Atascocita | 92 | 66,462(0.14%)#87 | 944,917(0.01%)#1,565 |
| 88. | Galveston | 92 | 66,462(0.14%)#88 | 944,917(0.01%)#1,566 |
| 89. | La Porte | 91 | 66,462(0.14%)#89 | 944,917(0.01%)#1,586 |
| 90. | Port Aransas | 88 | 66,462(0.13%)#90 | 944,917(0.01%)#1,650 |
| 91. | Huntsville | 87 | 66,462(0.13%)#91 | 944,917(0.01%)#1,657 |
| 92. | Crowley | 86 | 66,462(0.13%)#92 | 944,917(0.01%)#1,670 |
| 93. | Burleson | 84 | 66,462(0.13%)#93 | 944,917(0.01%)#1,688 |
| 94. | Farmers Branch | 81 | 66,462(0.12%)#94 | 944,917(0.01%)#1,730 |
| 95. | University Park | 81 | 66,462(0.12%)#95 | 944,917(0.01%)#1,731 |
| 96. | Commerce | 78 | 66,462(0.12%)#96 | 944,917(0.01%)#1,793 |
| 97. | Midland | 77 | 66,462(0.12%)#97 | 944,917(0.01%)#1,798 |
| 98. | Benbrook | 76 | 66,462(0.11%)#98 | 944,917(0.01%)#1,821 |
| 99. | Sunnyvale | 74 | 66,462(0.11%)#99 | 944,917(0.01%)#1,865 |
| 100. | Texas City | 73 | 66,462(0.11%)#100 | 944,917(0.01%)#1,869 |
Common Questions
What are the Top 10 Cities with the Most Immigrants from Northern Europe in Texas?
Top 10 Cities with the Most Immigrants from Northern Europe in Texas are:
#1
8,059
#2
4,308
#3
2,470
#4
2,039
#5
1,872
#6
1,325
#7
1,319
#8
1,255
#9
1,111
#10
838
What city has the Most Immigrants from Northern Europe in Texas?
Houston has the Most Immigrants from Northern Europe in Texas with 8,059.
What is the Total Immigrants from Northern Europe in the State of Texas?
Total Immigrants from Northern Europe in Texas is 66,462.
What is the Total Immigrants from Northern Europe in the United States?
Total Immigrants from Northern Europe in the United States is 944,917.