Cities with the Most Immigrants from South Eastern Asia in Texas
RELATED REPORTS & OPTIONS
South Eastern Asia
Texas
Compare Cities
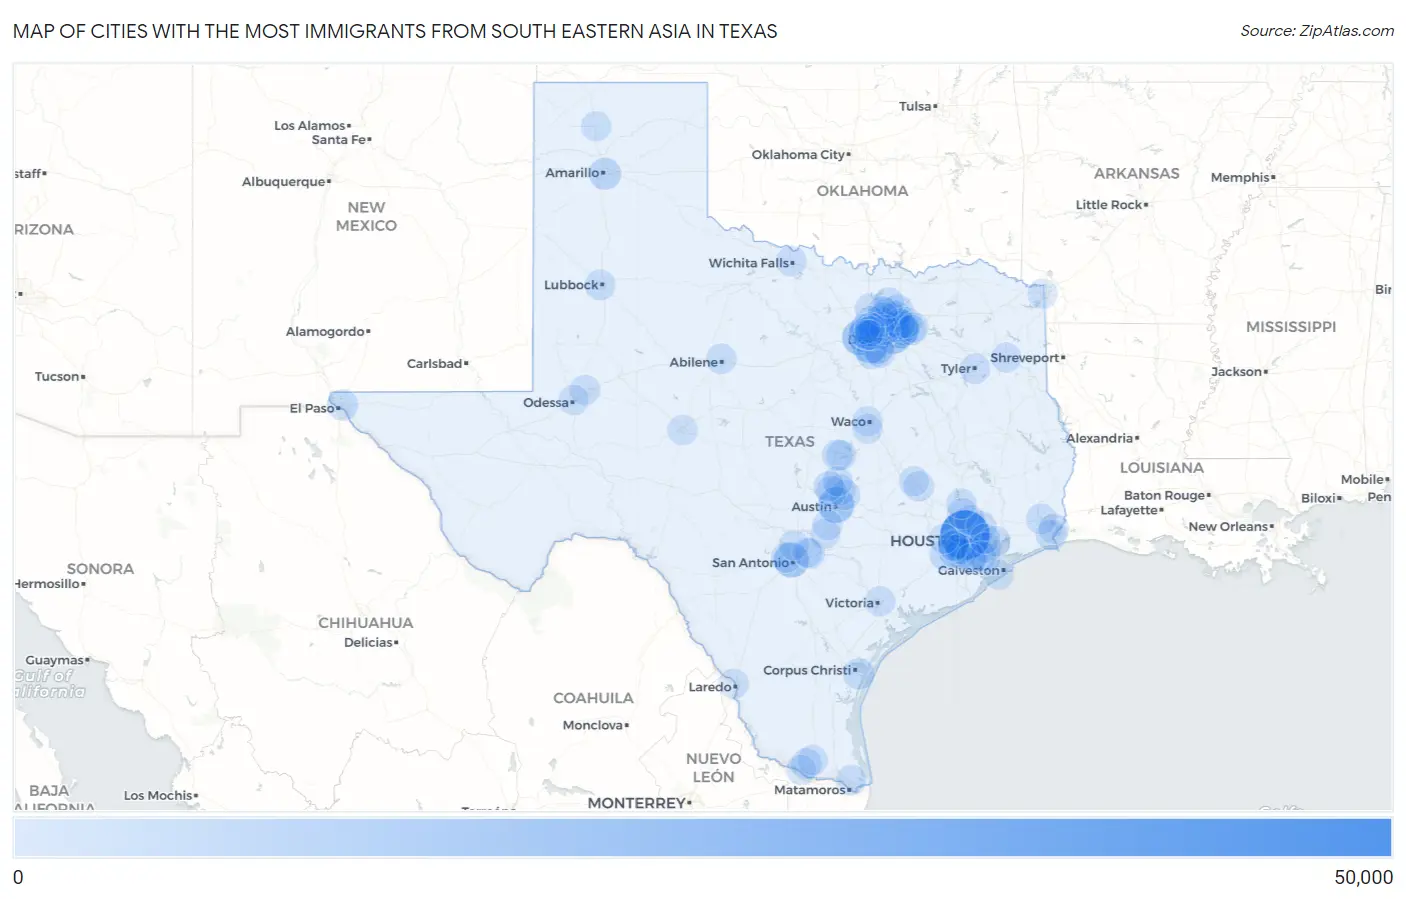
Map of Cities with the Most Immigrants from South Eastern Asia in Texas
0
50,000
Cities with the Most Immigrants from South Eastern Asia in Texas
| City | South Eastern Asia | vs State | vs National | |
| 1. | Houston | 42,396 | 354,725(11.95%)#1 | 4,292,058(0.99%)#7 |
| 2. | Garland | 13,959 | 354,725(3.94%)#2 | 4,292,058(0.33%)#38 |
| 3. | Arlington | 12,920 | 354,725(3.64%)#3 | 4,292,058(0.30%)#43 |
| 4. | Austin | 12,522 | 354,725(3.53%)#4 | 4,292,058(0.29%)#45 |
| 5. | Fort Worth | 12,021 | 354,725(3.39%)#5 | 4,292,058(0.28%)#48 |
| 6. | Dallas | 10,776 | 354,725(3.04%)#6 | 4,292,058(0.25%)#55 |
| 7. | San Antonio | 10,577 | 354,725(2.98%)#7 | 4,292,058(0.25%)#57 |
| 8. | Plano | 6,043 | 354,725(1.70%)#8 | 4,292,058(0.14%)#101 |
| 9. | Pearland | 6,022 | 354,725(1.70%)#9 | 4,292,058(0.14%)#102 |
| 10. | Sugar Land | 5,845 | 354,725(1.65%)#10 | 4,292,058(0.14%)#107 |
| 11. | Grand Prairie | 5,684 | 354,725(1.60%)#11 | 4,292,058(0.13%)#111 |
| 12. | Amarillo | 4,231 | 354,725(1.19%)#12 | 4,292,058(0.10%)#151 |
| 13. | Irving | 3,440 | 354,725(0.97%)#13 | 4,292,058(0.08%)#185 |
| 14. | Frisco | 3,368 | 354,725(0.95%)#14 | 4,292,058(0.08%)#192 |
| 15. | Richardson | 3,314 | 354,725(0.93%)#15 | 4,292,058(0.08%)#196 |
| 16. | Carrollton | 3,282 | 354,725(0.93%)#16 | 4,292,058(0.08%)#197 |
| 17. | Lewisville | 3,245 | 354,725(0.91%)#17 | 4,292,058(0.08%)#199 |
| 18. | Corpus Christi | 2,998 | 354,725(0.85%)#18 | 4,292,058(0.07%)#211 |
| 19. | Sachse | 2,753 | 354,725(0.78%)#19 | 4,292,058(0.06%)#229 |
| 20. | Mckinney | 2,634 | 354,725(0.74%)#20 | 4,292,058(0.06%)#234 |
| 21. | Haltom City | 2,615 | 354,725(0.74%)#21 | 4,292,058(0.06%)#237 |
| 22. | Allen | 2,394 | 354,725(0.67%)#22 | 4,292,058(0.06%)#261 |
| 23. | Rowlett | 2,187 | 354,725(0.62%)#23 | 4,292,058(0.05%)#284 |
| 24. | El Paso | 2,152 | 354,725(0.61%)#24 | 4,292,058(0.05%)#286 |
| 25. | Missouri City | 2,139 | 354,725(0.60%)#25 | 4,292,058(0.05%)#288 |
| 26. | Rosenberg | 1,980 | 354,725(0.56%)#26 | 4,292,058(0.05%)#316 |
| 27. | Killeen | 1,945 | 354,725(0.55%)#27 | 4,292,058(0.05%)#324 |
| 28. | Mission Bend | 1,909 | 354,725(0.54%)#28 | 4,292,058(0.04%)#330 |
| 29. | League City | 1,784 | 354,725(0.50%)#29 | 4,292,058(0.04%)#352 |
| 30. | Wylie | 1,667 | 354,725(0.47%)#30 | 4,292,058(0.04%)#373 |
| 31. | Mcallen | 1,628 | 354,725(0.46%)#31 | 4,292,058(0.04%)#381 |
| 32. | Lubbock | 1,597 | 354,725(0.45%)#32 | 4,292,058(0.04%)#387 |
| 33. | Port Arthur | 1,532 | 354,725(0.43%)#33 | 4,292,058(0.04%)#401 |
| 34. | The Woodlands | 1,489 | 354,725(0.42%)#34 | 4,292,058(0.03%)#414 |
| 35. | Euless | 1,383 | 354,725(0.39%)#35 | 4,292,058(0.03%)#453 |
| 36. | Mansfield | 1,380 | 354,725(0.39%)#36 | 4,292,058(0.03%)#456 |
| 37. | Round Rock | 1,354 | 354,725(0.38%)#37 | 4,292,058(0.03%)#466 |
| 38. | Stafford | 1,352 | 354,725(0.38%)#38 | 4,292,058(0.03%)#468 |
| 39. | Beaumont | 1,238 | 354,725(0.35%)#39 | 4,292,058(0.03%)#496 |
| 40. | Pflugerville | 1,207 | 354,725(0.34%)#40 | 4,292,058(0.03%)#507 |
| 41. | Abilene | 1,142 | 354,725(0.32%)#41 | 4,292,058(0.03%)#531 |
| 42. | Murphy | 1,114 | 354,725(0.31%)#42 | 4,292,058(0.03%)#543 |
| 43. | College Station | 1,080 | 354,725(0.30%)#43 | 4,292,058(0.03%)#560 |
| 44. | Wichita Falls | 1,050 | 354,725(0.30%)#44 | 4,292,058(0.02%)#572 |
| 45. | Midland | 1,042 | 354,725(0.29%)#45 | 4,292,058(0.02%)#580 |
| 46. | Denton | 1,003 | 354,725(0.28%)#46 | 4,292,058(0.02%)#601 |
| 47. | Atascocita | 959 | 354,725(0.27%)#47 | 4,292,058(0.02%)#625 |
| 48. | Four Corners | 937 | 354,725(0.26%)#48 | 4,292,058(0.02%)#638 |
| 49. | Cedar Park | 916 | 354,725(0.26%)#49 | 4,292,058(0.02%)#650 |
| 50. | North Richland Hills | 872 | 354,725(0.25%)#50 | 4,292,058(0.02%)#675 |
| 51. | Pasadena | 857 | 354,725(0.24%)#51 | 4,292,058(0.02%)#690 |
| 52. | Tyler | 856 | 354,725(0.24%)#52 | 4,292,058(0.02%)#694 |
| 53. | The Colony | 844 | 354,725(0.24%)#53 | 4,292,058(0.02%)#704 |
| 54. | Edinburg | 801 | 354,725(0.23%)#54 | 4,292,058(0.02%)#740 |
| 55. | Baytown | 767 | 354,725(0.22%)#55 | 4,292,058(0.02%)#762 |
| 56. | Spring | 765 | 354,725(0.22%)#56 | 4,292,058(0.02%)#764 |
| 57. | Leon Valley | 742 | 354,725(0.21%)#57 | 4,292,058(0.02%)#782 |
| 58. | Brownsville | 732 | 354,725(0.21%)#58 | 4,292,058(0.02%)#790 |
| 59. | Coppell | 700 | 354,725(0.20%)#59 | 4,292,058(0.02%)#824 |
| 60. | Watauga | 666 | 354,725(0.19%)#60 | 4,292,058(0.02%)#864 |
| 61. | Flower Mound | 664 | 354,725(0.19%)#61 | 4,292,058(0.02%)#865 |
| 62. | Groves | 659 | 354,725(0.19%)#62 | 4,292,058(0.02%)#869 |
| 63. | Conroe | 643 | 354,725(0.18%)#63 | 4,292,058(0.01%)#882 |
| 64. | Manvel | 634 | 354,725(0.18%)#64 | 4,292,058(0.01%)#892 |
| 65. | Grapevine | 618 | 354,725(0.17%)#65 | 4,292,058(0.01%)#907 |
| 66. | Farmers Branch | 585 | 354,725(0.16%)#66 | 4,292,058(0.01%)#941 |
| 67. | Odessa | 573 | 354,725(0.16%)#67 | 4,292,058(0.01%)#952 |
| 68. | Southlake | 572 | 354,725(0.16%)#68 | 4,292,058(0.01%)#955 |
| 69. | Waco | 571 | 354,725(0.16%)#69 | 4,292,058(0.01%)#956 |
| 70. | Celina | 566 | 354,725(0.16%)#70 | 4,292,058(0.01%)#961 |
| 71. | Friendswood | 546 | 354,725(0.15%)#71 | 4,292,058(0.01%)#982 |
| 72. | Cibolo | 531 | 354,725(0.15%)#72 | 4,292,058(0.01%)#997 |
| 73. | Leander | 500 | 354,725(0.14%)#73 | 4,292,058(0.01%)#1,034 |
| 74. | Harker Heights | 469 | 354,725(0.13%)#74 | 4,292,058(0.01%)#1,074 |
| 75. | Cedar Hill | 458 | 354,725(0.13%)#75 | 4,292,058(0.01%)#1,093 |
| 76. | Little Elm | 457 | 354,725(0.13%)#76 | 4,292,058(0.01%)#1,096 |
| 77. | Sienna | 452 | 354,725(0.13%)#77 | 4,292,058(0.01%)#1,108 |
| 78. | San Marcos | 433 | 354,725(0.12%)#78 | 4,292,058(0.01%)#1,149 |
| 79. | Georgetown | 424 | 354,725(0.12%)#79 | 4,292,058(0.01%)#1,165 |
| 80. | Timberwood Park | 414 | 354,725(0.12%)#80 | 4,292,058(0.01%)#1,195 |
| 81. | Bedford | 407 | 354,725(0.11%)#81 | 4,292,058(0.01%)#1,212 |
| 82. | Longview | 403 | 354,725(0.11%)#82 | 4,292,058(0.01%)#1,225 |
| 83. | Keller | 397 | 354,725(0.11%)#83 | 4,292,058(0.01%)#1,242 |
| 84. | Victoria | 390 | 354,725(0.11%)#84 | 4,292,058(0.01%)#1,259 |
| 85. | Schertz | 390 | 354,725(0.11%)#85 | 4,292,058(0.01%)#1,260 |
| 86. | Channelview | 372 | 354,725(0.10%)#86 | 4,292,058(0.01%)#1,305 |
| 87. | Dumas | 365 | 354,725(0.10%)#87 | 4,292,058(0.01%)#1,331 |
| 88. | Katy | 341 | 354,725(0.10%)#88 | 4,292,058(0.01%)#1,406 |
| 89. | Rockwall | 333 | 354,725(0.09%)#89 | 4,292,058(0.01%)#1,432 |
| 90. | Galveston | 330 | 354,725(0.09%)#90 | 4,292,058(0.01%)#1,440 |
| 91. | Texarkana | 325 | 354,725(0.09%)#91 | 4,292,058(0.01%)#1,455 |
| 92. | Colleyville | 320 | 354,725(0.09%)#92 | 4,292,058(0.01%)#1,475 |
| 93. | Laredo | 319 | 354,725(0.09%)#93 | 4,292,058(0.01%)#1,479 |
| 94. | Fate | 315 | 354,725(0.09%)#94 | 4,292,058(0.01%)#1,486 |
| 95. | Hewitt | 313 | 354,725(0.09%)#95 | 4,292,058(0.01%)#1,493 |
| 96. | Hurst | 302 | 354,725(0.09%)#96 | 4,292,058(0.01%)#1,535 |
| 97. | San Angelo | 301 | 354,725(0.08%)#97 | 4,292,058(0.01%)#1,542 |
| 98. | Bryan | 284 | 354,725(0.08%)#98 | 4,292,058(0.01%)#1,600 |
| 99. | Kyle | 277 | 354,725(0.08%)#99 | 4,292,058(0.01%)#1,631 |
| 100. | Mission | 274 | 354,725(0.08%)#100 | 4,292,058(0.01%)#1,643 |
Common Questions
What are the Top 10 Cities with the Most Immigrants from South Eastern Asia in Texas?
Top 10 Cities with the Most Immigrants from South Eastern Asia in Texas are:
#1
42,396
#2
13,959
#3
12,920
#4
12,522
#5
12,021
#6
10,776
#7
10,577
#8
6,043
#9
6,022
#10
5,845
What city has the Most Immigrants from South Eastern Asia in Texas?
Houston has the Most Immigrants from South Eastern Asia in Texas with 42,396.
What is the Total Immigrants from South Eastern Asia in the State of Texas?
Total Immigrants from South Eastern Asia in Texas is 354,725.
What is the Total Immigrants from South Eastern Asia in the United States?
Total Immigrants from South Eastern Asia in the United States is 4,292,058.