Cities with the Highest Percentage of Immigrants from Trinidad and Tobago in Texas
RELATED REPORTS & OPTIONS
Trinidad and Tobago
Texas
Compare Cities
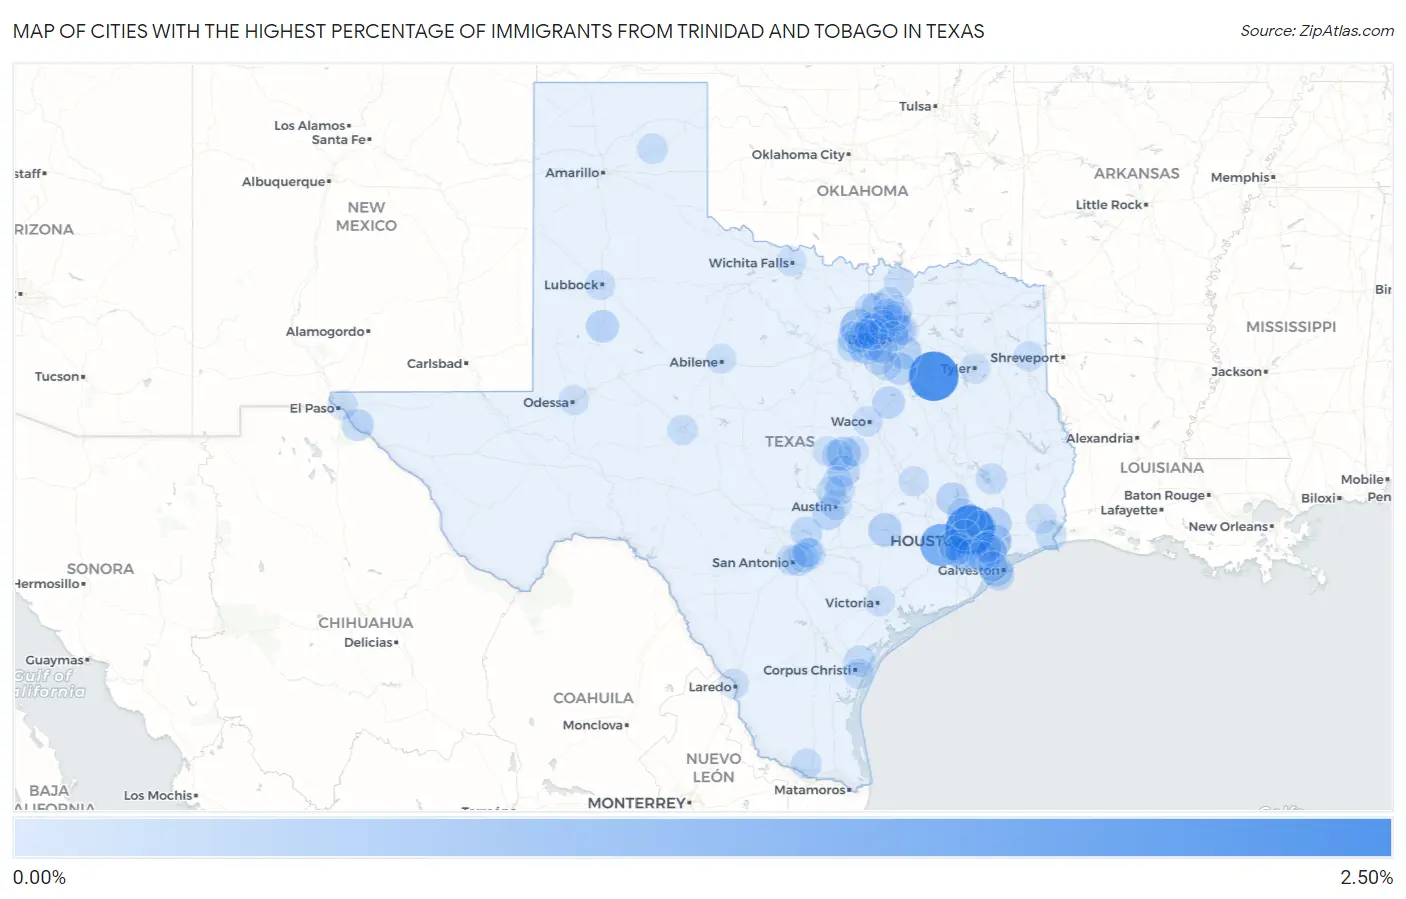
Map of Cities with the Highest Percentage of Immigrants from Trinidad and Tobago in Texas
0.00%
2.50%
Cities with the Highest Percentage of Immigrants from Trinidad and Tobago in Texas
| City | Trinidad and Tobago | vs State | vs National | |
| 1. | Log Cabin | 2.34% | 0.033%(+2.31)#-1 | 0.070%(+2.27)#0 |
| 2. | Aldine | 2.27% | 0.033%(+2.24)#0 | 0.070%(+2.20)#1 |
| 3. | Fulshear | 1.44% | 0.033%(+1.41)#1 | 0.070%(+1.37)#2 |
| 4. | Haslet | 0.81% | 0.033%(+0.780)#2 | 0.070%(+0.744)#3 |
| 5. | Nolanville | 0.46% | 0.033%(+0.426)#3 | 0.070%(+0.389)#4 |
| 6. | La Grange | 0.41% | 0.033%(+0.375)#4 | 0.070%(+0.338)#5 |
| 7. | Oak Ridge Town Kaufman County | 0.41% | 0.033%(+0.375)#5 | 0.070%(+0.338)#6 |
| 8. | Baytown | 0.40% | 0.033%(+0.364)#6 | 0.070%(+0.327)#7 |
| 9. | Combine | 0.38% | 0.033%(+0.350)#7 | 0.070%(+0.313)#8 |
| 10. | Dayton | 0.34% | 0.033%(+0.306)#8 | 0.070%(+0.270)#9 |
| 11. | Tiki Island | 0.33% | 0.033%(+0.301)#9 | 0.070%(+0.265)#10 |
| 12. | O Donnell | 0.32% | 0.033%(+0.287)#10 | 0.070%(+0.251)#11 |
| 13. | Montgomery | 0.31% | 0.033%(+0.276)#11 | 0.070%(+0.239)#12 |
| 14. | Fresno | 0.29% | 0.033%(+0.259)#12 | 0.070%(+0.222)#13 |
| 15. | Cross Roads | 0.29% | 0.033%(+0.258)#13 | 0.070%(+0.222)#14 |
| 16. | Ennis | 0.29% | 0.033%(+0.257)#14 | 0.070%(+0.220)#15 |
| 17. | Hubbard | 0.27% | 0.033%(+0.237)#15 | 0.070%(+0.200)#16 |
| 18. | Shady Hollow | 0.26% | 0.033%(+0.231)#16 | 0.070%(+0.194)#17 |
| 19. | Fabens | 0.26% | 0.033%(+0.231)#17 | 0.070%(+0.194)#18 |
| 20. | Richardson | 0.23% | 0.033%(+0.202)#24 | 0.070%(+0.165)#492 |
| 21. | Lake Worth | 0.23% | 0.033%(+0.201)#25 | 0.070%(+0.164)#493 |
| 22. | Spring | 0.22% | 0.033%(+0.191)#26 | 0.070%(+0.154)#494 |
| 23. | Sonterra | 0.22% | 0.033%(+0.190)#27 | 0.070%(+0.153)#495 |
| 24. | Canyon Lake | 0.18% | 0.033%(+0.145)#28 | 0.070%(+0.108)#496 |
| 25. | Missouri City | 0.17% | 0.033%(+0.136)#29 | 0.070%(+0.099)#497 |
| 26. | Portland | 0.17% | 0.033%(+0.136)#30 | 0.070%(+0.099)#498 |
| 27. | Kennedale | 0.16% | 0.033%(+0.130)#31 | 0.070%(+0.093)#499 |
| 28. | Kirby | 0.16% | 0.033%(+0.127)#32 | 0.070%(+0.090)#500 |
| 29. | Galveston | 0.15% | 0.033%(+0.121)#33 | 0.070%(+0.084)#501 |
| 30. | Cibolo | 0.15% | 0.033%(+0.117)#34 | 0.070%(+0.080)#502 |
| 31. | Benbrook | 0.14% | 0.033%(+0.111)#35 | 0.070%(+0.074)#503 |
| 32. | Celina | 0.13% | 0.033%(+0.097)#36 | 0.070%(+0.060)#504 |
| 33. | Port Arthur | 0.12% | 0.033%(+0.087)#37 | 0.070%(+0.050)#505 |
| 34. | West Livingston | 0.12% | 0.033%(+0.086)#38 | 0.070%(+0.049)#506 |
| 35. | Colleyville | 0.12% | 0.033%(+0.083)#39 | 0.070%(+0.046)#507 |
| 36. | Mission Bend | 0.11% | 0.033%(+0.081)#40 | 0.070%(+0.044)#508 |
| 37. | Atascocita | 0.11% | 0.033%(+0.078)#41 | 0.070%(+0.041)#509 |
| 38. | Killeen | 0.11% | 0.033%(+0.078)#42 | 0.070%(+0.041)#510 |
| 39. | Stafford | 0.11% | 0.033%(+0.077)#43 | 0.070%(+0.040)#511 |
| 40. | League City | 0.11% | 0.033%(+0.073)#44 | 0.070%(+0.036)#512 |
| 41. | Plano | 0.099% | 0.033%(+0.066)#45 | 0.070%(+0.029)#513 |
| 42. | The Woodlands | 0.095% | 0.033%(+0.062)#46 | 0.070%(+0.026)#514 |
| 43. | Waxahachie | 0.079% | 0.033%(+0.046)#47 | 0.070%(+0.009)#515 |
| 44. | Shoreacres | 0.075% | 0.033%(+0.042)#48 | 0.070%(+0.006)#516 |
| 45. | Lewisville | 0.074% | 0.033%(+0.041)#49 | 0.070%(+0.004)#517 |
| 46. | Garland | 0.072% | 0.033%(+0.039)#50 | 0.070%(+0.002)#518 |
| 47. | Pampa | 0.071% | 0.033%(+0.038)#51 | 0.070%(+0.001)#519 |
| 48. | Houston | 0.063% | 0.033%(+0.030)#52 | 0.070%(-0.007)#520 |
| 49. | Mcallen | 0.060% | 0.033%(+0.027)#53 | 0.070%(-0.010)#521 |
| 50. | Denton | 0.059% | 0.033%(+0.026)#54 | 0.070%(-0.011)#522 |
| 51. | Waco | 0.055% | 0.033%(+0.022)#55 | 0.070%(-0.014)#523 |
| 52. | Grapevine | 0.055% | 0.033%(+0.022)#56 | 0.070%(-0.015)#524 |
| 53. | Converse | 0.053% | 0.033%(+0.020)#57 | 0.070%(-0.016)#525 |
| 54. | Hurst | 0.052% | 0.033%(+0.019)#58 | 0.070%(-0.017)#526 |
| 55. | Forest Hill | 0.051% | 0.033%(+0.018)#59 | 0.070%(-0.019)#527 |
| 56. | La Porte | 0.048% | 0.033%(+0.014)#60 | 0.070%(-0.022)#528 |
| 57. | Austin | 0.046% | 0.033%(+0.013)#61 | 0.070%(-0.024)#529 |
| 58. | Lubbock | 0.045% | 0.033%(+0.011)#62 | 0.070%(-0.025)#530 |
| 59. | Seabrook | 0.044% | 0.033%(+0.011)#63 | 0.070%(-0.026)#531 |
| 60. | Georgetown | 0.043% | 0.033%(+0.010)#64 | 0.070%(-0.027)#532 |
| 61. | Arlington | 0.042% | 0.033%(+0.009)#65 | 0.070%(-0.027)#533 |
| 62. | Pearland | 0.042% | 0.033%(+0.009)#66 | 0.070%(-0.028)#534 |
| 63. | Southlake | 0.039% | 0.033%(+0.006)#67 | 0.070%(-0.031)#535 |
| 64. | Friendswood | 0.037% | 0.033%(+0.004)#68 | 0.070%(-0.033)#536 |
| 65. | Pasadena | 0.035% | 0.033%(+0.001)#69 | 0.070%(-0.035)#537 |
| 66. | Farmers Branch | 0.031% | 0.033%(-0.002)#70 | 0.070%(-0.039)#538 |
| 67. | Bryan | 0.028% | 0.033%(-0.005)#71 | 0.070%(-0.042)#539 |
| 68. | Midlothian | 0.028% | 0.033%(-0.005)#72 | 0.070%(-0.042)#540 |
| 69. | Corpus Christi | 0.027% | 0.033%(-0.006)#73 | 0.070%(-0.042)#541 |
| 70. | Temple | 0.025% | 0.033%(-0.008)#74 | 0.070%(-0.045)#542 |
| 71. | Sugar Land | 0.025% | 0.033%(-0.009)#75 | 0.070%(-0.045)#543 |
| 72. | San Angelo | 0.023% | 0.033%(-0.010)#76 | 0.070%(-0.047)#544 |
| 73. | Grand Prairie | 0.023% | 0.033%(-0.010)#77 | 0.070%(-0.047)#545 |
| 74. | Irving | 0.023% | 0.033%(-0.010)#78 | 0.070%(-0.047)#546 |
| 75. | Sherman | 0.023% | 0.033%(-0.010)#79 | 0.070%(-0.047)#547 |
| 76. | Duncanville | 0.022% | 0.033%(-0.011)#80 | 0.070%(-0.047)#548 |
| 77. | La Marque | 0.022% | 0.033%(-0.011)#81 | 0.070%(-0.048)#549 |
| 78. | Marshall | 0.021% | 0.033%(-0.012)#82 | 0.070%(-0.049)#550 |
| 79. | San Antonio | 0.020% | 0.033%(-0.013)#83 | 0.070%(-0.050)#551 |
| 80. | Copperas Cove | 0.019% | 0.033%(-0.014)#84 | 0.070%(-0.051)#552 |
| 81. | Schertz | 0.019% | 0.033%(-0.014)#85 | 0.070%(-0.051)#553 |
| 82. | Fort Worth | 0.015% | 0.033%(-0.018)#86 | 0.070%(-0.055)#554 |
| 83. | Round Rock | 0.013% | 0.033%(-0.020)#87 | 0.070%(-0.057)#555 |
| 84. | Cedar Park | 0.013% | 0.033%(-0.020)#88 | 0.070%(-0.057)#556 |
| 85. | Rowlett | 0.013% | 0.033%(-0.020)#89 | 0.070%(-0.057)#557 |
| 86. | Victoria | 0.012% | 0.033%(-0.021)#90 | 0.070%(-0.058)#558 |
| 87. | Tyler | 0.011% | 0.033%(-0.022)#91 | 0.070%(-0.059)#559 |
| 88. | Wichita Falls | 0.011% | 0.033%(-0.022)#92 | 0.070%(-0.059)#560 |
| 89. | Odessa | 0.011% | 0.033%(-0.022)#93 | 0.070%(-0.059)#561 |
| 90. | Beaumont | 0.010% | 0.033%(-0.023)#94 | 0.070%(-0.059)#562 |
| 91. | Allen | 0.010% | 0.033%(-0.023)#95 | 0.070%(-0.059)#563 |
| 92. | Carrollton | 0.0091% | 0.033%(-0.024)#96 | 0.070%(-0.061)#564 |
| 93. | Mckinney | 0.0087% | 0.033%(-0.024)#97 | 0.070%(-0.061)#565 |
| 94. | El Paso | 0.0084% | 0.033%(-0.025)#98 | 0.070%(-0.061)#566 |
| 95. | Euless | 0.0083% | 0.033%(-0.025)#99 | 0.070%(-0.062)#567 |
| 96. | North Richland Hills | 0.0071% | 0.033%(-0.026)#100 | 0.070%(-0.063)#568 |
| 97. | Abilene | 0.0063% | 0.033%(-0.027)#101 | 0.070%(-0.064)#569 |
| 98. | Frisco | 0.0059% | 0.033%(-0.027)#102 | 0.070%(-0.064)#570 |
| 99. | Dallas | 0.0045% | 0.033%(-0.029)#103 | 0.070%(-0.065)#571 |
| 100. | Laredo | 0.0043% | 0.033%(-0.029)#104 | 0.070%(-0.066)#572 |
Common Questions
What are the Top 10 Cities with the Highest Percentage of Immigrants from Trinidad and Tobago in Texas?
Top 10 Cities with the Highest Percentage of Immigrants from Trinidad and Tobago in Texas are:
#1
2.34%
#2
2.27%
#3
1.44%
#4
0.81%
#5
0.46%
#6
0.41%
#7
0.40%
#8
0.38%
#9
0.34%
#10
0.33%
What city has the Highest Percentage of Immigrants from Trinidad and Tobago in Texas?
Log Cabin has the Highest Percentage of Immigrants from Trinidad and Tobago in Texas with 2.34%.
What is the Percentage of Immigrants from Trinidad and Tobago in the State of Texas?
Percentage of Immigrants from Trinidad and Tobago in Texas is 0.033%.
What is the Percentage of Immigrants from Trinidad and Tobago in the United States?
Percentage of Immigrants from Trinidad and Tobago in the United States is 0.070%.