Cities with the Highest Percentage of Immigrants from Russia in Texas
RELATED REPORTS & OPTIONS
Russia
Texas
Compare Cities
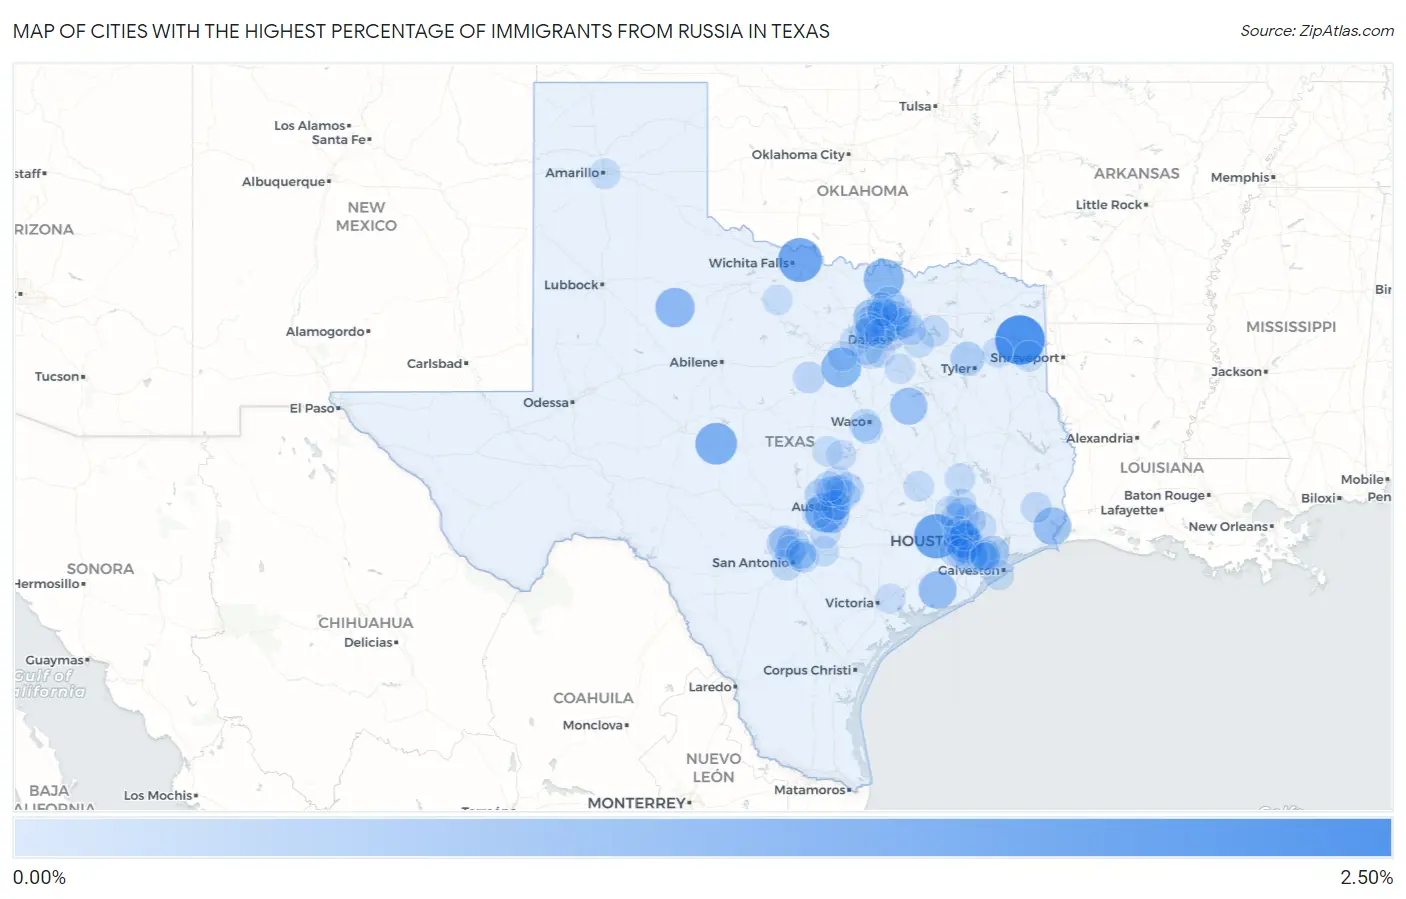
Map of Cities with the Highest Percentage of Immigrants from Russia in Texas
0.00%
2.50%
Cities with the Highest Percentage of Immigrants from Russia in Texas
| City | Russia | vs State | vs National | |
| 1. | Pine Harbor | 2.48% | 0.058%(+2.42)#1 | 0.12%(+2.35)#81 |
| 2. | Pattison | 1.83% | 0.058%(+1.78)#2 | 0.12%(+1.71)#137 |
| 3. | Dean | 1.77% | 0.058%(+1.71)#3 | 0.12%(+1.64)#148 |
| 4. | Eden | 1.48% | 0.058%(+1.42)#4 | 0.12%(+1.36)#197 |
| 5. | Whitesboro | 1.28% | 0.058%(+1.23)#5 | 0.12%(+1.16)#265 |
| 6. | Pecan Plantation | 1.25% | 0.058%(+1.19)#6 | 0.12%(+1.12)#278 |
| 7. | Bear Creek | 1.24% | 0.058%(+1.18)#7 | 0.12%(+1.11)#283 |
| 8. | Jayton | 1.19% | 0.058%(+1.13)#8 | 0.12%(+1.06)#294 |
| 9. | Bay City | 1.01% | 0.058%(+0.955)#9 | 0.12%(+0.890)#360 |
| 10. | Port Neches | 0.99% | 0.058%(+0.932)#10 | 0.12%(+0.867)#368 |
| 11. | Bellaire | 0.98% | 0.058%(+0.927)#11 | 0.12%(+0.862)#373 |
| 12. | Wortham | 0.92% | 0.058%(+0.864)#12 | 0.12%(+0.799)#406 |
| 13. | San Leanna | 0.81% | 0.058%(+0.755)#13 | 0.12%(+0.690)#475 |
| 14. | Lantana | 0.78% | 0.058%(+0.719)#14 | 0.12%(+0.655)#504 |
| 15. | Bunker Hill Village | 0.71% | 0.058%(+0.649)#15 | 0.12%(+0.584)#568 |
| 16. | Hunters Creek Village | 0.62% | 0.058%(+0.558)#16 | 0.12%(+0.493)#680 |
| 17. | Lindale | 0.53% | 0.058%(+0.476)#17 | 0.12%(+0.412)#801 |
| 18. | Seabrook | 0.49% | 0.058%(+0.429)#18 | 0.12%(+0.364)#880 |
| 19. | Lago Vista | 0.40% | 0.058%(+0.342)#19 | 0.12%(+0.277)#1,064 |
| 20. | Manvel | 0.36% | 0.058%(+0.297)#20 | 0.12%(+0.232)#1,179 |
| 21. | The Woodlands | 0.35% | 0.058%(+0.293)#21 | 0.12%(+0.229)#1,190 |
| 22. | Hutto | 0.35% | 0.058%(+0.288)#22 | 0.12%(+0.223)#1,206 |
| 23. | Rollingwood | 0.33% | 0.058%(+0.272)#23 | 0.12%(+0.207)#1,253 |
| 24. | Southside Place | 0.33% | 0.058%(+0.268)#24 | 0.12%(+0.203)#1,271 |
| 25. | Timberwood Park | 0.32% | 0.058%(+0.260)#25 | 0.12%(+0.195)#1,300 |
| 26. | Scenic Oaks | 0.29% | 0.058%(+0.230)#26 | 0.12%(+0.165)#1,406 |
| 27. | Woodway | 0.29% | 0.058%(+0.229)#27 | 0.12%(+0.164)#1,409 |
| 28. | Kennedale | 0.28% | 0.058%(+0.221)#28 | 0.12%(+0.157)#1,437 |
| 29. | Celina | 0.27% | 0.058%(+0.212)#29 | 0.12%(+0.147)#1,474 |
| 30. | Nassau Bay | 0.27% | 0.058%(+0.210)#30 | 0.12%(+0.146)#1,476 |
| 31. | Stephenville | 0.26% | 0.058%(+0.204)#31 | 0.12%(+0.139)#1,501 |
| 32. | University Park | 0.23% | 0.058%(+0.176)#32 | 0.12%(+0.111)#1,635 |
| 33. | Fair Oaks Ranch | 0.23% | 0.058%(+0.174)#33 | 0.12%(+0.109)#1,649 |
| 34. | Dripping Springs | 0.22% | 0.058%(+0.160)#34 | 0.12%(+0.096)#1,723 |
| 35. | West Tawakoni | 0.22% | 0.058%(+0.159)#35 | 0.12%(+0.094)#1,732 |
| 36. | Sugar Land | 0.22% | 0.058%(+0.158)#36 | 0.12%(+0.093)#1,742 |
| 37. | Brushy Creek | 0.21% | 0.058%(+0.153)#37 | 0.12%(+0.088)#1,776 |
| 38. | Murphy | 0.21% | 0.058%(+0.153)#38 | 0.12%(+0.088)#1,777 |
| 39. | Tomball | 0.20% | 0.058%(+0.140)#39 | 0.12%(+0.075)#1,845 |
| 40. | Lackland Afb | 0.20% | 0.058%(+0.140)#40 | 0.12%(+0.075)#1,847 |
| 41. | Lumberton | 0.19% | 0.058%(+0.133)#41 | 0.12%(+0.068)#1,883 |
| 42. | Spring | 0.17% | 0.058%(+0.116)#42 | 0.12%(+0.051)#1,992 |
| 43. | Plano | 0.17% | 0.058%(+0.114)#43 | 0.12%(+0.049)#2,007 |
| 44. | Pearland | 0.17% | 0.058%(+0.113)#44 | 0.12%(+0.048)#2,009 |
| 45. | Shavano Park | 0.17% | 0.058%(+0.111)#45 | 0.12%(+0.046)#2,023 |
| 46. | Richardson | 0.16% | 0.058%(+0.104)#46 | 0.12%(+0.039)#2,069 |
| 47. | Highland Village | 0.16% | 0.058%(+0.099)#47 | 0.12%(+0.035)#2,103 |
| 48. | Flower Mound | 0.16% | 0.058%(+0.097)#48 | 0.12%(+0.032)#2,119 |
| 49. | Friendswood | 0.15% | 0.058%(+0.094)#49 | 0.12%(+0.029)#2,141 |
| 50. | Marshall | 0.14% | 0.058%(+0.087)#50 | 0.12%(+0.022)#2,206 |
| 51. | Hewitt | 0.14% | 0.058%(+0.085)#51 | 0.12%(+0.021)#2,213 |
| 52. | Huntsville | 0.14% | 0.058%(+0.085)#52 | 0.12%(+0.020)#2,216 |
| 53. | Terrell | 0.14% | 0.058%(+0.081)#53 | 0.12%(+0.016)#2,245 |
| 54. | Windcrest | 0.14% | 0.058%(+0.079)#54 | 0.12%(+0.014)#2,257 |
| 55. | College Station | 0.14% | 0.058%(+0.078)#55 | 0.12%(+0.013)#2,271 |
| 56. | Galveston | 0.14% | 0.058%(+0.077)#56 | 0.12%(+0.012)#2,283 |
| 57. | Converse | 0.13% | 0.058%(+0.074)#57 | 0.12%(+0.009)#2,305 |
| 58. | Coppell | 0.13% | 0.058%(+0.071)#58 | 0.12%(+0.007)#2,331 |
| 59. | Westover Hills | 0.12% | 0.058%(+0.066)#59 | 0.12%(+0.002)#2,376 |
| 60. | Addison | 0.12% | 0.058%(+0.065)#60 | 0.12%(+0.000)#2,388 |
| 61. | Conroe | 0.12% | 0.058%(+0.065)#61 | 0.12%(+0.000)#2,390 |
| 62. | Mansfield | 0.12% | 0.058%(+0.064)#62 | 0.12%(-0.001)#2,398 |
| 63. | Union Grove | 0.12% | 0.058%(+0.060)#63 | 0.12%(-0.004)#2,431 |
| 64. | Georgetown | 0.12% | 0.058%(+0.060)#64 | 0.12%(-0.004)#2,432 |
| 65. | North Richland Hills | 0.12% | 0.058%(+0.059)#65 | 0.12%(-0.006)#2,447 |
| 66. | Providence Village | 0.12% | 0.058%(+0.059)#66 | 0.12%(-0.006)#2,452 |
| 67. | Jersey Village | 0.12% | 0.058%(+0.058)#67 | 0.12%(-0.007)#2,462 |
| 68. | Copperas Cove | 0.12% | 0.058%(+0.057)#68 | 0.12%(-0.008)#2,468 |
| 69. | Amarillo | 0.11% | 0.058%(+0.056)#69 | 0.12%(-0.009)#2,486 |
| 70. | Farmers Branch | 0.11% | 0.058%(+0.053)#70 | 0.12%(-0.012)#2,506 |
| 71. | Austin | 0.11% | 0.058%(+0.052)#71 | 0.12%(-0.013)#2,520 |
| 72. | Pflugerville | 0.11% | 0.058%(+0.052)#72 | 0.12%(-0.013)#2,524 |
| 73. | Frisco | 0.11% | 0.058%(+0.051)#73 | 0.12%(-0.014)#2,533 |
| 74. | Allen | 0.11% | 0.058%(+0.048)#74 | 0.12%(-0.017)#2,561 |
| 75. | Seguin | 0.11% | 0.058%(+0.047)#75 | 0.12%(-0.017)#2,568 |
| 76. | Hackberry | 0.10% | 0.058%(+0.047)#76 | 0.12%(-0.018)#2,575 |
| 77. | Live Oak | 0.10% | 0.058%(+0.044)#77 | 0.12%(-0.021)#2,612 |
| 78. | Southlake | 0.10% | 0.058%(+0.043)#78 | 0.12%(-0.022)#2,621 |
| 79. | Olney | 0.099% | 0.058%(+0.041)#79 | 0.12%(-0.023)#2,635 |
| 80. | Cedar Park | 0.098% | 0.058%(+0.040)#80 | 0.12%(-0.025)#2,652 |
| 81. | Harker Heights | 0.097% | 0.058%(+0.039)#81 | 0.12%(-0.026)#2,668 |
| 82. | Round Rock | 0.095% | 0.058%(+0.037)#82 | 0.12%(-0.027)#2,683 |
| 83. | Wylie | 0.095% | 0.058%(+0.037)#83 | 0.12%(-0.028)#2,692 |
| 84. | Mckinney | 0.094% | 0.058%(+0.036)#84 | 0.12%(-0.029)#2,706 |
| 85. | Little Elm | 0.093% | 0.058%(+0.035)#85 | 0.12%(-0.030)#2,712 |
| 86. | Webster | 0.089% | 0.058%(+0.031)#86 | 0.12%(-0.033)#2,748 |
| 87. | San Marcos | 0.089% | 0.058%(+0.031)#87 | 0.12%(-0.033)#2,749 |
| 88. | Houston | 0.089% | 0.058%(+0.031)#88 | 0.12%(-0.034)#2,754 |
| 89. | Cedar Hill | 0.088% | 0.058%(+0.030)#89 | 0.12%(-0.035)#2,767 |
| 90. | Ennis | 0.087% | 0.058%(+0.029)#90 | 0.12%(-0.036)#2,784 |
| 91. | Missouri City | 0.083% | 0.058%(+0.025)#91 | 0.12%(-0.040)#2,825 |
| 92. | Inez | 0.082% | 0.058%(+0.024)#92 | 0.12%(-0.041)#2,835 |
| 93. | Colleyville | 0.077% | 0.058%(+0.019)#93 | 0.12%(-0.046)#2,876 |
| 94. | Leander | 0.077% | 0.058%(+0.019)#94 | 0.12%(-0.046)#2,888 |
| 95. | Magnolia | 0.076% | 0.058%(+0.018)#95 | 0.12%(-0.047)#2,893 |
| 96. | Atascocita | 0.076% | 0.058%(+0.018)#96 | 0.12%(-0.047)#2,894 |
| 97. | League City | 0.074% | 0.058%(+0.016)#97 | 0.12%(-0.049)#2,915 |
| 98. | Rockwall | 0.071% | 0.058%(+0.013)#98 | 0.12%(-0.052)#2,947 |
| 99. | Cresson | 0.070% | 0.058%(+0.012)#99 | 0.12%(-0.053)#2,963 |
| 100. | Irving | 0.068% | 0.058%(+0.010)#100 | 0.12%(-0.055)#2,981 |
Common Questions
What are the Top 10 Cities with the Highest Percentage of Immigrants from Russia in Texas?
Top 10 Cities with the Highest Percentage of Immigrants from Russia in Texas are:
#1
2.48%
#2
1.83%
#3
1.77%
#4
1.48%
#5
1.28%
#6
1.25%
#7
1.24%
#8
1.19%
#9
1.01%
#10
0.99%
What city has the Highest Percentage of Immigrants from Russia in Texas?
Pine Harbor has the Highest Percentage of Immigrants from Russia in Texas with 2.48%.
What is the Percentage of Immigrants from Russia in the State of Texas?
Percentage of Immigrants from Russia in Texas is 0.058%.
What is the Percentage of Immigrants from Russia in the United States?
Percentage of Immigrants from Russia in the United States is 0.12%.